Table of contents
- Key findings
- Summary
- Background
- Limitations
- ICD-10 Coding changes implemented in 2011
- Methods
- Results England and Wales
- Results - England
- Results - Wales
- Results - Regions of England
- Users and policy context
- Results on the Office for National Statistics Website
- References
- Background notes
- Methodology
1. Key findings
Deaths from potentially avoidable causes accounted for approximately 23% of all deaths registered in England and Wales in 2012
The leading cause of avoidable death was ischaemic heart disease in males and lung cancer in females. In 2012, these conditions represented 22% and 15% of all avoidable male and female deaths respectively in England and Wales
Avoidable mortality rates were significantly higher in Wales than in England throughout the period 2001–12
Avoidable mortality rates varied across the regions of England and tended to be highest in the North of England and lowest in the South and East of England over the period 2001–12
Between 2001 and 2006 cardiovascular diseases were the leading contributors to avoidable deaths. However, since 2007, the group of neoplasms (cancers and non-cancerous abnormal tissue growths) included in the avoidable mortality definition have taken over as the leading cause of avoidable deaths and have remained so since
There has been no significant decrease in the mortality rate from neoplasms that are considered to be avoidable since 2009
2. Summary
This bulletin presents mortality figures for causes of death that are considered avoidable in the presence of timely and effective healthcare or public health interventions (avoidable mortality). Figures are presented for England and Wales and the regions of England for the period 2001–2012. Trends in mortality by causes considered preventable (preventable mortality) or amenable to healthcare (amenable mortality), which are subsets of total avoidable mortality are also presented.
Mid year population estimates for English regions for 2002–2010 have been revised in light of the 2011 Census populations. Previously published data on avoidable mortality relating to this period have therefore been revised in this bulletin.
Figure 1: Age-standardised mortality rates for causes of death considered avoidable, amenable or preventable and all causes of death, 2003-12
England and Wales
Source: Office for National Statistics
Notes:
- Figures are for deaths registered in each calendar year and includes deaths of non-residents
- Reference table 1 provides further details of underlying causes of death included
- Age-standardised rates per 100,000 population, standardised to the 1976 European Standard Population
Download this chart Figure 1: Age-standardised mortality rates for causes of death considered avoidable, amenable or preventable and all causes of death, 2003-12
Image .csv .xlsDefinition of Amenable, Preventable and Avoidable mortality
Amenable mortality:
A death is amenable (treatable) if, in the light of medical knowledge and technology at the time of death, all or most deaths from that cause (subject to age limits if appropriate) could avoided through good quality healthcare.
Preventable mortality:
A death is preventable if, in the light of understanding of the determinants of health at time of death, all or most deaths from that cause (subject to age limits if appropriate) could be avoided by public health interventions in the broadest sense.
Avoidable mortality:
Avoidable deaths are all those defined as preventable, amenable or both, where each death is counted only once. Where a cause of death is both preventable and amenable, all deaths from that cause are counted in both categories when they are presented separately.
Back to table of contents3. Background
It is widely accepted that the contribution of healthcare to improvements in population health ought to be quantified. An indicator widely used in measuring this contribution is avoidable mortality, which is based on the concept that premature deaths from certain conditions should not occur in the presence of timely and effective healthcare.
Although research on avoidable mortality has gone on for the last three decades, there is little consensus among researchers about how to define it. According to Kossarova et al., (2009) the concept of ‘avoidability’ dates back to the early 20th century where confidential enquiries were made into maternal deaths in an attempt to identify improvements.
The concept of avoidable mortality was first introduced by Rutstein et al. in the 1970s. Rutstein argued that in order to develop effective indicators of health care a number of disease lists should be drawn up which should not, or should only infrequently, give rise to death or disability (Rutstein et al., 1976). Subsequently, several papers have reported on regional variation from conditions avoidable due to medical intervention.
Rutstein also noted that the list of conditions considered to be avoidable would need to be updated in light of improvements in medical knowledge and practice, as well as social and environmental changes. As a result, their original lists were revised in 1980 to take these and the move to the Ninth Revision of the International Classification of Diseases (ICD-9) into account.
In England and Wales, Charlton et al., (1983) were the first to examine avoidable mortality. They investigated the geographic variations in mortality between 1974 and 1978 using 14 amenable causes of death selected from Rutstein’s list. As with several researchers after them, they excluded conditions such as lung cancer, whose avoidance was considered to be outside the scope of medical care. They found that even after adjusting for social factors, substantial variations in avoidable deaths remained and they urged future studies to examine this further in relation to health-service inputs.
Following Charlton’s work, an attempt was made to compile an atlas on avoidable mortality in the European Community (EC).The conditions included in this atlas were meant to provide warning signals of potential shortcomings in health care delivery. It also provided conditions for which a proportion of deaths can be prevented (Holland, 1997 cited by Kossarova et al., (2009).
The atlas also provided a basis for the more recent concept of avoidable mortality which differentiates between conditions amenable to healthcare (treatable) and those preventable through wider public health policies. Some of the more recent lists of avoidable causes of death include those produced by Nolte and McKee (2004) and Page et al.,(2006). These cause lists were adopted as the basis for the definition of avoidable mortality used by ONS. They have been amended and updated to make them more relevant to the United Kingdom and to take account of more recent developments in health public policy
Back to table of contents4. Limitations
One of the main difficulties in producing an indicator of avoidable mortality is the selection of the causes of death for inclusion. While a particular condition can be considered to be avoidable, this does not mean that every death from that condition could be prevented. This is because factors such as the age of the patient, the extent of disease progression at diagnosis or the existence of other medical conditions are not taken into account when compiling a list of causes.
Several studies have shown that deaths from causes amenable to healthcare are declining at a much faster rate than those from non-amenable causes and that this decline has coincided with the introduction of specific improvements in healthcare. However, some studies have found only a weak association, if any, between the levels of healthcare supply and geographical variations in amenable mortality. According to Nolte and McKee (2004) these studies are largely focused on quantitative measures such as healthcare expenditure and the number of healthcare professionals, not necessarily measures of the quality of healthcare systems. They therefore argued that the lack of demonstrable association is in fact not entirely surprising. Furthermore, there is likely to be a substantial time lag between change in resources, the introduction of a healthcare innovation or public health policy and a corresponding reduction in mortality. As a result, improvements in the healthcare system may not necessarily be evident from mortality figures in the short or medium term.
In a review of published work on amenable mortality, Mackenbach et al., (1990) noted that geographical variations were strongly linked to socioeconomic factors which may in turn reflect the differences in timely access to healthcare. Geographical variations may also simply be a result of random variations in disease incidence. For example, if there was a sudden increase in the incidence of a particular condition, and consequently an increase in the mortality rate for this condition, this might be mistakenly interpreted as a decrease in the quality of healthcare.
It is noteworthy that avoidable mortality was not intended to serve as a definitive source of evidence of differences in effectiveness of healthcare systems; rather it was designed to highlight areas of potential weaknesses in healthcare that could benefit from further in-depth investigation (Nolte and McKee, 2004). It is therefore anticipated that the statistics provided in this bulletin would help in assessing the quality and performance of healthcare as well as wider public health policies. However, in light of the limitations above, a degree of caution is required when interpreting the data.
Back to table of contents5. ICD-10 Coding changes implemented in 2011
In January 2011, ONS introduced a new version of ICD-10 (version 2010), which replaced the version introduced in 2001 (version 2001.2).
Although these changes affected a number of causes of death, the number of avoidable deaths from illicit drug use disorders presented in reference table 3. To understand the impact of the introduction of ICD-10 v2010 on mortality statistics, ONS carried out a bridge coding study in which a sample of deaths that had previously been coded using v2001.2 were then independently recoded using the new version of ICD-10 (Office for National Statistics, 2011).
However, not all of the information provided by coroners at registration was available to use when recoding deaths, so the bridge coding study results for drug-related deaths should be treated with caution. The impact of the new version of ICD-10 on drug-related deaths figures was not reported in the bridge coding study. However, analysis presented in the 2011 drug-related deaths bulletin showed that the number of deaths coded as illicit drug use disorders (ICD-10 codes F11–F16 and F18–F19) decreased by 84 per cent in v2010, compared with v2001.2.
This decrease is due to these deaths being allocated to accidental poisonings by drugs (ICD-10 code X40–X44), which consequently increased by 44 per cent. This means that figures for 2011 onwards will not be directly comparable with figures for 2001 to 2010
Back to table of contents6. Methods
Following a public consultation on what the ONS definition of avoidable mortality should be, it was decided ONS would present avoidable mortality statistics using directly age-standardised rates. This measure is widely used in presenting mortality statistics and there is a standard method for carrying out the calculations. In this bulletin, figures are also presented using standardised years of life lost. This is solely in response to demand from customers and does not reflect a change to ONS’s formal measure of avoidable mortality. It should be noted that the two measures are not directly comparable (see Results section), and figures based on standardised years of life lost are presented for England and Wales only.
Age-standardised rates were calculated using the number of potentially avoidable deaths registered in each year as the numerator and the mid-year population estimate for that year as the denominator. These rates were calculated for all avoidable, preventable and amenable deaths as well as cause groups within these categories. Although age limits were set for some cause groups, rates were calculated using persons of all ages as the denominator. This method was adopted since the entire population is at risk of mortality due to causes considered to be avoidable at an aggregate level and also to allow data by cause group, amenable and preventable categories to be presented on a comparable basis.
Potential years of life lost (PYLL) is a measure of the potential number of years lost when a person dies prematurely from any cause. The basic concept underpinning PYLL is that deaths at younger ages are weighted more heavily than those at older ages. The advantage in doing this is that deaths at younger ages may be perceived to be of less importance if cause specific death rates alone were used in highlighting the burden of disease and injury since conditions such as cancer and heart disease often occur at older ages and have relatively high mortality rates.
In this bulletin, PYLL are expressed as age-standardised years of life lost (SYLL). These rates represent the potential years of life lost if the population of England and Wales had the same population structure as the 1976 European Standard Population. SYLL rates are presented as years of life lost per 100,000 population.
PYLL is calculated as the sum of the mortality rate in each age group weighted by the potential number of years of life lost as indicated by remaining life expectancy for each age group. To calculate the SYLL, this is then standardised to the 1976 European Standard Population (ESP) as shown below.
Calculation of age-standardised years of life lost (SYLL)

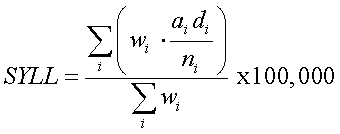
Method for calculating SYLL using the 1976 European Standard Population.
Where:
i is the age group (<1, 1-4, 5-9, 10-14….85+)
di is the number of deaths in age group i
ai is the weight, or average age-specific period life expectancy in age group i for a given year
ni is the population in age group i
wi is the number of individuals in the standard population in age group i
7. Results England and Wales
Data are available for the twelve year period 2001–2012 in the references tables provided with this bulletin. The commentary in this results section concentrates on trends over the last ten years (2003–2012) for ease of presentation.
In 2003, deaths from potentially avoidable causes accounted for approximately 25% (135,724 out of 532,498) of all deaths registered in England and Wales. Since then the proportion of deaths has fallen with avoidable deaths accounting for approximately 23% (112,493 out of 499,331) of all deaths in 2012.
Men are more likely to die from potentially avoidable causes than women, with about 28% (67,548 out of 240,238) dying from avoidable conditions compared with 17% (44,945 out of 259,093) of women in 2012.
Between 2003 and 2012, the age-standardised mortality rate for potentially avoidable causes fell from 230.8 deaths per 100,000 population to 170.4 per 100,000 population. The decline in rates occurred at a faster pace for men than for women over this period. While the rate for men fell by approximately 28% from 296.0 per 100,000 in 2003 to 213.1 per 100,000 population in 2012, for women the decrease was from 169.9 to 129.9 per 100,000, a 24% fall.
Amenable mortality rates decreased at a faster rate than preventable mortality rates. Amenable mortality rates decreased by 36% from 127.8 per 100,000 population in 2003 to 82.1 per 100,000 population in 2012. Preventable mortality rates showed a smaller decrease of 24% from 185.9 per 100,000 in 2003 to 140.9 per 100,000 in 2012.
Overall, ischaemic heart disease (IHD) was the leading cause of avoidable deaths for males and females combined, accounting for 17% (19,674 out of 112,493) of all avoidable deaths in 2012. However, the leading cause of avoidable mortality was different when results for males and females were analysed separately. For males, it was ischaemic heart disease, accounting for 22% of all avoidable male deaths. In contrast, malignant neoplasm of trachea, bronchus and lung (lung cancer) was the leading cause in females, accounting for 15% of all avoidable female deaths. The relative impact of IHD on male and female avoidable mortality rate is shown in Figure 2.
Figure 2: Age-standardised mortality rates for causes of death considered avoidable (including and excluding Ischaemic Heart Disease (IHD)) by sex, 2003-12
England and Wales
Source: Office for National Statistics
Notes:
- Figures are for deaths registered in each calendar year and includes deaths of non-residents
- Reference table 1 provides further details of underlying causes of death included
- Age-standardised rates per 100,000 population, standardised to the 1976 European Standard Population
Download this chart Figure 2: Age-standardised mortality rates for causes of death considered avoidable (including and excluding Ischaemic Heart Disease (IHD)) by sex, 2003-12
Image .csv .xlsAnalysis of causes of avoidable death at a broader level (cause groups) showed that cardiovascular diseases were the largest contributors to avoidable deaths between 2001 and 2006. In 2007, the group of neoplasms included in the avoidable mortality definition became the leading cause of avoidable deaths and have remained so since. The change in ranking occurred because deaths from cardiovascular diseases were falling at a much faster pace than deaths from these neoplasms. While the mortality rate for avoidable cardiovascular diseases fell by 45% from 85.6 per 100,000 population in 2003 to 47.2 per 100,000 in 2012, the rate for avoidable neoplasms fell by only 12% (70.7 to 62.1 per 100,000) in the same period. There has been no significant decrease in the mortality rate from neoplasms that are considered to be avoidable since 2009.
Unlike in 2011, the cause with the highest avoidable mortality rate in 2012 did not differ by sex. Avoidable neoplasms had the highest mortality rate for males (67.0 per 100,000) and for females (57.7 per 100,000). In 2011, rates were highest for cardiovascular diseases in men and neoplasms in women.
The avoidable mortality rates for all cause groups examined fell significantly between 2003 and 2012. However, for many of the groups there were considerable fluctuations in this period with the exception of cardiovascular disease which saw noticeable decreases throughout the period.
Figure 3: Age-standardised mortality rates for grouped causes of death considered avoidable, 2003-12
England and Wales
Source: Office for National Statistics
Notes:
- Figures are for deaths registered in each calendar year and includes deaths of non-residents
- Reference table 1 provides further details of underlying causes of death included
- Age-standardised rates per 100,000 population, standardised to the 1976 European Standard Population
Download this chart Figure 3: Age-standardised mortality rates for grouped causes of death considered avoidable, 2003-12
Image .csv .xlsOverall avoidable mortality trends were similar regardless of the indicator used, with both age-standardised rates and SYLL decreasing in each year between 2003 and 2012. For males, 6,394 potential years of life per 100,000 population were lost by those who died from conditions considered avoidable in 2003 compared with 5,074 years of life per 100,000 lost in 2012. For females, the comparable years of life lost were 4,066 per 100,000 in 2003 and 3,349 per 100,000 in 2012.
When ranked according to SYLL cardiovascular disease had the highest years of life lost for males in 2012 (1,406 years per 100,000) while avoidable neoplasms was highest for females (1,447 years per 100,000).
There have been significant reductions in the number of years of life lost since 2003. For males, there was a 36% decrease in the number of potential years of life lost for cardiovascular disease deaths between 2003 and 2012. For females, the comparable decrease was 4% for avoidable neoplasms.
Back to table of contents8. Results - England
The avoidable mortality rate for all persons in England fell significantly by 26% from 228.2 per 100,000 population in 2003 to 168.1 per 100,000 in 2012. Rates for males and females fell significantly from 292.6 to 210.3 per 100,000 and 168.0 to 128.1 per 100,000 respectively over the same period.
In 2012, avoidable neoplasms and cardiovascular diseases were ranked the first and second largest contributors, respectively, to overall avoidable mortality. This was not always the case. While avoidable mortality rates and the number of deaths from cardiovascular diseases were the highest of all the groups of avoidable causes in 2001, by 2007 the rates and number of deaths were higher for avoidable neoplasms. In a recent study, Bajekal et al (2012) found that medical and surgical treatments were responsible for about half of the decline in mortality from coronary heart disease, a sub-group of cardiovascular diseases, observed in England between 2000 and 2007. A further third of this decline was attributed to changes in lifestyle and behavioural risk factors such as smoking and physical activity. However, they also noted that the benefits of improvements in blood pressure, cholesterol levels, smoking and physical activity were partly negated by increases in body mass index and diabetes.
Figure 4: Age-standardised mortality rates for causes of death considered avoidable by country and sex, 2003-12
Source: Office for National Statistics
Notes:
- Figures are for deaths registered in each calendar year and includes deaths of non-residents
- Reference table 1 provides further details of underlying causes of death included
- Age-standardised rates per 100,000 population, standardised to the 1976 European Standard Population
Download this chart Figure 4: Age-standardised mortality rates for causes of death considered avoidable by country and sex, 2003-12
Image .csv .xls9. Results - Wales
Avoidable mortality rates were significantly higher in Wales than in England throughout the period 2003–12.
The difference in rates between both countries over the period appears to be largely due to the contribution of cardiovascular diseases and avoidable neoplasms to overall avoidable mortality in Wales. Cardiovascular diseases and avoidable neoplasms were the only cause groups with significantly higher rates in Wales than in England.
Avoidable mortality rates fell in Wales by 23% from 252.4 per 100,000 in 2003 to 193.5 per 100,000 in 2012; this is a smaller decrease than that observed in England. Avoidable mortality rates in Wales were higher for males than for females in all years, however, larger proportional reductions occurred in male mortality rates (Tables 1 and 2). Rates for males fell from 323.3 per 1000,000 in 2003 to 240.0 per 1000,000 in 2012 where as female rates fell from 186.3 in 2003 to 148.9 in 2012.
Back to table of contents10. Results - Regions of England
Avoidable mortality rates differed across regions of England. Rates were generally higher in the north than the south. In 2012, rates for males were highest in the North West (253.5 per 100,000 population) and lowest in the East of England (181.1 per 100,000). For females, rates were highest in the North West (159.0 per 100,000) but lowest in the South East (111.5 per 100,000).
Avoidable mortality rates fell in all regions between 2003 and 2012. The largest decrease was observed in London where rates fell by 31% from 308.6 to 211.7 per 100,000 for males and by 34% from 170.9 to 119.0 per 100,000 for females. The smallest change in rates over the period was in the South West for males (26%) and in Yorkshire and The Humber for females (21%).
Figure 5a: Age-standardised mortality rates (with 95% confidence intervals) for causes of death considered avoidable by region and sex, 2012
England Regions, Male
Source: Office for National Statistics
Notes:
- Figures are for deaths registered in each calendar year and includes deaths of non-residents
- Reference table 1 provides further details of underlying causes of death included.
- Age-standardised rates per 100,000 population, standardised to the 1976 European Standard Population
Download this chart Figure 5a: Age-standardised mortality rates (with 95% confidence intervals) for causes of death considered avoidable by region and sex, 2012
Image .csv .xls
Figure 5b: Age-standardised mortality rates (with 95% confidence intervals) for causes of death considered avoidable by region and sex, 2012
England Regions, Female
Source: Office for National Statistics
Notes:
- Figures are for deaths registered in each calendar year and includes deaths of non-residents
- Reference table 1 provides further details of underlying causes of death included.
- Age-standardised rates per 100,000 population, standardised to the 1976 European Standard Population
Download this chart Figure 5b: Age-standardised mortality rates (with 95% confidence intervals) for causes of death considered avoidable by region and sex, 2012
Image .csv .xlsDate tables - Males
Table 1: Male avoidable mortality rates: by country and region of England, 2003-2012
| Country/region | 2003 | 2004 | 2005 | 2006 | 2007 | 2008 | 2009 | 2010 | 2011 | 2012 |
| England and Wales | 296.0 | 280.3 | 271.9 | 261.2 | 253.7 | 249.0 | 239.4 | 231.3 | 221.2 | 213.1 |
| England | 292.6 | 277.3 | 268.9 | 258.2 | 250.1 | 245.9 | 236.0 | 228.6 | 218.4 | 210.3 |
| North East | 353.8 | 345.0 | 324.9 | 309.2 | 294.5 | 297.4 | 278.1 | 265.2 | 265.6 | 249.9 |
| North West | 348.0 | 331.9 | 324.8 | 310.6 | 301.5 | 298.0 | 287.6 | 276.6 | 264.7 | 253.5 |
| Yorkshire and The Humber | 307.7 | 295.0 | 288.8 | 277.4 | 269.6 | 268.1 | 253.9 | 245.5 | 242.3 | 232.4 |
| East Midlands | 293.2 | 269.6 | 262.4 | 246.2 | 246.7 | 244.2 | 235.5 | 230.1 | 218.6 | 207.4 |
| West Midlands | 314.2 | 296.1 | 288.2 | 278.4 | 268.7 | 264.1 | 249.1 | 239.0 | 227.2 | 220.6 |
| East | 247.7 | 238.0 | 230.4 | 222.1 | 216.9 | 209.8 | 202.8 | 200.7 | 189.1 | 181.1 |
| London | 308.6 | 288.3 | 274.5 | 267.0 | 252.2 | 247.6 | 232.3 | 226.0 | 210.8 | 211.7 |
| South East | 253.8 | 239.0 | 230.8 | 223.7 | 215.1 | 208.2 | 208.6 | 200.4 | 189.4 | 182.8 |
| South West | 247.6 | 237.9 | 234.1 | 224.5 | 220.9 | 217.2 | 210.5 | 204.0 | 196.9 | 188.6 |
| Wales | 323.3 | 298.1 | 293.8 | 284.5 | 285.7 | 269.5 | 269.6 | 254.6 | 246.0 | 240.0 |
| Source: Office for National Statistics | ||||||||||
| Notes: | ||||||||||
| 1. Figures are for deaths registered in the calendar year | ||||||||||
| 2. See reference table 1 for details of the causes of death included and age-limits used for avoidable causes | ||||||||||
| 3. Rates per 100,000 population, standardised to the 1976 European Standard Population | ||||||||||
| 4. Deaths of non-residents are included in figures for England and Wales combined but are excluded in figures for England, Wales and regions | ||||||||||
| 5. Rates for 2002 to 2010 are based on mid-year population estimates revised in light of the 2011 Census | ||||||||||
Download this table Table 1: Male avoidable mortality rates: by country and region of England, 2003-2012
.xls (30.2 kB)
Table 2: Number of male avoidable deaths: by country and region of England, 2003-2012
| Deaths | ||||||||||
| Country/region | 2003 | 2004 | 2005 | 2006 | 2007 | 2008 | 2009 | 2010 | 2011 | 2012 |
| England and Wales | 82,640 | 79,042 | 77,502 | 75,152 | 74,004 | 73,899 | 72,353 | 71,042 | 68,839 | 67,548 |
| England | 76,890 | 73,565 | 72,112 | 69,881 | 68,632 | 68,670 | 67,116 | 66,078 | 63,978 | 62,756 |
| North East | 4,972 | 4,852 | 4,618 | 4,402 | 4,232 | 4,334 | 4,082 | 3,948 | 4,002 | 3,828 |
| North West | 12,669 | 12,177 | 12,016 | 11,591 | 11,383 | 11,422 | 11,207 | 10,919 | 10,558 | 10,290 |
| Yorkshire and The Humber | 8,175 | 7,946 | 7,862 | 7,629 | 7,515 | 7,581 | 7,303 | 7,165 | 7,161 | 6,960 |
| East Midlands | 6,819 | 6,332 | 6,282 | 5,949 | 6,057 | 6,123 | 6,025 | 6,006 | 5,778 | 5,575 |
| West Midlands | 8,991 | 8,566 | 8,413 | 8,183 | 7,992 | 7,970 | 7,655 | 7,468 | 7,198 | 7,072 |
| East | 7,425 | 7,206 | 7,089 | 6,891 | 6,841 | 6,749 | 6,629 | 6,679 | 6,355 | 6,242 |
| London | 9,754 | 9,139 | 8,732 | 8,537 | 8,156 | 8,149 | 7,806 | 7,721 | 7,293 | 7,412 |
| South East | 10,935 | 10,423 | 10,196 | 9,997 | 9,784 | 9,641 | 9,847 | 9,684 | 9,259 | 9,176 |
| South West | 7,150 | 6,924 | 6,904 | 6,702 | 6,672 | 6,701 | 6,562 | 6,488 | 6,374 | 6,201 |
| Wales | 5,307 | 4,987 | 4,974 | 4,843 | 4,928 | 4,749 | 4,827 | 4,602 | 4,496 | 4,448 |
| Source: Office for National Statistics | ||||||||||
| Notes: | ||||||||||
| 1. Figures are for deaths registered in the calendar year 2 See reference table | ||||||||||
| 2. See reference table 1 for details of the causes of death included and age-limits used for avoidable causes | ||||||||||
| 3. Deaths of non-residents are included in figures for England and Wales combined but are excluded in figures for England, Wales and regions | ||||||||||
Download this table Table 2: Number of male avoidable deaths: by country and region of England, 2003-2012
.xls (57.3 kB)Data tables - Females
Table 3: Female avoidable mortality rates: by country and region of England, 2003-2012
| Rate per 100,000 population | ||||||||||
| Country/region | 2003 | 2004 | 2005 | 2006 | 2007 | 2008 | 2009 | 2010 | 2011 | 2012 |
| England and Wales | 169.9 | 161.6 | 157.3 | 152.8 | 148.6 | 148.3 | 139.9 | 137.3 | 132.6 | 129.9 |
| England | 168.0 | 159.9 | 155.6 | 151.2 | 146.6 | 146.3 | 138.3 | 135.6 | 130.9 | 128.1 |
| North East | 203.7 | 198.4 | 186.2 | 187.2 | 176.9 | 176.0 | 165.9 | 162.6 | 165.0 | 155.9 |
| North West | 199.6 | 190.8 | 186.9 | 183.2 | 179.9 | 181.1 | 170.8 | 168.4 | 161.2 | 159.0 |
| Yorkshire and The Humber | 177.2 | 168.6 | 169.0 | 162.4 | 161.1 | 158.7 | 151.4 | 148.3 | 146.8 | 138.3 |
| East Midlands | 170.2 | 162.6 | 156.3 | 149.7 | 148.6 | 149.5 | 141.1 | 130.8 | 130.5 | 130.6 |
| West Midlands | 171.9 | 164.5 | 160.6 | 159.2 | 150.5 | 153.0 | 143.2 | 141.3 | 134.4 | 132.1 |
| East | 146.1 | 138.8 | 136.4 | 132.4 | 127.7 | 130.7 | 120.3 | 119.9 | 115.0 | 115.9 |
| London | 170.9 | 161.4 | 152.1 | 143.2 | 139.3 | 138.1 | 129.5 | 129.3 | 120.4 | 119.0 |
| South East | 148.7 | 140.7 | 137.4 | 135.5 | 129.9 | 125.8 | 120.6 | 118.7 | 114.6 | 111.5 |
| South West | 144.6 | 136.8 | 134.8 | 129.4 | 124.5 | 125.3 | 123.1 | 118.6 | 115.0 | 112.1 |
| Wales | 186.3 | 175.9 | 172.0 | 166.3 | 169.1 | 167.4 | 153.1 | 153.8 | 149.2 | 148.9 |
| Source: Office for National Statistics | ||||||||||
| Notes: | ||||||||||
| 1. Figures are for deaths registered in the calendar year | ||||||||||
| 2. See reference table 1 for details of the causes of death included and age-limits used for avoidable causes | ||||||||||
| 3. Rates per 100,000 population, standardised to the 1976 European Standard Population | ||||||||||
| 4. Deaths of non-residents are included in figures for England and Wales combined but are excluded in figures for England, Wales and regions | ||||||||||
| 5. Rates for 2002 to 2010 are based on mid-year population estimates revised in light of the 2011 Census | ||||||||||
Download this table Table 3: Female avoidable mortality rates: by country and region of England, 2003-2012
.xls (31.2 kB)
Table 4: Number of female avoidable deaths: by country and region of England, 2003-2012
| Deaths | ||||||||||
| Country/region | 2003 | 2004 | 2005 | 2006 | 2007 | 2008 | 2009 | 2010 | 2011 | 2012 |
| England and Wales | 53,084 | 50,832 | 49,830 | 48,682 | 47,970 | 48,543 | 46,450 | 46,095 | 45,071 | 44,945 |
| England | 49,422 | 47,327 | 46,372 | 45,301 | 44,499 | 45,043 | 43,214 | 42,855 | 41,911 | 41,723 |
| North East | 3,257 | 3,163 | 2,990 | 2,990 | 2,846 | 2,869 | 2,745 | 2,682 | 2,759 | 2,667 |
| North West | 8,219 | 7,853 | 7,699 | 7,523 | 7,539 | 7,696 | 7,336 | 7,274 | 7,047 | 7,057 |
| Yorkshire and The Humber | 5,273 | 5,045 | 5,057 | 4,902 | 4,919 | 4,899 | 4,707 | 4,682 | 4,669 | 4,453 |
| East Midlands | 4,357 | 4,208 | 4,117 | 3,985 | 3,980 | 4,081 | 3,923 | 3,677 | 3,706 | 3,787 |
| West Midlands | 5,478 | 5,299 | 5,207 | 5,192 | 4,974 | 5,094 | 4,851 | 4,818 | 4,633 | 4,611 |
| East | 4,883 | 4,685 | 4,630 | 4,588 | 4,470 | 4,602 | 4,335 | 4,367 | 4,250 | 4,365 |
| London | 6,031 | 5,714 | 5,427 | 5,085 | 5,003 | 5,020 | 4,753 | 4,857 | 4,570 | 4,596 |
| South East | 7,214 | 6,861 | 6,782 | 6,764 | 6,568 | 6,510 | 6,312 | 6,314 | 6,173 | 6,123 |
| South West | 4,710 | 4,499 | 4,463 | 4,272 | 4,200 | 4,272 | 4,252 | 4,184 | 4,104 | 4,064 |
| Wales | 3,440 | 3,308 | 3,260 | 3,164 | 3,269 | 3,279 | 3,031 | 3,055 | 2,974 | 3,038 |
| Source: Office for National Statistics | ||||||||||
| Notes: | ||||||||||
| 1. Figures are for deaths registered in the calendar year | ||||||||||
| 2. See reference table 1 for details of the causes of death included and age-limits used for avoidable causes | ||||||||||
| 3. Deaths of non-residents are included in figures for England and Wales combined but are excluded in figures for England, Wales and regions | ||||||||||
Download this table Table 4: Number of female avoidable deaths: by country and region of England, 2003-2012
.xls (28.2 kB)11. Users and policy context
Statistics on avoidable mortality are used by central government, public health observatories, academia and charitable organisations working to reduce the prevalence of specific diseases and conditions deemed to be avoidable causes of death.
One of the main expected uses of these statistics is the monitoring of the quality performance of healthcare and public health policies. The Department of Health uses Potential Years of Life Lost from causes considered amenable to healthcare for children and young people in its NHS Outcomes Framework 2014/15 (Department of Health, 2013) and mortality from preventable causes as an indicator in its Public Health Outcomes Framework to reduce preventable ill health, people dying prematurely and to reduce the gap between communities (Department of Health, 2013).
There has been considerable local and international interest in the development of statistics on avoidable mortality in the last two decades. In the UK, charitable organisations such as the Hepatitis C Trust, the British Lung Foundation and the British Association for the Study of Liver (BASL) are keen to see the conditions or diseases they campaign about included in the list of causes of death considered avoidable. It is anticipated that inclusion in these conditions on the cause list would draw increased attention towards them and allow comparisons of trends to be made against other conditions.
At an international level, the European Union funded project ‘Avoidable mortality in the European Union: Towards better indicators for the effectiveness of health systems’ (AMIEHS, 2011) aims to develop a list of indicators (causes of death) for which mortality rates are likely to reflect variations in the effectiveness of healthcare, as defined by primary care, hospital care and personalised health services. To date, the project has developed an ATLAS containing trends in mortality for 45 possible amenable causes. Similarly, the Office for Economic Co-operation and Development (OECD) published a working paper in 2011 titled: ‘Mortality amenable to healthcare in 31 OECD countries: estimates and methodological issues’. The study assessed the feasibility of using amenable mortality as an indicator of the performance of healthcare systems in OECD countries, concluding that the potential for this indicator for cross-country comparisons of healthcare effectiveness is very high.
Back to table of contents12. Results on the Office for National Statistics Website
Avoidable mortality figures for England and Wales combined, England, Wales and the regions of England are available on the ONS website.
The workbooks contain:
results for England and Wales (combined and separately) – age-standardised rates per 100,000 population (with 95% confidence intervals), standardised years of life lost and the numbers of deaths for causes considered avoidable, amenable and preventable for the period 2001–12. Data are available by cause group: infections; neoplasms (cancers); drug use disorders; cardiovascular diseases; respiratory diseases; injuries; and other conditions
results for England and Wales (combined and separately) and the regions of England – age-standardised rates per 100,000 population (with 95% confidence intervals) and the numbers of deaths for causes considered avoidable, amenable and preventable for the period 2001–12. Data are for males, females and all persons
results for England and Wales (combined and separately) – underlying dataset containing the number of deaths for each avoidable mortality cause group, broken down by sex and five-year age groups