Table of contents
- Main findings
- Summary
- Method for calculating excess winter mortality
- EWM trends in England and Wales
- EWM and temperature
- EWM and influenza rates
- EWM by sex and age
- EWM by geography
- Final EWM in 2011/12 by underlying cause of death
- Causes of excess winter mortality
- Policy context
- Uses of EWM data
- Comparisons with the rest of the UK
- References
- Background notes
- Methodology
1. Main findings
An estimated 31,100 excess winter deaths occurred in England and Wales in 2012/13 – a 29% increase compared with the previous winter
As in previous years, there were more excess winter deaths in females than in males in 2012/13
Between 2011/12 and 2012/13 male excess winter deaths increased from 10,590 to 13,100, and female deaths from 13,610 to 18,000
The majority of deaths occurred among those aged 75 and over; there were 25,600 excess winter deaths in this age group in 2012/13 compared with 5,500 in people aged under 75
The excess winter mortality index was highest in the North West in 2012/13 and lowest in London. London had the highest level of excess winter mortality in 2011/12
2. Summary
In common with other countries, in England and Wales more people die in the winter than in the summer. This statistical bulletin presents provisional figures of excess winter deaths (also referred to as excess winter mortality – EWM) in England and Wales for the winter period 2012/13, and final figures for the winter period 2011/12. Historical trends from 1950/51 onwards are also presented for comparison. Figures are presented by sex, age, area and cause of death. Figures on temperature and influenza incidence are also provided to add context to the mortality figures.
In 2012/13 19.6% more people died in the winter months compared with the non-winter months, up from 15.5% in 2011/12. There were an estimated 31,100 excess winter deaths in England and Wales in 2012/13 – a 29% increase compared with the previous winter. As in previous years, there were more excess winter deaths in females than in males in 2012/13 (18,000 compared with 13,100), and the majority of deaths occurred among those aged 75 and over. There were 25,600 excess winter deaths in this older age group in 2012/13 compared with just 5,500 in people aged under 75.
Winter 2012/13 was characterised by a milder than average December, followed by a prolonged period of lower than average temperatures. March 2013 was the coldest since 1962 with an average monthly temperature of just 2.6°C. The number of deaths peaked in the first week of January, which coincided with a peak in rates of influenza-like illness over the Christmas weeks. The mean number of daily deaths was higher than average for a prolonged period between February and April 2013.
Back to table of contents3. Method for calculating excess winter mortality
Excess deaths
The ONS standard method defines the winter period as December to March, and compares the number of deaths that occurred in this winter period with the average number of deaths occurring in the preceding August to November and the following April to July:
EWM = winter deaths – average non-winter deaths
This produces the number of excess winter deaths, which is then rounded to the nearest 10 for final data and to the nearest 100 for provisional data.
Excess winter mortality index
The EWM index is calculated so that comparisons can be made between sexes, age groups and regions, and is calculated as the number of excess winter deaths divided by the average non-winter deaths:
EWM Index = (EWM / average non-winter deaths) x 100
The EWM index is presented with 95% confidence intervals, which are calculated as:
EWM index ± 1.96 x (EWM Index / √ EWM)
The EWM index is expressed as a percentage and reported to one decimal place.
More details about how EWM is calculated are available in Background notes 2 and 3.
Back to table of contents4. EWM trends in England and Wales
In England and Wales there were an estimated 31,100 excess winter deaths in winter 2012/13. This equates to around 19.6% more deaths in the winter period, compared with the non-winter period. There was a 29% increase in the number of excess winter deaths in 2012/13 compared with the previous winter of 2011/12 when there were 24,200 excess winter deaths. The number of excess winter deaths in 2012/13 was the highest since 2008/09, yet was still 17% lower than the 36,450 excess winter deaths reported for the 2008/09 winter.
Historical trends in EWM in England and Wales are presented in Figure 1 for deaths occurring between 1950/51 and 2012/13. A five-year moving average is also presented to smooth out any short-term fluctuations. This shows that a sharp drop in EWM occurred between 1960/61 and 1965/66, followed by a slight increase and another sharp drop between 1969/70 and 1972/73. The EWM levels then followed a gradual decrease, albeit with some fluctuations from 1973/74 up until 1996/97.
There were relatively high numbers of deaths in the winters of 1998/99 and 1999/2000, but deaths dropped sharply the following winter. This decreasing trend in EWM continued until 2005/06, after which the smoothed trend line demonstrates there has been a gradual rise in EWM.
Figure 1: Excess winter deaths: by year and five-year central moving average, 1950/51–2012/13
England and Wales
Source: Office for National Statistics.
Notes:
- EWM figures are based on deaths occurring in each period.
- Data include non-residents who died in England or Wales.
Download this chart Figure 1: Excess winter deaths: by year and five-year central moving average, 1950/51–2012/13
Image .csv .xls5. EWM and temperature
Mean number of daily deaths and mean monthly temperature
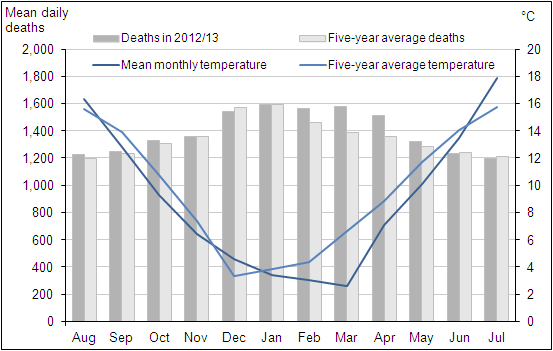
When mortality data for 2012/13 were compared with the five-year average of deaths occurring between 2007/08 and 2011/12 in the relevant months (Figure 2), the number of deaths were higher than average in February, March and April 2013.
After a comparatively warm winter in 2011/12, the winter of 2012/13 was the coldest since 2009/10. However, the mean winter temperature masks considerable variability in the monthly temperatures which may explain the monthly variation in mortality.
The number of deaths occurring in December 2012 was slightly lower than average, possibly due to the warmer than average temperatures experienced in this month. January had the highest mortality, with mortality close to average January levels despite a period of colder than average temperatures. However this peak coincided with the national peak for circulating respiratory virus activity (Public Health England, 2013a).
The mean number of daily deaths in March 2013 was 14% higher than average at 1,582 deaths per day, with mortality levels higher than December and almost as high as those seen in January.
Temperatures in February and March were below average. Most notably, winter 2012/13 had an unusually cold March, with the lowest average temperature since 1962, and temperatures remained below average during spring 2013. This period also coincides with prolonged influenza A(H3N2) circulation (Public Health England, 2013a).
Mortality remained higher than average until mid-April when temperatures increased to levels closer to the average for the time of year (Met Office Hadley Centre, 2013). Overall mortality was 11% higher in April 2013, compared with the five-year average. Mortality for other months remained fairly close to average.
Johnson and Griffiths (2003) investigated seasonal mortality and reported that historically, above average mortality is typically seen between December and March. Therefore the standard ONS method for calculating excess winter mortality defines the winter period as December to March. This method can lead to the perverse situation of a longer more sustained winter period resulting in a lowered estimate of excess winter mortality. That is, because April is included in the non-winter comparison period, the higher than average mortality in April will have artificially lowered the EWM calculations for this year. The EWM for 2012/13 was 29% higher than winter 2011/12, however the percentage increase would have been even greater had mortality for April 2013 been closer to average (see Background note 2).The numbers of deaths by month, sex and age group for regions of England and Wales in 2012 are available to download from the ONS website (610.5 Kb Excel sheet) .
Figure 2: Mean number of daily deaths each month and mean monthly temperatures, August 2012 to July 2013
England and Wales
Source: Office for National Statistics and The Met Office
Notes:
- The mean number of daily deaths is based on deaths occurring in each month. Numbers of deaths from January to July 2013 are provisional, and have been adjusted to take account of late registrations, see methods section.
- Five-year averages for each month are calculated using data from the previous five years, excluding the current year.
- Data include non-residents who died in England or Wales.
Download this image Figure 2: Mean number of daily deaths each month and mean monthly temperatures, August 2012 to July 2013
.png (23.5 kB) .xls (37.9 kB)
EWM and average winter temperature
Figure 3 shows that the increased level of EWM coincided with a decrease in the average winter temperature. This suggests that the higher levels of EWM in 2012/13 may be due to a particularly prolonged winter with lower than average temperatures in February and March. However the link between average winter temperature and excess winter deaths is much less clear in other years, for example winter 2009/10 was exceptionally cold, but EWM was similar to years with mild winters.
According to the English Housing Survey in 2011, a greater proportion of homes in England had cavity wall insulation, modern central heating and double-glazing compared with 2001, meaning homes are becoming more energy efficient. Also, a greater proportion of homes in England had loft insulation in 2011, compared with 2001 (Department for Communities and Local Government, 2013). There have been a number of schemes aimed at improving energy efficiency of homes (see Policy Context). With these home improvements, homes are easier to heat and keep warm and this may have altered the relationship between weather and winter mortality.
Figure 3: Excess winter deaths and average winter temperature, 1999/2000–2012/13
England and Wales
Source: Office for National Statistics and The Met Office
Notes:
- EWM figures are based on deaths occurring in each period.
- Mortality data include non-residents who died in England or Wales.
- Mean winter temperature is calculated using average monthly temperatures from December to March.
Download this chart Figure 3: Excess winter deaths and average winter temperature, 1999/2000–2012/13
Image .csv .xls6. EWM and influenza rates
The last influenza epidemic occurred in 1999/2000 and was associated with a high level of excess winter mortality, as illustrated in Figure 4.
In previous years, deaths from all causes have tended to display a sharp peak, often in late December or early January. In 2012/13 the peak in all cause mortality was higher than in 2011/12 but not unusually high. However the peak in weekly mortality was much flatter than seen in previous years. The number of weekly deaths peaked in the first week of January, following the peak in flu incidence that occurred over the Christmas period, but unusually mortality remained close to this level for an extended period (The Royal College of General Practitioners Research and Surveillance Centre, 2013). Flu incidence increased again in mid-February, possibly contributing to the extended period of mortality, However, this unusual pattern of mortality is also likely to be due to the prolonged cold spell in February to April, as deaths only really began to fall once temperatures started to rise in mid April.
Influenza activity in 2012/13 was relatively low, but activity was prolonged and reached levels higher than those seen in 2011/12 (Public Health England 2013b).
The pattern of flu activity in winter 2012/13 was unusual, with Influenza B circulating earlier in the winter and affecting children aged 5 to 14 years the most; while Influenza A (H3N2) virus was dominant after December, affecting mainly the elderly (Public Health England 2013b).
Given the relatively low levels of influenza activity, we might have expected lower levels of excess winter deaths. However, the higher levels of EWM may be explained by an increase in the severity of influenza in 2012/13 when compared with 2011/12, leading to a greater number of hospitalisations and ICU admissions than seen in the previous winter (Public Health England, 2013b).
Figure 4: Weekly deaths from all causes and RCGP influenza-like illness (ILI) consultation rates per 100,000 population, 1999-2013
England and Wales
Source: Office for National Statistics and The Royal College of General Practitioners Research and Surveillance Centre
Notes:
- Mortality data are based on deaths occurring each week. Numbers of deaths from January to July 2013 are provisional, and have been adjusted to take account of late registrations (see methods section).
- Mortality data include non-residents who died in England or Wales.
Download this chart Figure 4: Weekly deaths from all causes and RCGP influenza-like illness (ILI) consultation rates per 100,000 population, 1999-2013
Image .csv .xls7. EWM by sex and age
In 2012/13 there were 31,100 excess winter deaths. Males comprised 42% of the total, with 13,100 excess winter deaths and females 58% of the total, with 18,000 excess winter deaths.
The majority of these deaths for both sexes occurred amongst those aged 75 and over, with females aged 85 and over having the greatest number of excess winter deaths for all age groups, for both sexes. A higher proportion of the female population are aged 75 and over (9% compared with 7% of males in 2012), and in people aged over 85, women outnumber men two to one (ONS, 2013a). This may wholly, or partially, explain the higher number of excess winter deaths in women.
Figure 5 compares the excess winter mortality index for males and females grouped by age for the previous three winters. The EWM index is used to show how many more people died in winter than in the non-winter months, expressed as a percentage.
In 2012/13 EWM increased significantly in all age groups for both males and females compared with 2011/12. Overall, in males the EWM index increased from 14.1% in 2011/12 to 17.1% in 2012/13. There was a greater increase seen in the EWM index for women, increasing from 16.9% in 2011/12 to 21.8% in 2012/13.
Figure 5 also shows females aged 85 and over had the highest EWM with 28.2% more deaths in winter 2012/13 compared to the non-winter period. The EWM index for males aged 85 and over was slightly lower at 25.9%.
When comparing 2011/12 against 2012/13, the greatest increase in EWM was seen in females aged under 65, where the EWM index increased from 8.2% in 2011/12 to 12.4% in 2012/13. It is worth noting that even with this increase, EWM in 2012/13 for females aged under 65 is still lower than the levels seen in 2010/11, and is low compared with older women.
Figure 5: Excess winter mortality: by sex and age group, 2010/11–2012/13
Figure 5a: Excess winter mortality: by sex and age group, 2010/11–2012/13
Males, England and Wales
Source: Office for National Statistics.
Notes:
- Figures are based on deaths occurring in each period.
- Data include non-residents who died in England or Wales.
Download this chart Figure 5a: Excess winter mortality: by sex and age group, 2010/11–2012/13
Image .csv .xlsFigure 5b: Excess winter mortality: by sex and age group, 2010/11–2012/13
Females, England and Wales
Source: Office for National Statistics.
Notes:
- Figures are based on deaths occurring in each period.
- Data include non-residents who died in England or Wales.
Download this chart Figure 5b: Excess winter mortality: by sex and age group, 2010/11–2012/13
Image .csv .xls8. EWM by geography
EWM by region
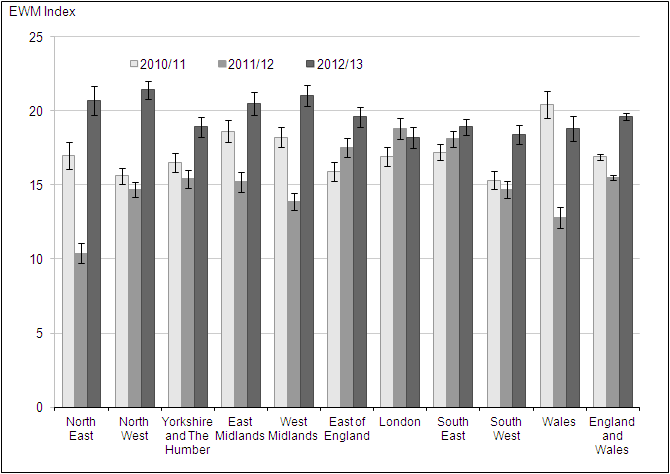
Figure 6 presents the excess winter mortality (EWM) index and confidence limits for English regions and Wales for the last three winters. More detailed data showing the number of excess winter deaths and the EWM index broken down by age for regions of England, and Wales, from 1991/92 to 2012/13 are available in Reference Table 2 (610.5 Kb Excel sheet).
For England and Wales overall, excess winter mortality in 2012/13 increased from the relatively low levels seen in the previous winter, but this pattern varied between the regions of England, and Wales.
The North West had the highest EWM in 2012/13, with 21.4% more deaths in winter compared with the non-winter period, significantly higher than the England and Wales average of 19.6%.
In 2011/12, London had the highest EWM index at 18.8% but this decreased slightly to 18.2% in 2012/13. In contrast, EWM increased in every other English region, leaving London with the lowest EWM index within England and Wales in winter 2012/13.
In 2012/13, the area with the largest increase was the North East where the EWM index almost doubled from 10.4% in 2011/12 to 20.7% in 2012/13. This significant increase saw the North East moving from the region with the lowest EWM in 2011/12 to the third highest in 2012/13.
In common with the increasing trends seen across most regions, EWM increased significantly in Wales from 12.8% in 2011/12 to 18.8% in 2012/13. However EWM in Wales was still significantly lower than a number of regions in England.
Figure 6: Excess winter mortality for regions of England, and Wales, 2010/11–2012/13
England and Wales
Source: Office for National Statistics
Notes:
- Figures are based on deaths occurring in each period.
- Figures for English regions and Wales include deaths of persons usually resident in each area, based on boundaries as of August 2013. Figures for England and Wales combined include deaths of non-residents.
Download this image Figure 6: Excess winter mortality for regions of England, and Wales, 2010/11–2012/13
.png (16.7 kB) .xls (52.7 kB)
EWM by local authority
Figures showing excess winter deaths, the excess winter mortality (EWM) index and confidence limits for local authorities in England and Wales from 1991/92 to 2011/12 are available in Reference Table 3, which can be downloaded from the ONS website (610.5 Kb Excel sheet). Local area EWM data are not available for the most recent winter (2012/13) as these data are provisional, and the estimation methods used to produce national and regional figures are not reliable for small geographic areas.
The local authorities with the lowest EWM index in 2011/12 were Melton in England and Ceredigion in Wales. In fact no excess winter mortality occurred in these areas as there were more deaths in the non-winter months than there were in the winter. The area with the highest EWM index in England in 2011/12 was Adur, where 48.3% more deaths occurred in the winter than in the non-winter period. In Wales, Newport had the highest level of EWM, with 31.4% more deaths in winter compared with the non-winter period. The City of London and Isles of Scilly have been excluded as numbers were too small (because of small population sizes) to allow meaningful comparisons.
It is important to note that EWM figures for local areas tend to be quite variable from one year to the next and there is no consistent pattern in EWM for any of the local authorities in England or Wales. The majority of local authorities that had the 10 lowest EWM indices in 2011/12 have previously been ranked towards the middle of the table of local authorities and it is a similar story for the 10 areas that currently have the highest EWM indices.
Back to table of contents9. Final EWM in 2011/12 by underlying cause of death
Information presented earlier in this bulletin refers to provisional excess winter mortality (EWM) figures for 2012/13; this section refers to final 2011/12 EWM figures by underlying cause of death. Table 1 shows the number of excess winter deaths and the EWM index by age group for circulatory diseases, respiratory diseases, injury and poisoning and dementia and Alzheimer’s disease, in England and Wales for the winters of 2009/10 to 2011/12. Three years of data are presented for comparison purposes.
Overall EWM decreased from 2010/11 to 2011/12 by 7%. Respiratory diseases caused the largest number of excess winter deaths in 2010/11, accounting for 33% of all excess winter deaths. Moreover, respiratory disease had the largest seasonal effect of all of the causes included in Table 1, having the highest EWM index for all three winters analysed. In 2011/12, 39.7% more people died from respiratory diseases in the winter compared with the non-winter period. However, this is significantly lower than in 2010/11 where there were 51.3% more respiratory disease deaths in the winter compared with the non-winter period.
Circulatory diseases caused the second highest number of excess winter deaths in 2010/11 and 2011/12 contributing to 30% of the total number of excess winter deaths in 2011/12. In 2011/12 16.2% more people died from circulatory diseases in the winter than in the non-winter months, up from 14.6% in 2010/11. Circulatory diseases were one of the main causes of mortality in 2012 (ONS, 2013b). However, the number of circulatory disease deaths remains high throughout the year, and the seasonal effects on mortality are not as high as seen with either respiratory diseases or dementia and Alzheimer’s disease.
The winter increase in mortality from dementia and Alzheimer’s disease in 2011/12 was almost double that seen for circulatory diseases, with 29.4% more people dying in the winter than in the non-winter months. This seasonal effect for dementia and Alzheimer’s disease has decreased from 2010/11 where we saw 43.0% more deaths in winter compared with non-winter months. Typically the number of excess winter deaths from dementia and Alzheimer’s disease are much higher in people aged 75 and over, since these are conditions associated with old age, and this was evident in 2011/12 where there were 19 times as many excess winter deaths in the 75 and over age group than for those aged under 75.
Injury and poisoning deaths include accidental falls which can be affected by wintry conditions – for example, icy pavements. There was a significant increase in the EWM for deaths from injury and poisoning, with 15.6% more winter deaths than non-winter deaths in 2011/12, compared with 9.8% more in 2010/11. In 2011/12, the largest increase in EWM from injury and poisoning was seen in the youngest age group, where the number of excess winter deaths more than doubled from 2010/11 to 2011/12. However, external causes usually only account for a small proportion of all excess winter deaths (3% of the total EWM for winter 2011/12).
A more detailed version of Table 1 by sex and age group is available to download from the ONS website (610.5 Kb Excel sheet) .
Table 1: Excess winter mortality by age group and underlying cause of death
| England and Wales | |||||||
| 2009/10 | 2010/11 | 2011/12 | |||||
| Excess winter deaths | EWM Index | Excess winter deaths | EWM Index | Excess winter deaths | EWM Index | ||
| Circulatory diseases (ICD-10 I00–I99) | 0–64 | 620 | 10.8 | 850 | 15.9 | 500 | 9.9 |
| 65–74 | 1,170 | 16.7 | 810 | 11.9 | 830 | 12.9 | |
| 75–84 | 3,150 | 20.0 | 2,300 | 15.4 | 2,090 | 15.0 | |
| 85+ | 4,670 | 22.5 | 2,890 | 14.5 | 3,750 | 19.9 | |
| All ages | 9,610 | 19.5 | 6,850 | 14.6 | 7,170 | 16.2 | |
| Respiratory diseases (ICD-10 J00–J99) | 0–64 | 470 | 28.3 | 1,470 | 94.4 | 520 | 35.2 |
| 65–74 | 860 | 31.4 | 1,410 | 52.1 | 880 | 30.3 | |
| 75–84 | 2,540 | 41.9 | 2,670 | 41.9 | 2,390 | 37.3 | |
| 85+ | 4,290 | 50.0 | 4,560 | 50.2 | 4,310 | 44.8 | |
| All ages | 8,160 | 42.9 | 10,110 | 51.3 | 8,100 | 39.7 | |
| Dementia and Alzheimer's disease (ICD-10 F01, F03, G30) | 0–64 | 30 | 41.8 | 60 | 67.6 | 30 | 33.7 |
| 65–74 | 140 | 42.8 | 240 | 56.9 | 160 | 29.0 | |
| 75–84 | 690 | 34.3 | 1,080 | 39.3 | 990 | 28.3 | |
| 85+ | 1,570 | 33.9 | 2,730 | 43.3 | 2,570 | 29.8 | |
| All ages | 2,420 | 34.5 | 4,110 | 43.0 | 3,750 | 29.4 | |
| Injury and poisoning (ICD-10 V01–Y89, U50.9) | 0–64 | -10 | -0.5 | 120 | 4.2 | 290 | 10.6 |
| 65–74 | 50 | 11.3 | 90 | 20.7 | 80 | 18.0 | |
| 75–84 | 160 | 21.5 | 100 | 12.7 | 140 | 18.2 | |
| 85+ | 340 | 29.6 | 200 | 17.6 | 290 | 24.9 | |
| All ages | 530 | 10.6 | 500 | 9.8 | 790 | 15.6 | |
| All causes | 0–64 | 2,100 | 7.8 | 3,630 | 13.9 | 2,080 | 8.2 |
| 65–74 | 2,620 | 10.3 | 3,050 | 12.0 | 2,220 | 8.7 | |
| 75–84 | 7,830 | 16.9 | 7,350 | 15.9 | 6,740 | 14.6 | |
| 85+ | 13,260 | 24.3 | 12,040 | 21.3 | 13,160 | 22.5 | |
| All ages | 25,810 | 16.8 | 26,080 | 16.9 | 24,200 | 15.5 | |
| Source: Office for National Statistics | |||||||
| Notes: | |||||||
| 1. Underlying cause of death is defined using the International Classification of Diseases, Tenth Revision (ICD 10). From January 2011 ONS has used an updated version of ICD 10, which will affect the assignment of underlying cause of death for deaths registered after this date. More details about the impact of this change are available on the ONS website: www.ons.gov.uk/ons/rel/subnational-health3/results-of-the-icd-10-v2010-bridge-coding-study--england-and-wales--2009/2009/statistical-bulletin--results-of-the-bridge-coding-study.pdf | |||||||
| 2. Figures are based on deaths occurring in each period. | |||||||
| 3. Figures for England and Wales include deaths of non-residents. | |||||||
Download this table Table 1: Excess winter mortality by age group and underlying cause of death
.xls (31.7 kB)10. Causes of excess winter mortality
A study by Healy (2003) showed that EWM varied widely within Europe. The results show that countries with low winter temperatures in Scandinavia and Northern Europe, such as Finland and Germany had very low rates of EWM. Conversely, countries with very mild winter temperatures in Southern Europe such as Portugal and Spain had very high rates of EWM. England and Wales both have higher than average EWM and exhibit high variation in seasonal mortality.
There are many reasons why countries with milder winter climates have such a high level of winter mortality. For example, people who live in countries with warmer winters tend to take fewer precautions against the cold. The Eurowinter group (1997) reported that, compared with people living in countries with cold winters, those from warmer countries were less likely to wear warm protective clothing in cold weather.
Countries with milder winters also tend to have homes with poorer thermal efficiency (for example, fewer homes have cavity wall insulation and double glazing), which makes it harder to keep homes warm during the winter (Healy, 2003). It has been shown that low indoor temperature is associated with higher EWM from cardiovascular disease in England (Wilkinson et al., 2001).
Although EWM is associated with low temperatures, conditions directly relating to cold, such as hypothermia, are not the main cause of excess winter mortality. The majority of additional winter deaths are caused by cerebrovascular diseases, ischaemic heart disease and respiratory diseases (The Eurowinter Group, 1997 and ONS, 2012). Although cancer causes more than a quarter of all deaths annually, previous research (Johnson and Griffiths, 2003 (97.4 Kb Pdf)) found that there was no clear seasonal pattern for these deaths.
The cold can have various physiological effects, which may lead to death in vulnerable people. Woodhouse et al (1993) reported that colder home temperature was associated with increased blood pressure in older people. The Eurowinter group (1997) noted that cold causes haemoconcentration, which leads to thrombosis, and that cold can also lower the immune system’s resistance to respiratory infections. Additionally, the level of influenza circulating in the population increases in winter. In vulnerable groups, for example in the elderly or those with pre-existing health problems, influenza can lead to life-threatening complications, such as bronchitis or secondary bacterial pneumonia (Health Protection Agency, 2010).
Previous research has shown that although mortality does increase as it gets colder, temperature only explains a small amount of the variance in winter mortality, and high levels of excess winter mortality can occur during relatively mild winters (Brown et al, 2010 (293 Kb Pdf)). Curwen and Devis (1988) showed that both temperature and levels of influenza were important predictors of excess winter mortality. Thus, the relationship between temperature, influenza and winter mortality is complex.
Back to table of contents11. Policy context
In the 2009 annual report from the Chief Medical Officer, it was noted that although excess winter deaths have declined over the last 50 years, the number was still too high (Donaldson, 2010). He argued that many of these deaths were preventable and that more needed to be done to protect vulnerable people during cold winter months.
This prompted the Government to develop an annual Cold Weather Plan for England, which has been published yearly since November 2011. Public Health England (PHE) published the 2013 edition in October 2013 in partnership with NHS England, the Local Government Association and the Met Office. The Cold Weather Plan aims to prevent avoidable harm to health by alerting people to the negative health effects of cold weather, and enabling them to prepare and respond appropriately, thus helping to reduce the number of excess winter deaths. The plan sets out a series of actions to be taken by the NHS, social care and other agencies throughout the year, and in response to forecast or actual severe winter weather. It also encourages local communities to support the most vulnerable in their area, such as checking on them during severe weather and offering other support. The Met Office issues Cold Weather Alerts from 1 November 2013 to 31 March 2014 to support the Cold Weather Plan (Public Health England, 2013c). The Keep Warm Keep Well booklet provides advice on staying well during cold weather, for example healthy lifestyle, heating, flu vaccinations, and making sure that people are receiving all the benefits and services to which they are entitled (Department of Health, 2012).
The ‘Warm Homes, Healthy People’ fund that ran in England IN 2011/12 has been discontinued. During the time it ran, between 130,00 and 200,000 (62% of them elderly) received assistance including help with loft insulation and emergency repairs, provision of warm goods, benefits advice and fuel vouchers (Health Protection Agency, 2013a).
The Carbon Emissions Reduction Target (CERT) ran from April 2008 to December 2012 and required all domestic energy suppliers with a customer base in excess of 250,000 customers to make savings in the amount of CO2 emitted by householders through professionally installed insulation measures. The scheme has now ended but while running it helped 3.9 million UK households to install professional loft insulation and over 2.5 million households to benefit from cavity wall insulation (Ofgem, 2013).
The UK government has introduced the ‘Green deal’ project whereby householders can have improvement work carried out on heating and home insulation, paid back through savings in energy bills. This is aimed to benefit around 230,000 low income families per year (Department of Energy and Climate Change, 2013a). In January 2013 the Energy Companies Obligation was introduced to reduce the UK’s energy consumption and support people living in fuel poverty by funding energy efficiency improvements worth around £1.3 billion every year for low-income households and areas, and properties that are harder to treat (Department of Energy and Climate Change, 2013b).
Another policy aimed at helping the most vulnerable heat their homes is the Warm Home Discount scheme (Department of Energy and Climate Change, 2013c).
In addition, there are a number of other policies aimed at tackling excess winter mortality, such as winter fuel payments (Directgov, 2013), and the seasonal flu vaccination programme (NHS Choices, 2012), with nasal spray flu vaccines now available for all children aged two and three (NHS, 2013).
The Welsh Government also have schemes to reduce fuel poverty such as 'Nest' which is a means eligibility tested scheme that offers an advisory service as well as home improvements for those on the lowest incomes to make homes warmer during the winter (Welsh Government, 2013a). This scheme is run alongside ‘Arbed’ which seeks to make improvements to Welsh homes such as boiler upgrades, wall insulation and window upgrades (Welsh Government, 2013b).
Back to table of contents12. Uses of EWM data
EWM figures are widely used to inform policy, planning and research in the public sector, in particular to measure the effectiveness of cold weather planning. Local authorities and public health organisations across England and Wales use ONS data to assess levels of excess winter mortality in their area. In addition, charities use excess winter mortality statistics to support a variety of campaigns.
Back to table of contents13. Comparisons with the rest of the UK
UK figures are not available as ONS only hold mortality data for England and Wales. National Records of Scotland (NRS) produce an annual winter mortality report, which is available on their website.
Northern Ireland Statistics and Research Agency (NISRA) produce figures on excess winter mortality which are available on their website.
Winter mortality figures for Scotland and Northern Ireland are both based on death registrations, whereas England and Wales figures are based on occurrences. In Scotland a death must be registered within eight days, and fact of death can be registered (with a cause given as unascertained, pending investigations) before the Procurator Fiscal has completed their investigations.
Therefore Scottish mortality data are not subject to the same registration delays as mortality data for England and Wales. Hence, almost all deaths that occurred in the relevant period will be included in the Scottish figures, meaning winter mortality figures from Scotland are comparable with ONS figures for England and Wales.
However, this is not true for Northern Ireland mortality data, as for some causes of death there can be a significant delay between when the death occurred and when it was registered. NISRA have compared EWM figures based on occurrences and registrations and the difference is quite large in some years. Therefore EWM figures from Northern Ireland and England and Wales are not directly comparable.
Back to table of contents