Table of contents
- Main points
- Summary
- About this release
- Economic context
- Regional (NUTS1) GDHI estimates
- Sub-regional (NUTS2) GDHI estimates
- Local area (NUTS3) GDHI estimates
- Analysis of the key components of gross disposable household income (GDHI)
- Variation within UK regions
- Domestic (UK) use of regional GDHI estimates
- European use of disposable household income estimates
- Recent methodological changes
- Recent geography changes
- Future work plans
- Background notes
- Methodology
1. Main points
Figures quoted in this statistical bulletin are at current prices, which include the effects of price changes (inflation)
It should be noted that these estimates relate to totals for all individuals within the household sector for a region rather than to an average household or family unit. Gross disposable household income (GDHI) per head are estimates of values for each person, not each household
In 2013 London had the highest GDHI per head, where the average person had £22,516 available to save or spend. Northern Ireland had the lowest, with the average person having £14,347 (see Table 1)
In 2013 the highest growth in GDHI per head was in the West Midlands at 2.3%, followed by Wales at 2.2%. The lowest growth was in the North West at just over 0.0%
The rate of growth in GDHI per head in Nomenclature of Units for Territorial Statistics regions (NUTS1) is weaker in the period 2012 to 2013 than it was in 2011 to 2012 for all regions other than the West Midlands
Of the 173 NUTS3 local areas, in 2013 Westminster had the highest GDHI per head, where the average person had £43,577 available to save or spend. Leicester had the lowest, with the average person having £11,739 (see Table 3)
In 2013 the highest growth in NUTS3 local areas was in the Scottish Borders at 5.2%, followed by West Cumbria and Eilean Siar (Western Isles), both at 5.1%. The largest decrease was in Redbridge and Waltham Forest at -3.8%, followed by Luton at -3.6%
2. Summary
This bulletin presents the latest estimates of gross disposable household income (GDHI) for regions, sub-regions and local areas of the UK. GDHI is the amount of money that all of the individuals in the household sector have available for spending or saving after income distribution measures (for example, taxes, social contributions and benefits) have taken effect.
It should be noted that these estimates relate to totals for all individuals within the household sector for a region rather than to an average household or family unit. GDHI per head are estimates of values for each person, not each household.
The figures are presented for areas according to the European classification of Nomenclature of Units for Territorial Statistics (NUTS) (see background note 1).
Table 1: UK Regional gross disposable household income (GDHI) [1], 2013
| NUTS1 Regions | GDHI per head (£) | GDHI per head growth on 2012 (%) | GDHI per head index (UK=100) | Total GDHI1 (£ million) | Total GDHI growth on 2012 (%) | Share of UK total GDHI (%) |
| United Kingdom | 17,559 | 1.0 | 100.0 | 1,125,626 | 1.7 | 100.0 |
| North East | 14,927 | 0.8 | 85.0 | 38,966 | 1.1 | 3.5 |
| North West | 15,412 | 0.0 | 87.8 | 109,478 | 0.3 | 9.7 |
| Yorkshire and The Humber | 15,252 | 1.4 | 86.9 | 81,413 | 1.8 | 7.2 |
| East Midlands | 15,893 | 0.5 | 90.5 | 73,088 | 1.2 | 6.5 |
| West Midlands | 15,551 | 2.3 | 88.6 | 88,246 | 2.9 | 7.8 |
| East of England | 18,523 | 1.3 | 105.5 | 110,292 | 2.1 | 9.8 |
| London | 22,516 | 0.6 | 128.2 | 189,503 | 1.9 | 16.8 |
| South East | 19,898 | 0.6 | 113.3 | 174,956 | 1.3 | 15.5 |
| South West | 17,693 | 1.0 | 100.8 | 95,147 | 1.7 | 8.5 |
| England | 17,842 | 0.9 | 101.6 | 961,089 | 1.6 | 85.4 |
| Wales | 15,413 | 2.2 | 87.8 | 47,508 | 2.5 | 4.2 |
| Scotland | 17,039 | 2.0 | 97.0 | 90,778 | 2.3 | 8.1 |
| Northern Ireland | 14,347 | 0.2 | 81.7 | 26,251 | 0.5 | 2.3 |
| Source: Office for National Statistics | ||||||
| Notes: | ||||||
| 1. Figures may not sum to totals as a result of rounding. | ||||||
Download this table Table 1: UK Regional gross disposable household income (GDHI) [1], 2013
.xls (24.1 kB)
Map 1: UK Regional gross disposable household income map, 2013

Source: Office for National Statistics
Download this image Map 1: UK Regional gross disposable household income map, 2013
.png (323.7 kB)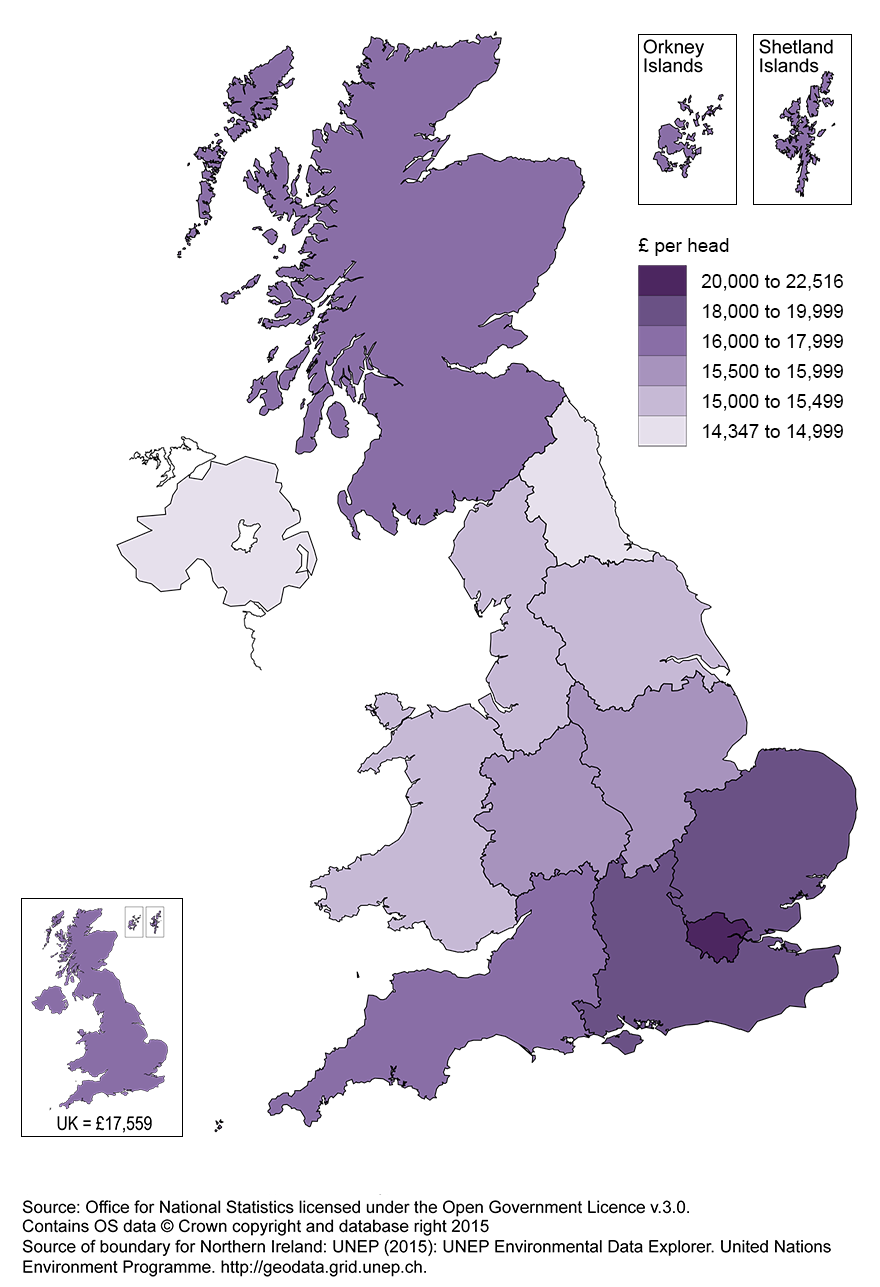
Of the 12 NUTS1 regions, in 2013 regional GDHI per head was above the UK average (£17,559) in 4 regions:
London, at £22,516
the South East, at £19,898
the East of England, at £18,523
the South West, at £17,693
The lowest GDHI per head was in Northern Ireland at £14,347.
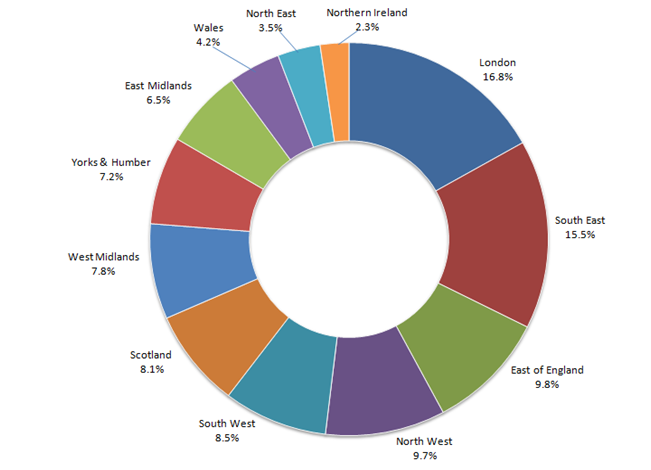
Figure 1: Percentage share of UK gross disposable household income, 2013
Source: Office for National Statistics
Download this image Figure 1: Percentage share of UK gross disposable household income, 2013
.png (69.5 kB) .xls (81.9 kB)
UK total GDHI in 2013 was £1,126 billion. Of that, over 30% was in London and the South East, at 16.8% and 15.5% respectively. Northern Ireland had the lowest share at 2.3%.
Back to table of contents3. About this release
Gross disposable household income (GDHI) is the amount of money that all of the individuals in the household sector have available for spending or saving after income distribution measures (for example, taxes, social contributions and benefits) have taken effect
GDHI does not provide measures relating to actual households or family units
The household sector comprises all individuals in an economy, including people living in traditional households as well as those living in institutions such as retirement homes and prisons. The sector also includes sole trader enterprises (the self-employed) and non-profit institutions serving households (NPISH). Examples of the latter include charities and most universities
A distinction can be made between the 2 stages of income distribution:
The allocation of primary income account shows the income of households generated from employment and ownership of assets. The balance of primary income is equal to total primary resources less total primary uses:
- total primary resources: compensation of employees (income from employment), operating surplus (mainly rental, imputed or otherwise), mixed income from self-employment and property income received from financial assets
- total primary uses: property income paid (for example mortgages, rent on land)
The secondary distribution of income account includes government redistribution of income. The balance of secondary income is equal to total secondary resources less total secondary uses:
- total secondary resources: social benefits (for example state pensions, Jobseekers Allowance, incapacity benefits) and other current transfers received (such as financial gifts, non-life insurance claims)
- total secondary uses: current taxes on income and wealth, social contributions paid (employee's pension and social security contributions) and other current transfers paid (for example non-life insurance premiums)
GDHI is derived from the balances of primary and secondary income. It includes consumption of fixed capital (the decline in value of fixed assets due to normal wear and tear, items becoming obsolete and a normal rate of accidental damage).
GDHI = Balance of Primary Income + Balance of Secondary Income
GDHI estimates in this bulletin are available at 3 geographical levels, in accordance with the Nomenclature of Units for Territorial Statistics (NUTS) (see background note 1)
Per head data takes account of the entire resident population of regions, sub-regions and local areas. The working population and the economically inactive are included. These estimates are produced at current prices which include the effects of price changes
Regional GDHI estimates for 2013 are released for the first time, with revisions (see background note 3) from 1997 to 2012 updating the estimates published in June 2014. Estimates for 2013 should be considered provisional until revised next year
These estimates are consistent with the National Accounts Blue Book 2014
4. Economic context
The UK economy grew in real terms by an estimated 1.7% year-on-year during 2013, up from growth of 0.7% during 2012. The continued growth meant that during the third quarter (July to Sept) of 2013, output finally exceeded the level of quarter 1 (Jan to Mar) 2008, the peak level prior to the economic downturn. Growth during 2013 was relatively consistent through the year, with quarter-on-quarter growth of 0.6% during quarter 1 (Jan to Mar) and quarter 2 (Apr to June), 0.7% during quarter 3 (July to Sept) and 0.4% during quarter 4 (October to December).
The overall increase in gross domestic product (GDP) in 2013 compared with 2012 was aided by growth in household final consumption expenditure and in gross fixed capital formation. By contrast general government final consumption expenditure declined slightly year-on-year and the trade deficit slightly worsened during the year.
Nominal regional gross value added (GVA) increased in all UK regions and countries during 2013, with year-on-year growth highest in London (4.0%), Wales (3.7%) and North West (3.6%). Growth was lowest in Northern Ireland at 1.2%.
Throughout 2013, interest rates remained at 0.5%. Inflation, meanwhile, stayed above the Bank of England’s target of 2.0%. The Consumer Price Index rose by 2.6% from 2012 to 2013 following a 2.8% rise the previous year.
In 2013, the number of births of businesses exceeded the number of deaths of businesses in all English regions, Wales and Scotland. London had the highest business birth rate at 17.9%, followed by the North East (14.7%) and North West (14.7%). Northern Ireland had the lowest birth rate, at 8.7%, and was the only country or region where the death rate of businesses exceeded the birth rate.
Overall, the number of workforce jobs in the UK increased from quarter 4 (October to December) 2012 to quarter 4 (October to December) 2013. Jobs during this period increased by 3.4% in Scotland, by 3% in England, by 2.7% in Northern Ireland and by 1.6% in Wales. Within England, London experienced the largest increase in jobs (5.0%), followed by East of England and the South West. The smallest increases in jobs were observed in Yorkshire and The Humber (0.6%) and in the East Midlands (1.3%).
Unemployment rates decreased and employment rates increased in all 4 countries between quarter 4 (October to December) 2012 and quarter 4 (October to December) 2013. The largest increases in employment rates were observed in Wales and Scotland and in the South East of England. The unemployment rates in Wales and the South East experienced the largest decrease during this period. The claimant count rate of Jobseekers Allowance claimants decreased in all countries and all English regions. The decrease was largest in the North East.
Total foreign exports of goods decreased in England (-0.6%), but increased in Wales (11.2%), Northern Ireland (6.4%) and Scotland (3.1%) between 2012 and 2013. The increases in Northern Ireland and Scotland were largely due to increased exports to EU countries while Wales had strong growth in export levels to both EU countries and non-EU countries. Total foreign goods exports increased for 4 English regions: West Midlands, East Midlands, South West and Yorkshire and The Humber while they decreased for the remaining 5 English regions. The largest increase was in the West Midlands (18.4%) and the largest decrease was in the North East (-10.3%).
Back to table of contents5. Regional (NUTS1) GDHI estimates
In 2013 the highest growth in gross disposable household income (GDHI) per head was in the West Midlands at 2.3%, followed by Wales at 2.2%. The lowest growth was in the North West at just over 0.0%.
The rate of growth in GDHI per head in NUTS1 regions is weaker in the period 2012 to 2013 than it was in 2011 to 2012 for all regions other than the West Midlands.
Figure 2: UK NUTS1 gross disposable household income per head growth on previous year, 2011, 2012 and 2013
Source: Office for National Statistics
Download this chart Figure 2: UK NUTS1 gross disposable household income per head growth on previous year, 2011, 2012 and 2013
Image .csv .xlsSetting the UK per head value to be 100 allows us to index regions against that average. Index values allow a direct comparison within any given period.
Figure 3: Countries of the UK gross disposable household income per head index comparison with UK average, 1997 to 2013
Source: Office for National Statistics
Download this chart Figure 3: Countries of the UK gross disposable household income per head index comparison with UK average, 1997 to 2013
Image .csv .xls
Figure 4: NUTS1 English regions gross disposable household income per head index comparison with UK average, 1997 to 2013
Source: Office for National Statistics
Download this chart Figure 4: NUTS1 English regions gross disposable household income per head index comparison with UK average, 1997 to 2013
Image .csv .xlsOver the time series from 1997 to 2013, only 4 regions increased their index values when compared with the UK average:
London, from 121.9 in 1997 to 128.2 in 2013
Scotland, from 94.1 to 97.0
Wales, from 86.1 to 87.8
Northern Ireland, from 81.3 to 81.7
The strongest decreases over this period were in:
the North West, from 91.2 to 87.8
Yorkshire and The Humber, from 90.1 to 86.9
the South East, from 116.4 to 113.3
Figure 5: NUTS1 gross disposable household income per head index comparison with UK average, 1997, 2012 and 2013

Source: Office for National Statistics
Download this image Figure 5: NUTS1 gross disposable household income per head index comparison with UK average, 1997, 2012 and 2013
.png (14.3 kB) .xls (129.0 kB)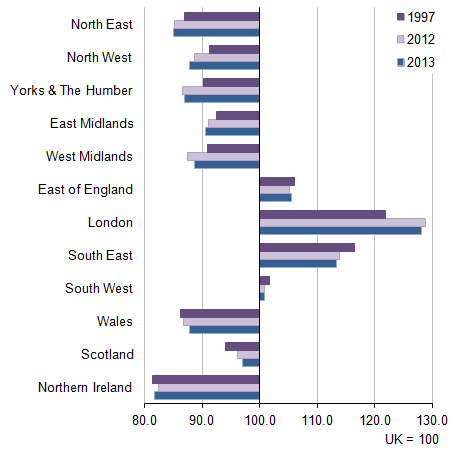
When compared with 2012, the strongest decrease in index points in 2013 was in the North West, from 88.7 to 87.8. The largest increase in index points was in the West Midlands, from 87.4 to 88.6. Wales had the second strongest increase, from 86.7 to 87.8, putting Wales on a par with the North West.
Total GDHI (in millions of pounds instead of pounds per head) increased in all NUTS1 regions in 2013. The strongest increase in total GDHI in 2013 was in the West Midlands, with an increase of 2.9%, followed by Wales with 2.5%. The weakest increases were in the North West, with 0.3%, followed by Northern Ireland, with 0.5%.
Over the course of the time series from 1997 to 2013, the North East increased total GDHI by the least percentage (74.3%). All other regions increased between 76% and 97%, except for London which increased its total GDHI by 120.9% despite the UK total only increasing by 92.4%.
Back to table of contents6. Sub-regional (NUTS2) GDHI estimates
Table 2: UK NUTS2 Sub-regions top 5 and bottom 5 [1] gross disposable household income per head (GDHI), 2013
| NUTS2 Sub-regions | GDHI per head (£) | GDHI per head growth on 2012 (%) | GDHI per head index (UK=100) | Total GDHI (£ million)2 | Total GDHI growth on 2012 (%) |
| United Kingdom | 17,559 | 1.0 | 100.0 | 1,125,626 | 1.7 |
| Top 5 GDHI per head | |||||
| Inner London - West | 39,602 | 2.8 | 225.5 | 43,919 | 3.6 |
| Outer London - South | 21,665 | 1.2 | 123.4 | 27,224 | 2.3 |
| Outer London - West and North West | 21,539 | 1.3 | 122.7 | 43,354 | 2.4 |
| Surrey, East and West Sussex | 21,437 | 0.7 | 122.1 | 59,724 | 1.5 |
| Berkshire, Buckinghamshire and Oxfordshire | 20,660 | -0.2 | 117.7 | 47,856 | 0.7 |
| Bottom 5 GDHI per head | |||||
| Tees Valley and Durham | 14,788 | 1.9 | 84.2 | 17,466 | 2.2 |
| Greater Manchester | 14,515 | -1.6 | 82.7 | 39,408 | -1.1 |
| Northern Ireland | 14,347 | 0.2 | 81.7 | 26,251 | 0.5 |
| South Yorkshire | 14,345 | 1.1 | 81.7 | 19,483 | 1.6 |
| West Midlands | 13,834 | 1.0 | 78.8 | 38,507 | 1.7 |
| Source: Office for National Statistics | |||||
| Notes: | |||||
| 1. Data for all NUTS2 sub-regions are included in reference tables 2.1 to 2.6. | |||||
| 2. Figures may not sum to totals as a result of rounding. | |||||
Download this table Table 2: UK NUTS2 Sub-regions top 5 and bottom 5 [1] gross disposable household income per head (GDHI), 2013
.xls (30.7 kB)At the sub-regional level, the highest GDHI per head in 2013 was in:
- Inner London – West at £39,602
Followed by:
Outer London – South at £21,665
Outer London – West and North West at £21,539
Surrey, East and West Sussex at £21,437
The lowest GDHI per head figures in 2013 were in:
the West Midlands at £13,834
South Yorkshire at £14,345
Northern Ireland at £14,347
Northern Ireland is the same geographic area at both NUTS1 and NUTS2 levels. West Midlands covers a different geographic area at NUTS1 and NUTS2 levels.
Figure 6: UK NUTS2 gross disposable household income per head grouped by NUTS1 region, 2013

Source: Office for National Statistics
Download this image Figure 6: UK NUTS2 gross disposable household income per head grouped by NUTS1 region, 2013
.png (21.9 kB) .xls (159.2 kB)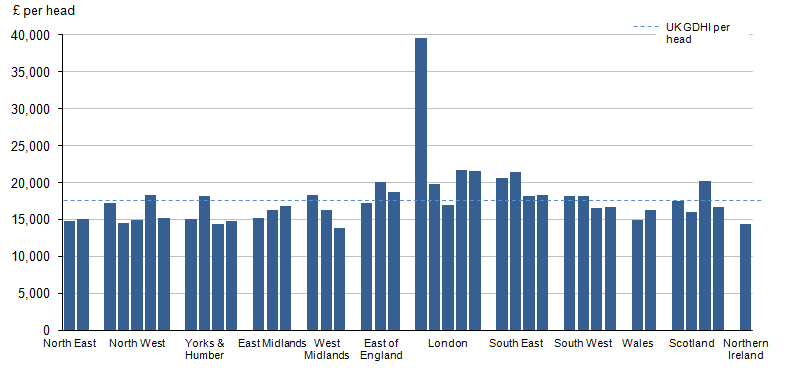
In 2013, of the 40 NUTS2 sub-regions, 16 were above the UK average GDHI per head of £17,559. In each of the NUTS2 sub-regions within the North East, East Midlands, Wales and Northern Ireland, GDHI per head was below the UK average.
When compared with 2012, in 2013 only 7 sub-regions saw decreases in GDHI per head. These were:
Outer London – East and North East, at -3.3%
Greater Manchester, at -1.6%
Lancashire, at -0.7%
Derbyshire and Nottinghamshire, at -0.3%
Berkshire, Buckinghamshire and Oxfordshire, at -0.2%
Devon, at -0.1%
Northumberland and Tyne and Wear saw a small decrease (not significant at 1 decimal place)
The highest increases were in Shropshire and Staffordshire, at 4.1%, followed by Lincolnshire at 3.4%.
Back to table of contents7. Local area (NUTS3) GDHI estimates
Table 3: UK NUTS3 Local areas top 10 and bottom 10 <1> gross disposable household income (GDHI) per head, 2013
| NUTS3 Areas | GDHI per head (£) | GDHI per head growth on 2012 (%) | GDHI per head index (UK=100) | Total GDHI (£ million)2 | Total GDHI growth on 2012 (%) |
| United Kingdom | 17,559 | 1.0 | 100.0 | 1,125,626 | 1.7 |
| Top 10 GDHI per head | |||||
| Westminster | 43,577 | 3.2 | 248.2 | 9,885 | 4.6 |
| Kensington & Chelsea and Hammersmith & Fulham | 42,116 | 3.7 | 239.9 | 14,078 | 3.2 |
| Camden and City of London | 37,324 | 2.8 | 212.6 | 8,859 | 4.9 |
| Wandsworth | 35,734 | 1.4 | 203.5 | 11,096 | 2.1 |
| West Surrey | 24,706 | 0.3 | 140.7 | 18,850 | 1.0 |
| East Surrey | 24,479 | 0.4 | 139.4 | 9,525 | 1.3 |
| Buckinghamshire CC | 23,341 | -0.4 | 132.9 | 12,046 | 0.5 |
| Bromley | 22,021 | 1.3 | 125.4 | 7,001 | 2.5 |
| Barnet | 22,017 | 0.8 | 125.4 | 8,126 | 2.2 |
| Hounslow and Richmond upon Thames | 21,953 | 1.3 | 125.0 | 9,962 | 2.6 |
| Bottom 10 GDHI per head | |||||
| West and South of Northern Ireland | 13,357 | 1.1 | 76.1 | 5,597 | 1.6 |
| Luton | 13,337 | -3.6 | 76.0 | 2,774 | -2.6 |
| Wolverhampton | 13,257 | 1.3 | 75.5 | 3,335 | 1.5 |
| Kingston upon Hull, City of | 13,046 | 3.8 | 74.3 | 3,360 | 3.9 |
| North of Northern Ireland | 12,910 | -2.0 | 73.5 | 3,748 | -1.9 |
| Walsall | 12,613 | -1.7 | 71.8 | 3,433 | -1.2 |
| Blackburn with Darwen | 12,276 | 3.6 | 69.9 | 1,809 | 3.4 |
| Sandwell | 12,100 | -1.7 | 68.9 | 3,803 | -0.8 |
| Nottingham | 11,757 | -0.9 | 67.0 | 3,655 | -0.2 |
| Leicester | 11,739 | -1.3 | 66.9 | 3,918 | -0.7 |
| Source: Office for National Statistics | |||||
| Notes: | |||||
| 1. Data for all NUTS3 local areas are included in tables 3.1 to 3.6. | |||||
| 2. Figures may not sum to totals as a result of rounding. | |||||
Download this table Table 3: UK NUTS3 Local areas top 10 and bottom 10 <1> gross disposable household income (GDHI) per head, 2013
.xls (24.6 kB)
Figure 7: Distribution of NUTS3 areas gross disposable household income per head, 2013
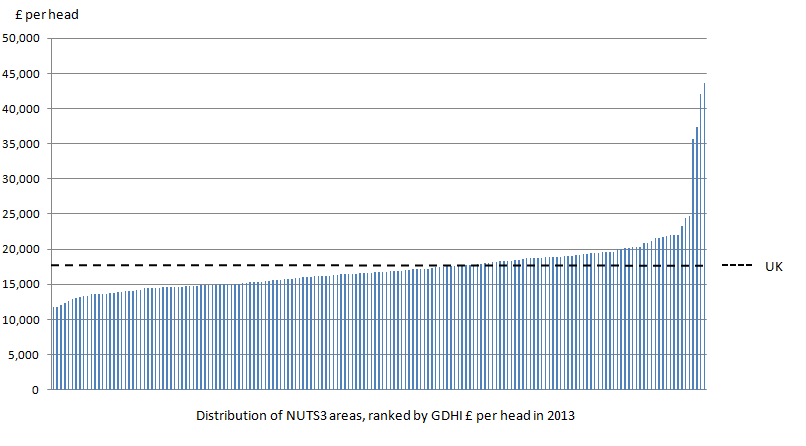
Source: Office for National Statistics
Download this image Figure 7: Distribution of NUTS3 areas gross disposable household income per head, 2013
.png (26.5 kB) .xls (50.2 kB)
In 2013, 4 of the 173 NUTS3 areas had GDHI per head more than double that of the UK average of £17,559. These were:
Westminster, at £43,577
Kensington & Chelsea and Hammersmith & Fulham, at £42,116
Camden and City of London, at £37,324
Wandsworth, at £35,734
The NUTS3 areas with the lowest GDHI per head were Leicester, at £11,739, followed by Nottingham, at £11,757.
In 2012 only 1 NUTS3 area decreased in GDHI per head compared with 2011 (East Sussex CC with -0.1%). In 2013, 45 of the 173 areas decreased when compared with 2012.
Figure 8: UK NUTS3 gross disposable household income per head growth on previous year, 2011, 2012 and 2013
Top 10 GDHI per head
Source: Office for National Statistics
Notes:
- *Kensington & Chelsea and Hammersmith & Fulham.
Download this chart Top 10 GDHI per head
Image .csv .xls
Bottom 10 GDHI per head
Source: Office for National Statistics
Notes:
- *Kensington & Chelsea and Hammersmith & Fulham.
Download this chart Bottom 10 GDHI per head
Image .csv .xlsOf the 10 areas with the highest GDHI per head only Buckinghamshire CC showed a decrease in 2013, of -0.4%. Of the 10 areas with the lowest GDHI per head, 6 areas showed a decrease. Of these, the strongest decrease was in Luton, of -3.6%.
The 2 areas with the highest GDHI per head, Westminster and Kensington & Chelsea and Hammersmith & Fulham, both had increases of over 3% in 2013, as did 2 areas from the 10 with the lowest GDHI per head, Kingston upon Hull and Blackburn with Darwen.
Of the 173 areas, the largest percentage decreases in GDHI per head in 2013 were in Redbridge and Waltham Forest, with -3.8%, followed by Luton, with -3.6%. The largest percentage increases were in:
Scottish Borders, with 5.2%
West Cumbria, with 5.1%
Eilean Siar (Western Isles), with 5.1%
When indexed to UK=100, over the course of the time series from 1997 to 2013, Manchester had the largest decrease in index points, from 101.4 to 80.2. Kensington & Chelsea and Hammersmith & Fulham had the largest increase, from 186.6 to 239.9. Westminster had the second largest increase, from 199.7 to 248.2.
In terms of total GDHI (in millions of pounds instead of pounds per head), the areas with the largest amount of GDHI are:
Hertfordshire, with £24,969m
West Surrey, with £18,850m
Berkshire, with £17,896m
The areas with the least amount of GDHI are:
Orkney Islands, with £401m
Eilean Siar (Western Isles), with £422m
Shetland Islands, with £424m
8. Analysis of the key components of gross disposable household income (GDHI)
The components of gross disposable household income (GDHI) trace the resources (incomings) and uses (outgoings) of the household and non-profit institutions serving households (NPISH) economic sector. This component analysis will look at the different incomings to this sector. For more information about the make-up of the primary and secondary accounts discussed in this section, please see “About this release”. Data discussed in this section can be found in reference tables 1.4 and 3.4.
Household and NPISH sector resources
Resources, or incomings, of the household and NPISH sector can be split into primary resources and secondary resources. The former relates to items such as wages and salaries, rental income and interest on savings. The latter relates to social benefits received and other current transfers, such as monetary gifts and insurance payouts.
Primary resources
Primary resources comprise operating surplus, mixed income, compensation of employees and property income and relate to the income earned by the household and NPISH sector as a result of productive activity or the ownership of productive assets. They include wages and salaries, rental income from buildings, income from self-employment and income from the ownership of financial assets, such as interest on savings.
Figure 9 illustrates the percentage of a region's total resources (primary resources plus secondary resources), or incomings, that was made up of total primary resources in 1997, 2007, 2012 and 2013.
Figure 9: UK NUTS1 primary resources as a percentage of total resources, 1997 to 2013
Source: Office for National Statistics
Download this chart Figure 9: UK NUTS1 primary resources as a percentage of total resources, 1997 to 2013
Image .csv .xlsIn 7 of the 12 NUTS1 regions, a pattern can be seen showing an increase in the amount of primary resources earned as a proportion of total household incomings between 1997 and 2007, followed by a decrease between 2007 and 2012. This follows the UK pattern, which increased from 78.9% in 1997 to 79.6% in 2007, followed by a drop to 75.9% in 2012.
In Yorkshire and The Humber the primary resources as a proportion of total household incomings stayed the same between 1997 and 2007, before falling between 2007 and 2012. In the remaining 4 NUTS1 regions the proportion decreased across both periods; however the decrease between 2007 and 2012 was much larger than between 1997 and 2007.
The economic downturn hit the UK in 2008. The fall in the amount of primary resources earned as a proportion of total household incomings between 2007 and 2012 shows the effect the downturn has had regionally. The largest fall across this period was seen in Northern Ireland, which decreased by 4.8%, followed by Yorkshire and The Humber and the West Midlands, which both decreased by 4.5%. The smallest decrease between 2007 and 2012 was in London, which saw a decrease of 2.0%.
In all but 1 of the regions the proportion of total household incomings made up of primary resources rose between 2012 and 2013, most notably in Wales where the rise was 0.8%. This follows the UK pattern, which increased from 75.9% in 2012 to 76.2% in 2013. The exception to this was the North West region, where there was a 0.0% change.
Figure 10 allows us to look at primary resources as a percentage of total household incomings for 2013.
Figure 10: UK NUTS1 primary resources as a percentage of total resources, 2013
Source: Office for National Statistics
Download this chart Figure 10: UK NUTS1 primary resources as a percentage of total resources, 2013
Image .csv .xlsOf the NUTS1 regions Wales received the smallest share of primary resources as a proportion of total household incomings in 2013, at 70.4%. This was followed by the North East at 70.7%. London received the largest proportion at 83.9%, followed by the South East at 78.0%.
In 2013 there were 3 regions above the UK average of 76.2%: London, the South East and the East of England.
Figure 11 shows the 10 NUTS3 areas where primary resources as a percentage of total household incomings was highest and the 10 areas where this proportion was lowest, for 2013, with the UK average shown for comparison.
Figure 11: NUTS3 Top 10 and bottom 10 primary resources as a percentage of total resources, 2013
Source: Office for National Statistics
Notes:
- *Kensington & Chelsea and Hammersmith & Fulham.
- **Lochaber, Skye & Lochalsh, Arran & Cumbrae and Argyll & Bute.
Download this chart Figure 11: NUTS3 Top 10 and bottom 10 primary resources as a percentage of total resources, 2013
Image .csv .xlsAll of the top 10 areas are in the London NUTS1 region. The difference between the top 4 areas, which all belong to the NUTS2 sub-region Inner London - West, and the other 6 of the top 10, is over 5%, with primary resources making up between 83.5% and 90.9% of total household incomings. All 5 of the Inner London - East NUTS3 areas are represented within this top 10 also, with Hounslow and Richmond Upon Thames the only Outer London area here.
The bottom 10 areas are much more widely distributed than the top 10, with areas in all 4 countries of the UK appearing here. The range of this bottom 10 is also much smaller than the top, with primary resources making up between 67.2% and 68.7% of total household incomings.
The following section looks at the other incomes earned by the household sector, which are described as ‘secondary resources’.
Social benefits and imputed social contributions
Social benefits and imputed social contributions are the main source of secondary resources, the amount received by the household sector in the redistribution of income. They include national insurance fund benefits, such as state pensions and unemployment allowance, and non-contributory benefits such as Child Benefit and tax credits. Imputed social contributions are those paid directly by employers to current and former employees without involving an insurance enterprise or autonomous pension fund, and without creating a special fund or segregated reserve for the purpose; the imputed contributions are equal in value to the amount of social contributions that would be needed to secure the de facto entitlements to the social benefits they accumulate.
Figure 12 illustrates the proportion of a region's total resources (primary resources plus secondary resources), or incomings, that was made up of social benefits and imputed social contributions in 1997, 2007, 2012 and 2013.
Figure 12: UK NUTS1 social benefits as a percentage of total resources, 1997 to 2013
Source: Office for National Statistics
Download this chart Figure 12: UK NUTS1 social benefits as a percentage of total resources, 1997 to 2013
Image .csv .xlsThis figure paints a different picture to that expressed in Figure 9. Of the 4 years shown, for 5 regions the largest amount of incomings earned from social benefits and imputed contributions was in 2012, for 5 regions this occurred in 2013, and in Yorkshire and The Humber and the East of England, this amount was equal in both 2012 and 2013. The smallest contribution to household incomings earned from social benefits and imputed contributions was in 2007 in all regions except the West Midlands, where the contribution in 2007 was slightly above that in 1997.
The largest increase in the amount of social benefits and imputed contributions received as a proportion of total incomings between 2007 (pre-economic downturn) and 2013 was a difference of 4.5% in the North West. The smallest increase was in London, with a difference of 1.9% between 2007 and 2013.
Figure 13 shows the proportion of a region's total resources (primary resources plus secondary resources), or incomings, that the household sector in a region received as social benefits and social contributions in 2013.
Figure 13: UK NUTS1 social benefits as a percentage of total resources, 2013
Source: Office for National Statistics
Download this chart Figure 13: UK NUTS1 social benefits as a percentage of total resources, 2013
Image .csv .xlsIn 2013 Wales received the largest share of social benefits and social contributions as a proportion of total incomings, at 24.3%, followed by the North East at 24.1%. London received the smallest proportion at 13.3%, significantly lower than the next lowest region, the South East, at 18.5%.
In 2013 social benefits and social contributions, as a proportion of total incomings, were below the UK average of 19.8% in 3 regions: the East of England, the South East, and London.
Figure 14 shows the 10 NUTS3 areas where social benefits as a percentage of total household incomings was highest and the 10 areas where this proportion was lowest, for 2013, with the UK average shown for comparison.
Figure 14: NUTS3 Top 10 and bottom 10 social benefits as a percentage of total resources, 2013
Source: Office for National Statistics
Notes:
- *Kensington & Chelsea and Hammersmith & Fulham.
- **Lochaber, Skye & Lochalsh, Arran & Cumbrae and Argyll & Bute.
Download this chart Figure 14: NUTS3 Top 10 and bottom 10 social benefits as a percentage of total resources, 2013
Image .csv .xlsThis chart shows a different picture from Figure 11, with all of the lowest 10 areas in the London NUTS1 region. Again, there is a marked difference between the lowest 4 areas, which all belong to the NUTS2 sub-region Inner London - West, and the other 6 of the bottom 10. All 5 of the Inner London - East NUTS3 areas are represented within this bottom 10 also, with Hounslow and Richmond Upon Thames the only Outer London area here.
The top 10 regions are much more widely distributed than the bottom 10, however there is a different set of areas here than appeared in the bottom 10 of the primary resources chart, with South Ayrshire and the Isle of Wight included instead of the North of Northern Ireland and Bridgend and Neath Port Talbot. The range of this top 10 is also much smaller than the bottom, with social benefits making up between 26.1% and 27.9% of total household incomings.
Back to table of contents9. Variation within UK regions
The countries and regions of the UK have differing demographic characteristics, industrial structure and economic performance. There is also a wide variation in the size and population of the regions which makes comparison difficult using cash totals. Estimates on a per head basis allow for the comparison of regions that are significantly different in absolute size.
Within NUTS1 regions there can be wide variation between the NUTS3 local areas contained within them. The following chart illustrates variation in the range of GDHI per head at NUTS3 geography, within the NUTS1 regions of the UK.
Figure 15: NUTS3 gross disposable household income per head highest and lowest NUTS3 area within each NUTS1 region, 2013

Source: Office for National Statistics
Download this image Figure 15: NUTS3 gross disposable household income per head highest and lowest NUTS3 area within each NUTS1 region, 2013
.png (37.9 kB) .xls (527.4 kB)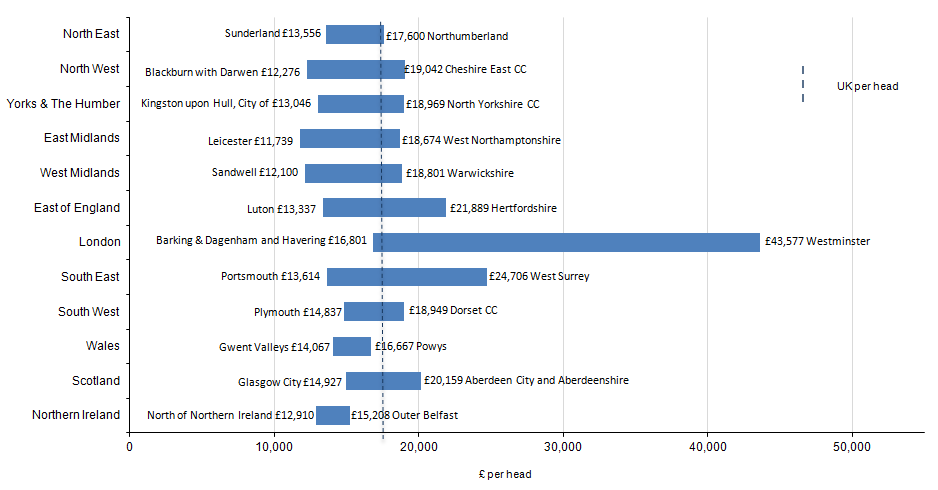
Local areas in close proximity can vary drastically, for example, within the East of England NUTS1 region there are 16 NUTS3 local areas, of which neighbouring areas Hertfordshire and Luton have the highest and lowest GDHI per head respectively within the NUTS1 region.
Wales and Northern Ireland were the only regions in which each local area was below the UK average per head of £17,559. No NUTS1 region was without a NUTS3 area below the average.
The greatest range between the local areas within a region was in London, the lowest being Barking & Dagenham and Havering at £16,801, the highest being Westminster at £43,577, more than double the lowest. The smallest range between the local areas within a NUTS1 region was in Northern Ireland, where the local area with the lowest GDHI per head was North of Northern Ireland, at £12,910, and the highest was Outer Belfast, at £15,208.
Back to table of contents10. Domestic (UK) use of regional GDHI estimates
These statistics provide an overview of economic diversity and social welfare at regional, sub-regional and local area levels. They supply information about the availability of disposable income throughout the UK. Disposable income is a concept which can be used to approximate the ‘material welfare’ within the household sector, although the term ‘welfare’ is commonly used in ways that go beyond financial wealth and, as such, cannot be measured by a single statistic.
These estimates are used by the UK Government and the devolved administrations of Northern Ireland, Scotland and Wales to formulate and monitor economic policy and allocate resources.
The Scottish Government uses these statistics as the basis for quarterly estimates of GDHI and the households and NPISH sector savings ratio within the Quarterly National Accounts Scotland release. The resulting statistics are widely used by economic commentators and academics in Scotland. The Scottish Government also use GDHI as one of a range of key economic indicators of economic performance, for example in Scotland's Economic Strategy (March 2015).
The Welsh Government regards the GDHI statistics as a key economic indicator. A current example of this is through the Programme for Government. This identifies the Welsh Government’s commitments and the means by which progress will be measured over the five-year term. Within the Programme for Government, and in relation to Growth and Sustainable Jobs, GDHI per head and primary income per head are identified as two of four key outcome indicators for Wales. Furthermore it is planned that both GDHI and primary income will be two of the indicators used in the basket of indicators for monitoring the output of the Welsh economy, in a forthcoming publication on the Welsh Government website.
The Northern Ireland Executive uses these statistics in conjunction with other economic measures and surveys to give an overall picture of the economy.
Local authorities use these statistics to facilitate evidence-based policy-making. These statistics inform the general public and provide insight into the relative socio-economic picture of the UK and issues such as the ‘North-South divide’. They are used in the House of Commons library to answer enquiries from MPs about regional differences in the income of households.
Our regional accounts team also receives general enquiries relating to these estimates from a diverse range of bodies including other government departments, local authorities, business analysts, consultancy firms, financial institutions, economists and the media (provincial and national). These statistics also facilitate academic research by individuals and universities within the UK and abroad.
Back to table of contents11. European use of disposable household income estimates
The production of regional disposable income of households is a legal requirement under the European System of Accounts (ESA2010). Whereas gross disposable household income is compiled for UK domestic use, the estimates provided to Eurostat (the statistical department of the European Commission) are net of consumption of fixed capital (see section “About this release”) at the NUTS2 level.
Consumption of fixed capital (CFC) is included in the operating surplus/mixed income (OS/MI) components of the primary income account. The CFC element is estimated and removed from the regional OS/MI, to derive the net disposable household income (NDHI) estimates.
The European Union (EU) uses these NDHI estimates to inform regional policy and analysis, and to identify disparities in regional welfare across the member states.
Member states provide estimates of NDHI in their national currencies. Eurostat then converts these using specific purchasing power standards for final consumption expenditure, called purchasing power consumption standards (PPCS). This process enables meaningful comparisons to be made between the Member States.
The following chart illustrates the range of disposable income across EU NUTS2 sub-regions in 2011. The NUTS2 sub-regions with the highest and lowest disposable income per inhabitant (in purchasing power standards (PPS)) are displayed for each EU country. Some EU countries are represented by a single line as they only have 1 constituent NUTS2 sub-region, for example Estonia.
Figure 16: Disposable income of private households per inhabitant (in PPCS), highest and lowest NUTS2 region within each country, 2011<1>

Source: Eurostat
Notes:
- Croatia, Cyprus, Malta and Slovenia data not available.
Download this image Figure 16: Disposable income of private households per inhabitant (in PPCS), highest and lowest NUTS2 region within each country, 2011<1>
.png (34.0 kB) .xls (370.2 kB)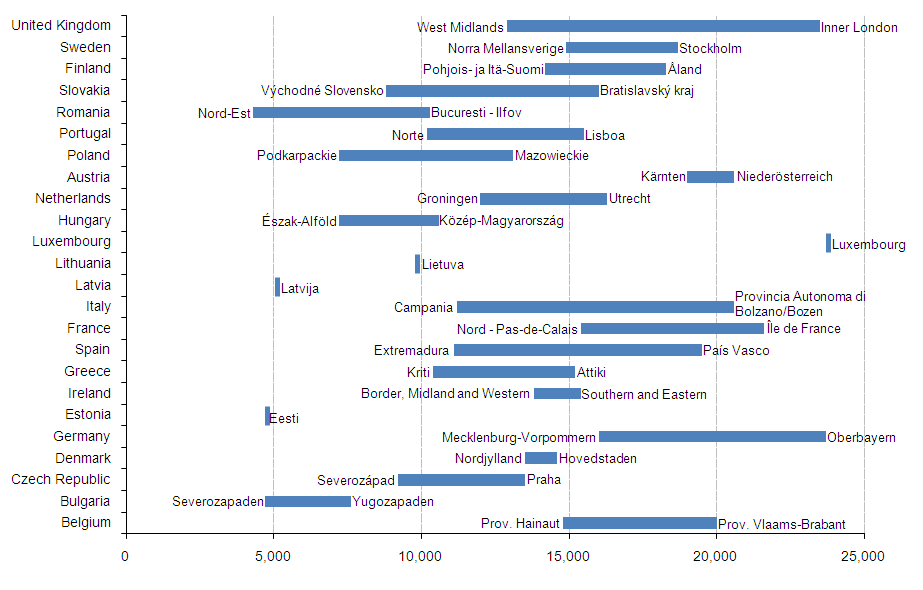
Of the NUTS2 sub-regions shown on the chart, Luxembourg had the highest disposable income in 2011, followed by Oberbayern in Germany, and by Inner London in the United Kingdom. This was the first year where Inner London did not have the highest disposable income across the EU since the start of the time series in 2000. The sub-region with the lowest disposable income in 2011 was Nord-Est in Bulgaria, followed by Severozapaden in Romania.
Back to table of contents12. Recent methodological changes
The UK, along with all other European Union member states, has a programme of work to introduce the changes to data and methods required by the new European System of Accounts (ESA2010). These changes are many and varied, and will be implemented in the UK national accounts over a number of years. The UK regional accounts aim to implement any relevant changes (those requiring a different treatment to be implemented in order to allocate the national total across regions of the UK) in the first regional publication following their introduction to the national accounts.
The ESA2010 changes in Blue Book 2014 which affected the 2015 GDHI production concerned 3 distributive transactions in the income accounts: compensation of employees, property income, and social contributions and benefits. These changes involved more detailed breakdowns of existing components, predominantly a division between pension and non-pension transactions in regards to employers’ actual and imputed social contributions. Further changes included separation, joining, or expansion of low level distributive transactions, details of which can be found in national accounts documentation. In a number of these changes, existing regional indicators have been applied to new transaction breakdowns, however in some cases we have introduced new regional indicators, as illustrated in the following paragraphs.
The compensation of employees and social contributions and benefits transactions are made up of multiple components relating to employment in different sectors of the economy, the most important divisions of which are between public and private sector employment. Due to a lack of regional indicator datasets at this level of detail, a number of components were aggregated to a public/private sector split before being allocated and, in the majority of cases, corresponding pension and non-pension components have been apportioned by the same indicator. Estimates for public sector, private sector and all employees, taken from the Labour Force Survey (LFS), are used as a regional indicator for these employment components.
The exception to this aggregation is employees working in the non-profit institutions serving households (NPISH) sector. While NPISH is a subset of private sector employment, its specific nature means that being able to distinguish it on its own constitutes an improvement in methods. Estimates of NPISH employees have been produced using a combination of our survey data sources. These surveys operate on a “workplace basis”, while regional GDHI is produced on a “residence basis”; however this is considered likely to introduce less inaccuracy than using less specific residence-based data, that is, the LFS private sector employee numbers. Furthermore, as part of the ESA2010 guidance, the NPISH sector must be split from the household sector throughout the national accounts. There is work ongoing to deliver this by Blue Book 2017, which will result in the removal of NPISH estimates from regional GDHI by 2018.
One further important change to GDHI production methods for this publication is a widespread change to using “number of employees” rather than “employment” or “employment income” as previously used. The reason behind this is that the previous indicators would have included self-employed individuals, who (according to national accounts definitions and principles) should not be included in contributions to pensions and other social insurance funds, as their contributions to the national accounts are considered savings.
This year we have also introduced a change to the way we calculate the provisional year's estimates of compensation of employees, taxes and social contributions and social benefits to make use of additional data. The main data source for these components is administrative PAYE data provided by HM Revenue and Customs. These data are comprehensive and generally of good quality, but are only available after a long time lag, so we have always used the regional allocation from the latest available year (2012 for this publication) and simply applied the same breakdown to the provisional year's national total for each component. This year we have made use of ONS survey data from the Labour Force Survey (LFS) and Annual Survey of Hours and Earnings (ASHE) to calculate annual growth in earnings for each local area, and we have applied these growth rates to the latest available PAYE data. We expect this change to deliver an improvement to the ability of regional GDHI to respond to changes in regional earnings. However, it should be recognised that the provisional estimates are subject to revision when they are replaced with estimates calculated from the full PAYE dataset.
Back to table of contents13. Recent geography changes
This publication is the first from regional accounts to include changes to the UK's NUTS areas following a review in 2013. The changes were agreed by the European Commission and became operational on 1 January 2015. All the changes are in England, where 2 existing NUTS2 sub-regions have been replaced with 5 new ones (previously NUTS3 regions), and 14 existing NUTS3 local areas replaced with 48 new ones, details of which are below.
Where the 5 new NUTS2 sub-regions were previously NUTS3 regions, we have calculated revisions and presented them in the NUTS2 reference tables and revisions triangles. The new NUTS3 local areas do not allow us to present revisions for these areas.
To help with the changes, 3 lookup files have been published on the Open Geography portal. A summary of the changes is included in the product specification accompanying the files, which are:
local authority (December 2013) to NUTS levels 1, 2 and 3 (January 2015)
NUTS level 2 (January 2012) to NUTS level 2 (January 2015)
NUTS level 3 (January 2012) to 2015 NUTS level 3 (January 2015)
NUTS2
| NUTS areas operative from Jan 2012 | NUTS areas operative from Jan 2015 |
| Inner London | Inner London – East |
| Inner London – West | |
| Outer London | Outer London - East and North East |
| Outer London – South | |
| Outer London – West and North West |
Download this table NUTS2
.xls (26.6 kB)
NUTS3
| NUTS areas operative from Jan 2012 | NUTS areas operative from Jan 2015 |
| Inner London – West | Camden and City of London |
| Westminster | |
| Kensington & Chelsea and Hammersmith & Fulham | |
| Wandsworth | |
| Inner London – East | Hackney and Newham |
| Tower Hamlets | |
| Haringey and Islington | |
| Lewisham and Southwark | |
| Lambeth | |
| Outer London – East and North East | Bexley and Greenwich |
| Barking & Dagenham and Havering | |
| Redbridge and Waltham Forest | |
| Enfield | |
| Outer London – South | Bromley |
| Croydon | |
| Merton, Kingston upon Thames and Sutton | |
| Outer London – West and North West | Barnet |
| Brent | |
| Ealing | |
| Harrow and Hillingdon | |
| Hounslow and Richmond upon Thames | |
| Greater Manchester South | Manchester |
| Greater Manchester South West | |
| Greater Manchester South East | |
| Greater Manchester North | Greater Manchester North West |
| Greater Manchester North East | |
| Kent CC | Kent Thames Gateway |
| East Kent | |
| Mid Kent | |
| West Kent | |
| Essex CC | Essex Haven Gateway |
| West Essex | |
| Heart of Essex | |
| Essex Thames Gateway | |
| Hampshire CC | South Hampshire |
| Central Hampshire | |
| North Hampshire | |
| Lancashire CC | Lancaster and Wyre |
| Mid Lancashire | |
| East Lancashire | |
| Chorley and West Lancashire | |
| Surrey | West Surrey |
| East Surrey | |
| Norfolk | Norwich and East Norfolk |
| North and West Norfolk | |
| Breckland and South Norfolk | |
| West Sussex | West Sussex (South West) |
| West Sussex (North East) |
Download this table NUTS3
.xls (23.6 kB)14. Future work plans
Our plans for future developments and publications include the following:
we plan to produce gross disposable household income (GDHI) estimates for the Local Enterprise Partnership areas of England in the summer 2015. These estimates will be consistent with the data in this publication
the publication of regional GDHI estimates for the period 1997 to 2014 is currently planned for spring 2016
we plan to publish estimates of regional, sub-regional and local gross value added compiled using the income approach (GVA(I)) for 1997 to 2014, in December 2015
we plan to publish experimental estimates of real regional and sub-regional gross value added compiled using the production approach (GVA(P)) for 1998 to 2013, in December 2015
during 2015-2016 a regional GVA balancing project will consider the viability of producing a single balanced measure of regional GVA
changes in NUTS boundaries arising from the 2013 NUTS review became active in January 2015. These changes will be implemented in the regional GVA(I) and GVA(P) publications scheduled for December 2015. Please see the section "Recent geography changes"
relevant methodological changes arising from the introduction of the European System of Accounts 2010 (ESA2010) will be implemented in the regional accounts during the course of 2015 and beyond, in step with the UK national accounts