Table of contents
- Main points
- Overview
- User engagement
- UK gross domestic R&D expenditure, 2012
- Expenditure on R&D performed in the UK
- Civil and defence expenditure, by performing sector
- R&D expenditure by funding sector
- Civil and defence R&D expenditure by funding sector
- Country and regional breakdown of UK R&D expenditure
- International comparisons of GERD as a percentage of GDP (R&D Intensity)
- Background notes
- Methodology
1. Main points
In 2012, the UK’s gross domestic expenditure on research and development (GERD), in current prices, decreased by 2% to £27.0 billion compared with 2011. Adjusted for inflation, in constant prices, research and development (R&D) expenditure decreased by 3%.
In constant prices, R&D expenditure has increased by 56% from the 1985 estimate of £17.3 billion. Expenditure peaked in 2011 at £27.9 billion.
The business sector performed 63% of UK R&D expenditure in 2012. Expenditure by this sector decreased by 2%, in current prices, to £17.1 billion in 2012, compared with 2011.
Total R&D expenditure in the UK in 2012 represented 1.72% of Gross Domestic Product (GDP), a decrease from 1.77% in 2011.
International comparisons show that UK R&D expenditure in 2012 was below the EU-28 provisional estimate of 2.06% of GDP.
2. Overview
This statistical bulletin provides estimates of R&D performed in and funded by the following four sectors of the economy, as defined in the ‘Frascati Manual’:
Business Enterprise (BERD)
Higher Education (HERD)
Government (GovERD), which includes Research Councils
Private Non-Profit (PNP) organisations
All these sectors’ R&D data are known collectively as GERD, which represents the gross domestic expenditure on R&D in the UK.
GERD is unique in providing this information, and is the preferred measure of R&D activity for use in international comparisons. This release reports on R&D expenditure in the UK irrespective of the residence of the ultimate owner or users of the R&D produced. The main purpose of collecting R&D data from all sectors of the economy is to supply data for policy and monitoring purposes on science and technology, of which R&D is an important part.
In this statistical bulletin, R&D and related concepts follow internationally agreed standards defined by the Organisation for Economic Cooperation and Development (OECD), as published in the ‘Frascati Manual’. This manual defines R&D as “creative work undertaken on a systematic basis in order to increase the stock of knowledge, including knowledge of man, culture and society and the use of this stock of knowledge to devise new applications”.
The Frascati Manual was originally written by, and for, the experts in OECD member countries that collect and issue national data on R&D. The definitions provided in this manual are internationally accepted and now serve as a common language for designing and evaluating science and technology policy.
The business sector estimates in this release, the largest component of GERD, are derived from the Business Enterprise Research and Development (BERD) survey, published on 22 November 2013 in the Business Enterprise Research and Development 2012 statistical bulletin. Approximately 5,000 UK businesses were selected for this survey from a continually updated register of R&D performers.
The National Accounts provide the framework that is used to define and measure the UK’s economic performance, such as the value of the UK’s GDP. Changes to the European System of Accounts (ESA) mean that from September 2014 onwards, expenditure on R&D will contribute to the formation of assets and therefore the value of the UK’s net worth. Further information about this important change can be found at ONS ESA 2010.
Two types of estimates are presented in this release, current and constant prices. Estimates in current prices present the value of R&D expenditure in cash terms. Constant price estimates have been adjusted for inflation between years using the GDP deflator. This allows changes in the volume of R&D expenditures to be examined on a comparable basis over time.
Back to table of contents3. User engagement
We are constantly aiming to improve this release and its associated commentary. We would welcome any feedback you might have, and would be particularly interested in knowing how you make use of these data to inform your work. Please contact us via email: RandD@ons.gov.uk or telephone David Matthews on +44 (0)1633 456756.
Back to table of contents4. UK gross domestic R&D expenditure, 2012
In 2012, in current prices, £27.0 billion was spent on R&D performed within the UK, a decrease of £0.5 billion (2%) since 2011. This was mainly driven by a £0.4 billion decrease in R&D performed by the business sector. Adjusted for inflation, in constant prices, R&D expenditure decreased by 3%.
In 1985, in constant prices, £17.3 billion was spent on R&D performed in the UK. Since then, there has been a sizeable increase (56%) in R&D expenditure in the UK. Expenditure peaked in 2011 at £27.9 billion (Figure 1).
Figure 1: UK gross domestic expenditure on R&D, 1985 to 2012
Source: Office for National Statistics
Download this chart Figure 1: UK gross domestic expenditure on R&D, 1985 to 2012
Image .csv .xlsFigure 2 shows UK gross domestic expenditure on R&D, as a percentage of GDP, in current prices. Total R&D expenditure in 2012 represented 1.72% of GDP, a decrease on the 1.77% estimate for 2011. It should be noted that this decrease is partly due to the increase in GDP in 2012, as well as the decrease in R&D expenditure.
UK gross domestic R&D expenditure, as a percentage of GDP, in current prices, peaked in 1986 at 2.14%. Since 2001, R&D expenditure as a percentage of GDP has been within a range of 1.65% to 1.79%.
Figure 2: UK gross expenditure on R&D as a percentage of GDP, 1985 to 2012
Source: Office for National Statistics
Download this chart Figure 2: UK gross expenditure on R&D as a percentage of GDP, 1985 to 2012
Image .csv .xlsA target set by the UK Government in the Science and Innovation Framework 2004 - 2014 was to increase public and private investment in R&D towards a goal of 2.5% of GDP by 2014.
Back to table of contents5. Expenditure on R&D performed in the UK
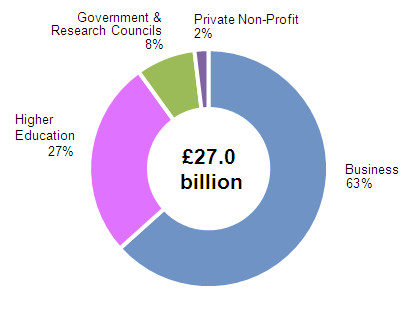
UK estimates of R&D cover the four sectors of the economy, namely Business, Higher Education, Government (including Research Councils), and Private Non-Profit organisations. Figure 3 shows the contribution each sector made to the total UK R&D expenditure estimate in 2012.
Figure 3: Composition of UK GERD by performing sector, 2012
Source: Office for National Statistics
Download this image Figure 3: Composition of UK GERD by performing sector, 2012
.png (11.6 kB) .xls (26.1 kB)
Taking each of these R&D sectors in turn:
Business
The business sector performs the most R&D of any sector in the UK. In 2012 it accounted for £17.1 billion of expenditure, representing 63% of total expenditure on R&D. This is a decrease of 2% in current prices from £17.5 billion in 2011. On an annual basis, the 400 largest business R&D spenders are asked to select the industry product groups that best describe the type of R&D that they undertake. The product groups with the largest R&D expenditure in 2012 (Figure 4) were:
Pharmaceuticals (£4.2 billion)
Computer programming and information service activities (£1.9 billion)
Motor vehicles and parts (£1.7 billion)
Aerospace (£1.5 billion)
Machinery and equipment (£1.0 billion)
Telecommunications (£0.9 billion)
The UK Government has continued to promote growth in R&D, particularly in the business sector, through the introduction of tax relief, and Catapult centres. A Catapult is a “technology and innovation centre where UK businesses, scientists and engineers can work together on research and development, transforming ideas into new products and services”.
Figure 4: R&D expenditure by the business sector, 2012

Source: Office for National Statistics
Download this image Figure 4: R&D expenditure by the business sector, 2012
.png (185.1 kB) .xls (27.1 kB)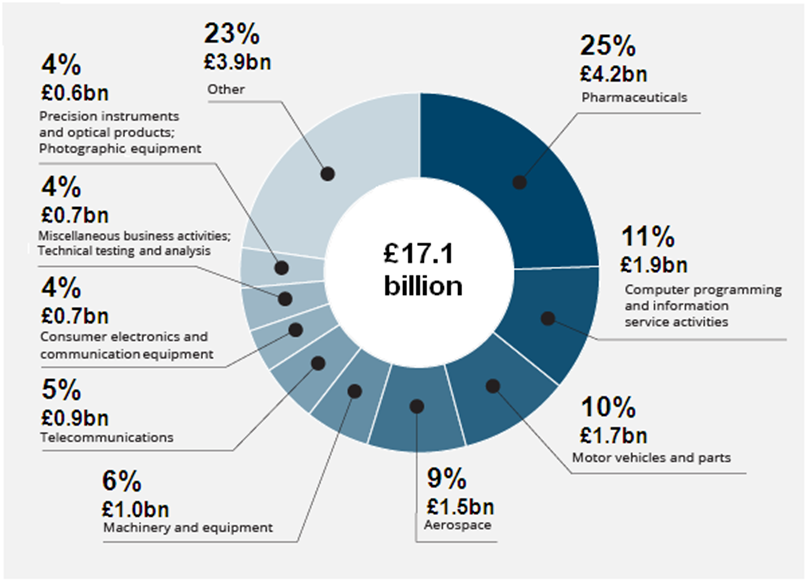
More detailed information on business R&D expenditure can be found in the UK Business Enterprise Research and Development 2012 statistical bulletin published on 22 November 2013.
Higher education
The higher education sector, which includes universities and higher education institutes, represented 27% of total UK R&D expenditure in 2012 at £7.2 billion. This was an increase of 1% in current prices, from £7.1 billion in 2011. The funding for this sector is mainly provided by the Higher Education Funding Councils for England, Scotland and Wales, the Department for Education in Northern Ireland and the seven UK research councils.
Government and research councils
The UK Government owns many research institutes and laboratories that carry out R&D. These are managed by different government departments, including the Department for Business, Innovation and Skills, the Department for Environment, Food and Rural Affairs and the Department of Health.
In 2012, R&D expenditure in the UK by the government and research councils sector decreased by 8% in current prices, from £2.4 billion in 2011 to £2.2 billion in 2012. This sector accounted for 8% of total expenditure on R&D performed in the UK in 2012.
Research Councils UK (RCUK) is the strategic partnership of the UK's seven research councils. Each year the councils perform research covering the full spectrum of academic disciplines from the medical and biological sciences to the arts and humanities.
Research councils’ R&D expenditure decreased by 22% in current prices, from £1.0 billion in 2011 to £0.8 billion in 2012.
Private non-profit
The private non-profit sector includes registered charities and trusts. Those performing R&D in this sector specialise mainly in health and medical research. Some of the largest of these are based in the UK. This sector includes, for example, a number of cancer charities that carry out extensive research into types of cancer prevention, from drug development to clinical trials.
The private non-profit sector is the smallest R&D performing sector in the UK. In 2012, it is estimated that £0.5 billion was spent by these organisations, which contributed 2% to total UK R&D expenditure.
Back to table of contents6. Civil and defence expenditure, by performing sector
R&D expenditure for civil purposes in 2012 (£25.2 billion) accounted for 93% of total UK R&D expenditure (Figure 5).
In current prices, civil R&D expenditure decreased by 1%, from £25.5 billion in 2011 to £25.2 billion in 2012, while defence R&D decreased by 10%, from £2.0 billion to £1.8 billion.
In constant prices, civil R&D expenditure has increased by 70% (£10.4 billion) since the 1989 estimate of £14.9 billion. In contrast, defence R&D expenditure has decreased by 62% over the same period, from £4.7 billion in 1989.
Figure 5: Expenditure on civil and defence R&D performed in the UK, 1989 to 2012
Source: Office for National Statistics
Download this chart Figure 5: Expenditure on civil and defence R&D performed in the UK, 1989 to 2012
Image .csv .xlsCivil and defence R&D expenditure can be further split between the four performing UK sectors. The business sector was by far the largest R&D performer in both civil and defence R&D in 2012, at £15.5 billion and £1.6 billion respectively.
Of particular note, business R&D expenditure in the civil sector has increased by 52% in constant prices since 1989, but business expenditure on R&D in the defence sector has decreased by 48% over this period.
Back to table of contents7. R&D expenditure by funding sector
In 2012, most of the funding for R&D performed in the UK was provided by the business sector which funded £12.3 billion. This was a decrease of 1%, in current prices, from £12.5 billion in 2011 (Figure 6). The business sector funded 46% of the total UK R&D spend in 2012.
Although the government and research councils sector spent £2.2 billion performing R&D within their UK public research institutes, they actually funded £5.6 billion of UK R&D spend, 21% of total funding. This can be better understood through an appreciation of the role of RCUK which offers individuals and businesses overseas, access to the UK’s research facilities and infrastructure.
In just under two decades there has been a change in the profile of how UK R&D expenditure has been funded. In 1985, 8% of R&D funding came from overseas. Since then, there has been a steady increase in the proportion of funding for UK R&D expenditure from overseas, from 14% in 1995 to 20% in 2012.
Figure 6: Composition of UK GERD by funding sector, 1995 to 2012
Source: Office for National Statistics
Download this chart Figure 6: Composition of UK GERD by funding sector, 1995 to 2012
Image .csv .xlsFigure 7 is a representation of the flows of R&D funds from the four UK sectors and overseas. The values in the boxes are the amounts of funding that each sector provided to the other sectors in the UK in 2012. The arrows indicate the values provided to the recipient sector.
It is important to note that sectors can fund themselves. For example, in 2012 the business sector performed £17.1 billion, of which £11.7 billion was funded by this sector. The remaining £5.4 billion of R&D expenditure performed by the business sector was funded by other sectors.
Figure 7: Flows of R&D funding in the UK, 2012

Source: Office for National Statistics
Notes:
- For full information see Table 1 from the data section of this publication. Please note, that government departments and research councils carry out their R&D in public research institutes, so their flows of funds are combined in Figure 7.
- HEFCs – Higher Education Funding Councils.
Download this image Figure 7: Flows of R&D funding in the UK, 2012
.png (54.5 kB) .xls (28.2 kB)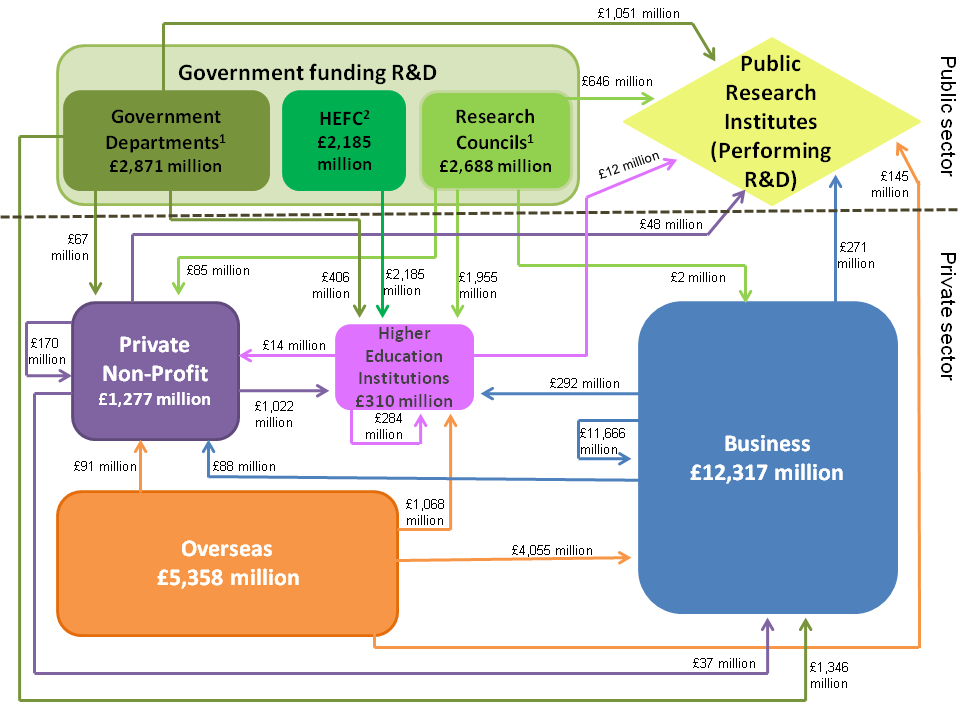
8. Civil and defence R&D expenditure by funding sector
The majority of funding for civil R&D performed in the UK was provided by the business sector (£11.9 billion), 47% of total civil funding.
Of the £5.4 billion funding received from overseas in 2012, 97% was spent on civil R&D (£5.2 billion).
R&D expenditure for defence purposes in the UK accounted for 7% of total R&D expenditure (£1.8 billion) in 2012. The UK Government’s funding of defence R&D in 2012 was £1.2 billion. This was a decrease of 5% in current prices from £1.3 billion in 2011. This is partly due to government contracts awarded to UK businesses for the development of aircraft, naval ships, submarines and their systems and equipment, moving from the research to production stages. The business sector provided £0.4 billion (24%) of funding and £0.2 billion (10%) came from overseas. The UK Government accounted for 67% of total defence funding.
Back to table of contents9. Country and regional breakdown of UK R&D expenditure
R&D expenditure can be analysed by UK country and region (Figure 8). In this context, the country and region refers to the location where the R&D is performed, not the location of the funder.
The South East and East of England continued to dominate where R&D is performed in the UK in 2012. These two regions accounted for 39% of total UK R&D expenditure (£10.6 billion).
The majority of UK R&D expenditure was carried out in England (£23.9 billion) in 2012. Although England showed a decrease in R&D expenditure in current prices of 2% compared with 2011, Northern Ireland and Wales showed increases of 12% and 2% respectively in 2012. The estimate for Scotland showed no change from 2011.
Figure 8: UK GERD by sector, country and region, 2012

Source: Office for National Statistics
Download this image Figure 8: UK GERD by sector, country and region, 2012
.png (160.7 kB) .xls (32.3 kB)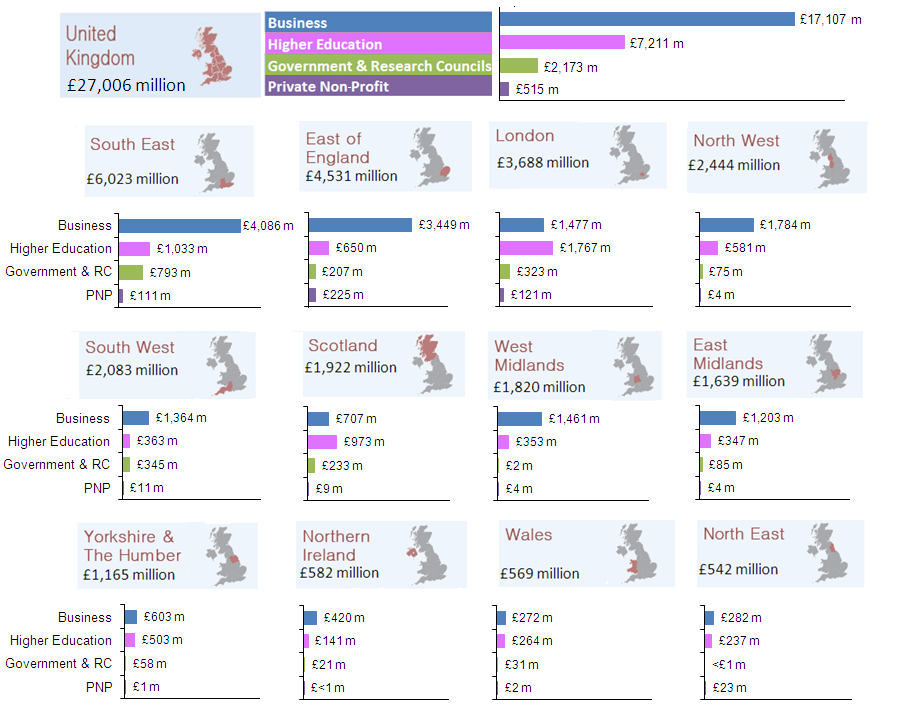
10. International comparisons of GERD as a percentage of GDP (R&D Intensity)
The Europe 2020 targets specify five targets for the EU for 2020, including a target of 3% of the EU’s GDP to be invested in R&D. This means that the estimates in this release are essential in monitoring progress towards this target.
The percentage of R&D to GDP increased marginally in the EU-28 up to 2002, reaching a high of 1.87%, before declining modestly through to 2005 (1.82%), and climbing again to an estimated 2.06% in 2012. Please note that the 2012 results for the EU-28 and OECD countries are early estimates and indicative only at the time of this release.
Map: EU GERD as a percentage of GDP (R&D intensity), 2012
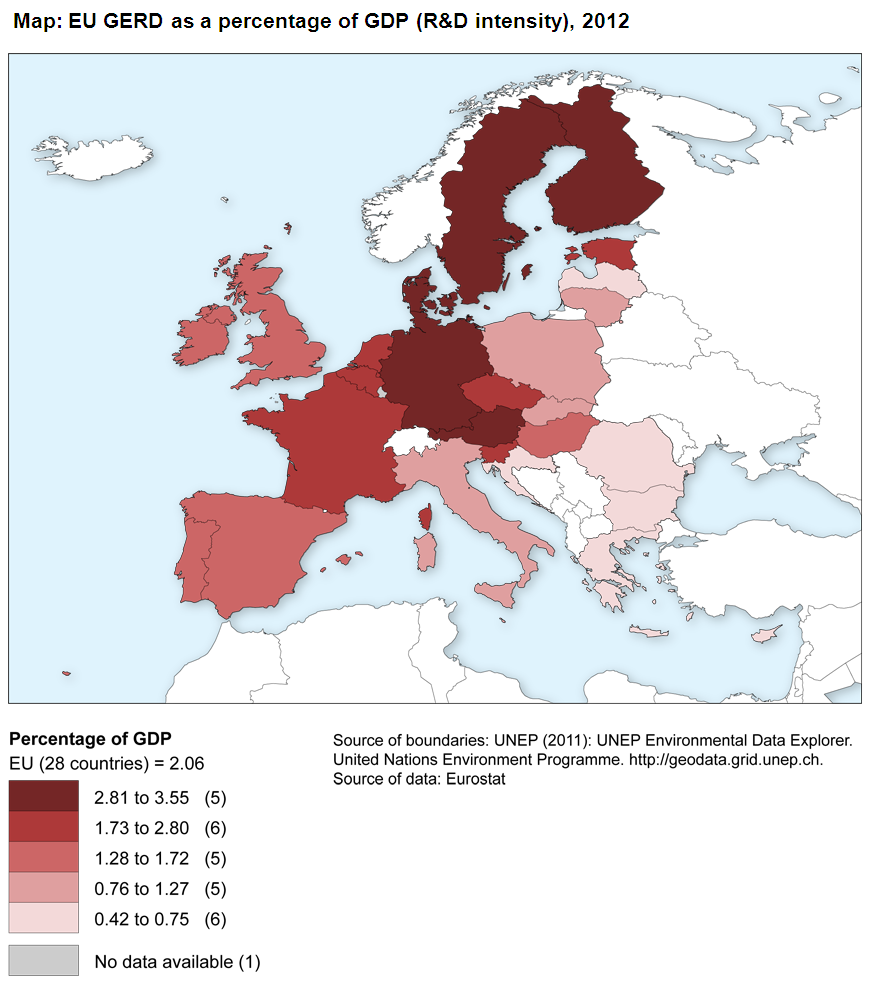
Source: Eurostat
Download this image Map: EU GERD as a percentage of GDP (R&D intensity), 2012
.png (285.1 kB)
Figure 9 presents the latest available 2012 estimates as a means of placing the UK into an international context with regards to GERD as a percentage of GDP. It shows the individual EU-28 countries’ GERD as a percentage of GDP, as well as the average for the EU-28, compared with the Europe 2020 target of 3%. The UK’s GERD represented 1.72% of GDP in 2012, the joint 12th highest percentage.
Figure 9: EU countries GERD as a percentage of GDP (R&D intensity), 2013
Source: Eurostat
Notes:
- * = Luxembourg data is for 2011.
Download this chart Figure 9: EU countries GERD as a percentage of GDP (R&D intensity), 2013
Image .csv .xlsThe latest OECD GERD estimates indicate that the modest increase in the EU GERD as a percentage of GDP that began in 2010 continued into 2011. OECD’s own preliminary estimates indicate an overall real growth rate for GERD of 3% between 2010 and 2012.
When comparing total business R&D intensity across countries, it is important to take into account differences in individual countries' industrial structures. The OECD has produced a Science, Technology and Industry Scoreboard to help facilitate these comparisons.
Back to table of contents