Table of contents
- Main points
- Summary publication
- Contents
- Understanding this release
- Summary of latest net borrowing and debt
- Net borrowing and debt data compared with OBR forecast
- Public sector and sub-sector net borrowing
- Public sector net cash requirement
- Public sector net debt
- Central government account
- Recent events and methodological changes
- Revisions since previous bulletin
- New for the bulletin
- List of tables associated with this bulletin
- Background notes
- Methodology
1. Main points
Public sector net borrowing excluding public sector banks decreased by £6.6 billion to £54.3 billion in the current financial year-to-date (April 2015 to October 2015) compared with the same period in 2014
Public sector net borrowing excluding public sector banks increased by £1.1 billion to £8.2 billion in October 2015 compared with October 2014
Public sector net debt excluding public sector banks at the end of October 2015 was £1,526.8 billion, equivalent to 80.5% of Gross Domestic Product; an increase of £70.4 billion compared with October 2014
General government net borrowing decreased by £9.6 billion to £93.5 billion (equivalent to 5.1% of Gross Domestic Product) in the financial year ending March 2015 (April 2014 to March 2015) compared with the previous financial year
Central government net cash requirement decreased by £7.9 billion to £42.4 billion in the current financial year-to-date (April 2015 to October 2015) compared with the same period in 2014
Due to the volatility of the monthly data, the cumulative financial year-to-date borrowing figures provide a better indication of the progress of the public finances than the individual months
2. Summary publication
A summary version of this publication is available Public Sector Finances, October 2015: A summary of the UK government’s financial position which some users may find helpful.
Back to table of contents3. Contents
Understanding this release
Introduces a number of important terms used within this release and how they fit together.
Summary of latest net borrowing and debt
Provides the latest public sector finance headline data and supporting information.
Net borrowing and debt data compared with OBR forecast
Compares the latest available data with Office for Budget Responsibility forecasts for borrowing and debt.
Public sector and sub-sector net borrowing
Shows how the public sector net borrowing position is made up of central government, local government and public corporations’ net borrowing.
Public sector net cash requirement
Provides the net cash requirement for the public sector (a measure of borrowing on a cash basis).
Public sector net debt
Shows the amount the public sector owes (the accumulation of its borrowing).
Central government account
Information about the central government account focusing on factors including the timing of receipts, expenditure and net investment.
Recent events and methodological changes
Information on events which have had an impact on the public sector finances in the last 12 to 18 months.
Revisions since previous bulletin
Information on the revisions between this publication and last month’s publication.
New for this bulletin
Information on new or recently added tables included in (or associated with) the current or future publications.
Back to table of contents4. Understanding this release
This statistical bulletin provides important information on the United Kingdom (UK) government financial position. It enables government, the public, economists and financial analysts to monitor public sector expenditure, receipts, investments, borrowing and debt. By comparing these data with forecasts from The Office for Budget Responsibility (OBR) the current UK fiscal position can be evaluated.
The following table and diagram are intended to provide users with the important terms needed to understand these data and how the statistics relate to each other.
Definition Table: the main terms needed to understand the data
| Term | Description |
| Accruals/accrued recording | – financial recording based on when ownership transfers or the service is provided (sometimes different to when cash is paid). |
| Asset Purchase Facility Fund (APF) | – an arm of The Bank of England able to purchase financial assets including government securities (gilts). The APF has earnt interest which is periodically transferred back to central government. |
| Cash recording | – financial recording based on when cash is paid or received. Net cash requirement is recorded on a cash basis and net debt is close to being a cash measure. |
| Current budget deficit | – the gap between current expenditure and current receipts (having taken account of depreciation). |
| Current expenditure | – spending on government activities including: social benefits, interest payments, and other government department spending (excluding spending on capital assets). |
| Current receipts | – income mainly from taxes (e.g. VAT, income and corporation taxes) but also includes interest, dividend and rent income. |
| ESA 1995 | – European System of Accounts 1995 was the European legal requirement for the production of National Accounts prior to September 2014. |
| ESA 2010 | – European System of Accounts 2010 is the European legal requirement for the production of National Accounts from September 2014. |
| Maastricht deficit | – general government net borrowing as defined within the Maastricht Treaty and Stability and Growth Pact (and as supplied to Eurostat) |
| Maastricht debt | – general government gross debt as defined within the Maastricht Treaty and Stability and Growth Pact (and as supplied to Eurostat). |
| Net borrowing | – measures the gap between revenue raised (current receipts) and total spending (current expenditure plus net investment). A positive value indicates borrowing while a negative value indicates a surplus. |
| Net cash requirement | – is a measure of how much cash the government needs to borrow (or lend) to balance its accounts (see cash recording). |
| Net debt | – is a measure of how much the government owes at a point in time. |
| Net investment | – spending on capital assets, e.g. infrastructure projects, property and I.T equipment, both as grants and by public sector bodies themselves minus capital receipts (sale of capital assets). |
| Source: Office for National Statistics | |
Download this table Definition Table: the main terms needed to understand the data
.xls (29.7 kB)Diagram 1 illustrates how debt between periods changes as a result of transaction flows (for example expenditure and receipts) on an accrued and cash basis. The transaction flows are provided for the current financial year-to-date (April 2015 to October 2015).
The headline measures of current budget deficit, net borrowing, net cash requirement and net debt are highlighted in the diagram as they provide the important indicators for the performance of the UK public finances.
When expenditure is greater than income, the public sector runs a deficit, known as the current budget deficit. Net borrowing is made up of the current budget deficit plus net investment (spending on capital less capital receipts). The diagram shows how net borrowing contributes to the change in net debt.
The net cash requirement is closely related to net debt (the amount owed). It is important because it represents the cash needed to be raised from the financial markets to service the government’s borrowing deficit. Changes in net debt between 2 points in time are normally similar to the net cash requirement for the intervening period, though the relationship is not an exact one.
Diagram 1: Changes in Public Sector Finances (excluding public sector banks) Financial year-to-date ending 2016 (£ billion)

Notes:
- Cash transactions in (non-financing) financial assets which do not impact on net borrowing
- Timing differences between cash and accrued data
- Revaluation of foreign currency debt (for example foreign currency). Debt issuances or redemptions above/below debt valuation (for example Bond premia/discounts and capital uplifts). Changes in volume of debt not due to transactions (for example Sector reclassification)
Download this image Diagram 1: Changes in Public Sector Finances (excluding public sector banks) Financial year-to-date ending 2016 (£ billion)
.png (76.7 kB)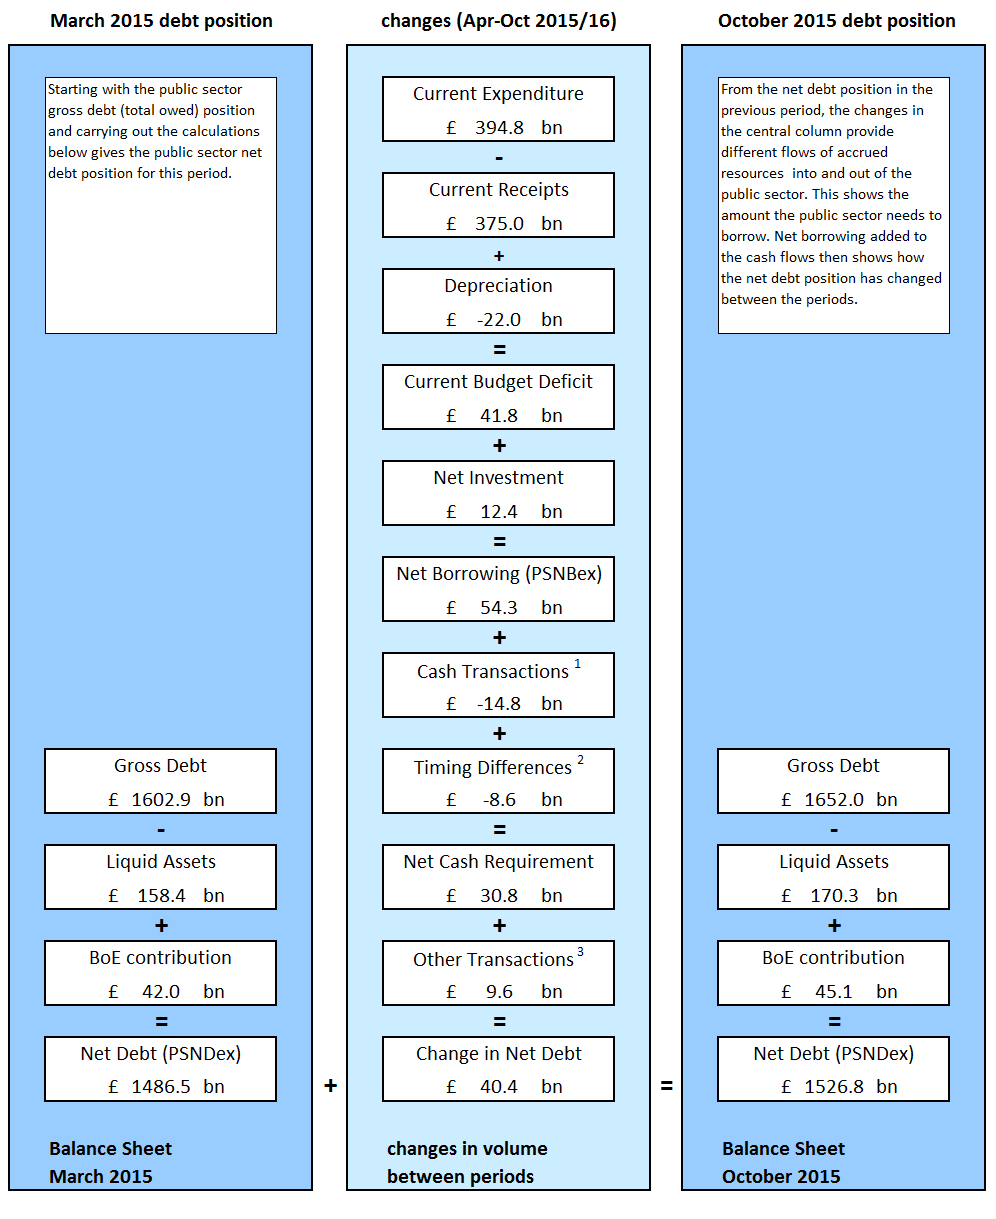
We value your feedback
The public sector finances can be complex. To ensure these important statistics are accessible to all, we welcome your feedback on how best to explain concepts and trends in these data. Please contact us at: psa@ons.gov.uk
Back to table of contents5. Summary of latest net borrowing and debt
This release presents the first estimate of October 2015 public sector finances and updates previous financial years’ data.
Public sector finance data are available on a monthly basis, but due to the volatility of the monthly time series, it is often more informative to look at the financial year-to-date or complete financial year data in order to discern underlying patterns. Estimates are revised over time as additional data becomes available.
Table 1 compares the latest month and cumulative totals for the financial year-to-date with the equivalent period in the previous year. Time series for each component are available in Table PSA1.
Table 1: Headline Public Sector Finances data, by month and financial year to date
| United Kingdom, excluding public sector banks | ||||||
| October | Financial year-to-date7 | |||||
| 2015 | 2014 | Change | 2015/16 | 2014/15 | Change | |
| Current Budget Deficit2 | 5.7 | 4.8 | 0.9 | 41.8 | 49.7 | -7.9 |
| Net Investment3 | 2.5 | 2.3 | 0.2 | 12.4 | 11.2 | 1.3 |
| Net Borrowing4 | 8.2 | 7.1 | 1.1 | 54.3 | 60.9 | -6.6 |
| Net Debt5 | 1,526.8 | 1,456.4 | 70.4 | 1,526.8 | 1,456.4 | 70.4 |
| Net Debt as a % of annual GDP6 | 80.5 | 79.4 | 1.1 | 80.5 | 79.4 | 1.1 |
| Source: Office for National Statistics | ||||||
| Notes: | ||||||
| 1. Unless otherwise stated | ||||||
| 2. Current Budget Deficit is the difference between current expenditure (including depreciation) and current receipts | ||||||
| 3. Net Investment is gross investment (net capital formation plus net capital transfers) less depreciation | ||||||
| 4. Net Borrowing is Current Budget Deficit plus Net Investment | ||||||
| 5. Net Debt is financial liabilities (for loans, deposits, currency and debt securities) less liquid assets | ||||||
| 6. GDP = Gross Domestic Product (at current market price) | ||||||
| 7. 2015/16 refers to financial year ending in March 2016 and 2014/15 refers to financial year ending in March 2015 | ||||||
Download this table Table 1: Headline Public Sector Finances data, by month and financial year to date
.xls (39.4 kB)Net borrowing for the financial year-to-date (April 2015 to October 2015)
Due to the volatility of the monthly data, the cumulative financial year-to-date borrowing figures provide a better indication of the progress of the public finances than the individual months.
In the financial year-to-date (April 2015 to October 2015), public sector net borrowing excluding banking groups (PSNB ex) was £54.3 billion; a decrease of £6.6 billion, or 10.9% compared with the same period in 2014. This decrease in net borrowing was predominantly due to a decrease of £5.9 billion in central government net borrowing, partially offset by an increase of £1.4 billion in local government net borrowing.
Over the same period, Bank of England (BoE) net borrowing was £2.0 billion lower than in the same period in 2014, almost entirely due to Asset Purchase Facility (APF) transfers to central government. The combined net borrowing of central government and the BoE in the financial year-to-date (April 2015 to October 2015) was £7.9 billion lower than in the previous financial year.
Central government receipts for the financial year-to-date (April 2015 to October 2015) were £354.8 billion, an increase of £10.5 billion, or 3.0%, compared with the same period in 2014. Of which:
income tax-related payments increased by £3.9 billion, or 4.5%, to £88.8 billion
VAT receipts increased by £2.8 billion, or 3.9%, to £74.8 billion
social (national insurance) contributions increased by £2.5 billion, or 4.0%, to £63.7 billion
corporation tax increased by £1.4 billion, or 5.3%, to £27.6 billion
Central government expenditure (current and capital) for the financial year-to-date (April 2015 to October 2015) was £402.6 billion, an increase of £4.5 billion, or 1.1%, compared with the same period in 2014. Of which:
other current expenditure (mainly departmental spending) increased by £2.4 billion, or 1.0%, to £236.2 billion; largely as a result of increases in departmental spending on goods and services, partially offset by decreases in transfers to local government
net social benefits (mainly pension payments) increased by £1.1 billion, or 1.0%, to £118.9 billion; largely as a result of increases in state pension payments (within National Insurance Fund benefits), being partially offset by a fall in public sector pension contributions
central government net investment (capital expenditure) increased by £1.0 billion, or 5.8%, to £17.8 billion; largely as a result of an increase in gross capital formation
debt interest was £29.7 billion, equivalent to that paid in the same period in 2014; of this £29.7 billion, £8.3 billion is the interest payable to the Bank of England Asset Purchase Facility on its gilt holdings (see Table PSA9) which are PSNB ex neutral.
Local government net borrowing (LGNB) for the financial year-to-date (April 2015 to October 2015) was estimated to be in surplus by £2.4 billion, a decrease in surplus of £1.4 billion on the same period in the previous year, mainly due to decreases in grants received from central government, particularly in April. Local government data for the current financial year-to-date are provisional estimates mainly based on budget figures received from the Department for Communities and Local Government (DCLG) and the devolved administrations.
Public corporations’ net borrowing (PCNB) for the financial year-to-date (April 2015 to October 2015) was estimated to be in surplus by £1.0 billion, an increase in surplus of £0.1 billion compared with the same period in 2014, mainly due to decreases in grants received from the public sector. Public corporation data for the current financial year-to-date are mainly provisional estimates.
Net borrowing in October 2015
In October 2015, public sector net borrowing excluding public sector banks (PSNB ex) was £8.2 billion; an increase in borrowing of £1.1 billion, or 16.1% compared with October 2014. This increase in net borrowing was largely due to an increase of £2.9 billion in central government net borrowing, combined with a decrease of £0.1 billion in local government net borrowing.
In October 2015, Bank of England (BoE) net borrowing was £1.7 billion lower than in the same period in 2014, almost entirely due to Asset Purchase Facility (APF) transfers to central government. The combined net borrowing of central government and the BoE in October 2015 was £1.2 billion higher than in October 2014.
Central government receipts in October 2015 were £54.5 billion, a decrease of £1.0 billion, or 1.8% compared with October 2014. Of this:
income tax-related payments increased by £0.4 billion, or 3.4%, to £11.5 billion
social (national insurance) contributions increased by £0.3 billion, or 3.5%, to £8.8 billion
VAT receipts increased by £0.2 billion, or 2.0%, to £11.0 billion
interest & dividends decreased by £2.0 billion, or 40.5%, to £2.9 billion
corporation tax decreased by £0.1 billion, or 1.1%, to £7.3 billion
Central government expenditure (current and capital) in October 2015 was £59.3 billion, an increase of £1.9 billion, or 3.3%, compared with October 2014. Of this:
other current expenditure (mainly departmental spending) increased by £1.4 billion, or 4.2%, to £33.9 billion; largely as a result of increases in expenditure on goods and services
debt interest increased by £0.3 billion, or 6.7%, to £5.2 billion; of this £5.2 billion, £1.2 billion is the interest paid to the Asset Purchase Facility Fund (APF) on its gilt holdings (see Table PSA9) which are PSNB ex neutral
central government net investment (capital expenditure) increased by £0.3 billion, or 8.6%, to £3.3 billion; largely as a result of an increase in capital transfers to other sectors
net social benefits (mainly pension payments) were £17.0 billion, equivalent to that paid in October 2014; largely as a result of increases in payments (within National Insurance Fund benefits) being largely offset by a fall in public sector pension contributions
In October 2015, local government net borrowing (LGNB) was estimated at £0.7 billion, a decrease of £0.1 billion on the previous year. Local government data for October 2015 are provisional estimates mainly based on budget figures received from the Department for Communities and Local Government (DCLG) and the devolved administrations.
In October 2015, public corporations’ net borrowing (PCNB) was estimated to be in surplus by £0.1 billion, a decrease in surplus of £0.1 billion on the previous year. Public corporation data for October 2015 are mainly provisional estimates.
Public sector net debt
Public sector net debt excluding public sector banks (PSND ex) at the end of October 2015 was £1,526.8 billion, equivalent to 80.5% of GDP; an increase of £70.4 billion compared with October 2014.
Debt is built up by successive government administrations over many years. When the government borrows, this adds to the debt total.
The £70.4 billion increase in debt between October 2014 and October 2015 was a result of:
£83.5 billion of public sector net borrowing
less £0.5 billion in timing differences between cash flows for gilt interest payments and the accrued gilt interest flows
less £12.6 billion in net cash transactions related to acquisition or disposal of financial assets of equivalent value (for example loans) and timing of recording
6. Net borrowing and debt data compared with OBR forecast
The Office for Budget Responsibility (OBR) normally produces forecasts of the public finances twice a year (normally in March and December). The latest OBR forecast was published on 8 July 2015, with the next publication scheduled for Wednesday 25 November 2015.
Figure 1 and Table 2 enable users to compare emerging data against the OBR forecasts. Caution should be taken when comparing public finance data with OBR figures for the full financial year, as data are not finalised until after the financial year ends. Initial estimates soon after the end of the financial year can be subject to sizeable revisions in later months. In addition, in-year timing effects on spending and receipts can affect year-to-date comparisons with previous years.
There can also be some methodological differences between OBR forecasts and outturn data. In its latest publication, OBR published a table within their Economic and fiscal outlook supplementary fiscal tables July 2015 annex titled ‘Table: 2.42 Items included in OBR forecasts that ONS have not yet included in outturn’.
Figure 1 illustrates the public sector net borrowing excluding public sector banks (PSNB ex) for the financial year ending 2015 (April 2014 to March 2015), along with the first 7 month’s borrowing of the financial year ending 2016 (April to October 2015).
Figure 1: Cumulative public sector net borrowing by month
All data excluding public sector banks, United Kingdom
Source: Office for National Statistics
Notes:
- For the financial year ending 2015 (April 2014 to March 2015) and the financial year ending 2016 (April 2015 to March 2016)
- OBR forecast for PSNB ex from March 2015 Economic & Fiscal Outlook (EFO)
- OBR forecast for PSNB ex from July 2015 Economic & Fiscal Outlook (EFO)
Download this chart Figure 1: Cumulative public sector net borrowing by month
Image .csv .xlsIn the financial year-to-date (April to October 2015), borrowing fell by £6.6 billion to £54.3 billion compared with the same period in 2014.
The OBR forecast for the financial year ending 2016 (April 2015 to March 2016) is £69.5 billion which is £20.6 billion below the outturn in financial year ending 2015 (April 2014 to March 2015) presented in this bulletin.
Table 2 summarises the percentage change between the latest data for the financial year-to-date (April to October 2015) and in the previous financial year (April to October 2014). It contrasts these data with the percentage change between the latest full year outturn data for the financial year ending 2015 (April 2014 to March 2015) and the OBR forecast for the financial year ending 2016 (April 2015 to March 2016) (as published in July 2015).
Table 2: Public Sector Latest Outturn Estimates vs Office for Budget Responsibility (OBR) Forecasts
| United Kingdom, excluding public sector banks | ||||||
| Financial year-to-date (April-October) | Financial Year7 | |||||
| 2015/16 | 2014/15 | Increase / Decrease % | 2015/16 OBR Forecast6 | 2014/15 Outturn | Forecast Increase / Decrease % | |
| Current Budget Deficit2 | 41.8 | 49.7 | -15.8 | 40.8 | 59.7 | -31.7 |
| Net Investment3 | 12.4 | 11.2 | 11.3 | 28.7 | 30.4 | -5.7 |
| Net Borrowing4 | 54.3 | 60.9 | -10.9 | 69.5 | 90.1 | -22.9 |
| Net Debt5 | 1,526.8 | 1,456.4 | 4.8 | 1,532.0 | 1,486.5 | 3.1 |
| Net Debt as a % of GDP | 80.5 | 79.4 | - | 80.3 | 80.0 | - |
| Source: Office for National Statistics | ||||||
| Notes: | ||||||
| 1. Unless otherwise stated | ||||||
| 2. Current Budget Deficit is the difference between current expenditure (including depreciation) and current receipts | ||||||
| 3. Net Investment is gross investment (net capital formation plus net capital transfers) less depreciation | ||||||
| 4. Net Borrowing is Current Budget Deficit plus Net Investment | ||||||
| 5. Net Debt is financial liabilities (for loans, deposits, currency and debt securities) less liquid assets | ||||||
| 6. All OBR figures are from the OBR Economic and Fiscal Outlook published on 08 July 2015 | ||||||
| 7. Full financial year ending 2015 (April 2014 to March 2015) and full financial year ending 2016 (April 2015 to March 2016) | ||||||
Download this table Table 2: Public Sector Latest Outturn Estimates vs Office for Budget Responsibility (OBR) Forecasts
.xls (39.9 kB)On the same day as this bulletin is released, the OBR publishes a commentary on the latest figures and how these reflect on its forecasts. The OBR provides this commentary to help users interpret the differences between the latest outturn data and the OBR forecasts by providing contextual information about assumptions made during the OBR’s forecasting process.
Back to table of contents7. Public sector and sub-sector net borrowing
In the UK, the public sector consists of 5 sub-sectors: central government, local government, public non-financial corporations, Bank of England and public financial corporations (that is, public sector banks). Table 3 summarises the current monthly and year-to-date borrowing position of each of these sub-sectors along with the public sector aggregates. Full time series for these data can be found in Table PSA2.
Table 3: Sub-sector Breakdown of Public Sector Net Borrowing
| United Kingdom | ||||||
| £ billion (not seasonally adjusted) | ||||||
| October | Financial year-to-date1 | |||||
| 2015 | 2014 | Change | 2015/16 | 2014/15 | Change | |
| General Government | 7.1 | 4.2 | 2.8 | 55.9 | 60.4 | -4.5 |
| of which | ||||||
| Central Government | 6.3 | 3.4 | 2.9 | 58.3 | 64.2 | -5.9 |
| Local Government | 0.7 | 0.8 | -0.1 | -2.4 | -3.8 | 1.4 |
| Public Non-Financial Corporations | -0.1 | -0.2 | 0.1 | -1.0 | -0.9 | -0.1 |
| Bank of England | 1.3 | 3.0 | -1.7 | -0.6 | 1.4 | -2.0 |
| Public Sector ex (PSNB ex) | 8.2 | 7.1 | 1.1 | 54.3 | 60.9 | -6.6 |
| Public Financial Corporations | -0.8 | -0.8 | 0.0 | -5.5 | -5.1 | -0.4 |
| Public Sector (PSNB) | 7.5 | 6.3 | 1.1 | 48.8 | 55.8 | -7.0 |
| Source: Office for National Statistics | ||||||
| Notes: | ||||||
| 1. 2015/16 refers to financial year ending in March 2016 and 2014/15 refers to financial year ending in March 2015 | ||||||
Download this table Table 3: Sub-sector Breakdown of Public Sector Net Borrowing
.xls (44.0 kB)Figure 2 illustrates public sector net borrowing excluding public sector banks (PSNB ex) for the last 22 financial years and highlights that between the financial year ending 1999 (April 1998 to March 1999) and the financial year ending 2001 (April 2000 to March 2001), borrowing was in surplus, that is, the public sector was a net lender.
Figure 2: Public sector net borrowing excluding public sector banks; the financial year ending 1994 to date
All data excluding public sector banks, United Kingdom

Source: Office for National Statistics
Notes:
- OBR full financial year forecast for PSNB ex from July 2015 Economic & Fiscal Outlook (EFO)
- Financial year 1993/94 represents financial year ending 1994 (April 1993 to March 1994)
- Ytd = year-to-date (April to October)
- GDP = Gross Domestic Product
Download this image Figure 2: Public sector net borrowing excluding public sector banks; the financial year ending 1994 to date
.png (28.7 kB) .xls (176.1 kB)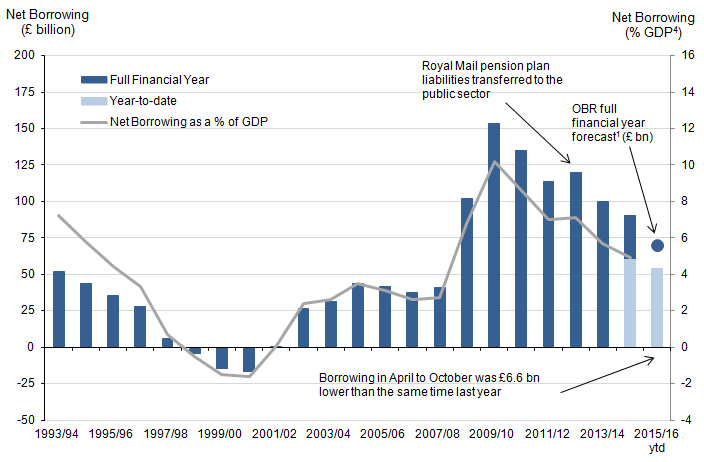
PSNB ex peaked in the financial year ending 2010 (April 2009 to March 2010) as the effects of the economic downturn impacted on the public finances (reducing tax receipts while expenditure continued to increase). PSNB ex has reduced since then, although remained higher than before the financial year ending 2008 (April 2007 to March 2008) and the 2007 global financial market shock.
PSNB ex in the financial year ending 2013 (April 2012 to March 2013) was higher than in the previous financial year largely as a result of the recording of an £8.9 billion payable capital grant in April 2012, as recognition that the liabilities transferred from the Royal Mail Pension Plan exceeded the assets transferred.
Back to table of contents8. Public sector net cash requirement
Net cash requirement is a measure of how much cash the government needs to borrow (or lend) to balance its accounts. In very broad terms, net cash requirement equates to the change in the level of debt.
Central government net cash requirement is reconciled against the change in central government net debt in Table REC3 attached to this bulletin.
The public sector net cash requirement excluding public sector banks (PSNCR ex) follows a similar trend to that of public sector net borrowing: peaking in the financial year ending 2010, though in recent years transfers from the Asset Purchase Facility have had a substantial impact on PSNCR ex but are PSNB ex neutral.
Public sector net cash requirement excluding public sector banks (PSNCR ex) in the financial year-to-date (April 2015 to October 2015) was £30.8 billion; £8.5 billion, or 21.5% less than in the same period in 2014.
Diagram 2 presents public sector cash requirement by sub-sector for the current financial year-to-date (April 2015 to October 2015). Time series for each of these component series are presented in Table PSA7A attached to this bulletin.
Diagram 2: Sub-sector split of public sector net cash requirement excluding public sector banks, financial year-to-date (April to October 2015) (£ billion)

Notes:
- APF - Bank of England Asset Purchase Facility
Download this image Diagram 2: Sub-sector split of public sector net cash requirement excluding public sector banks, financial year-to-date (April to October 2015) (£ billion)
.png (41.0 kB)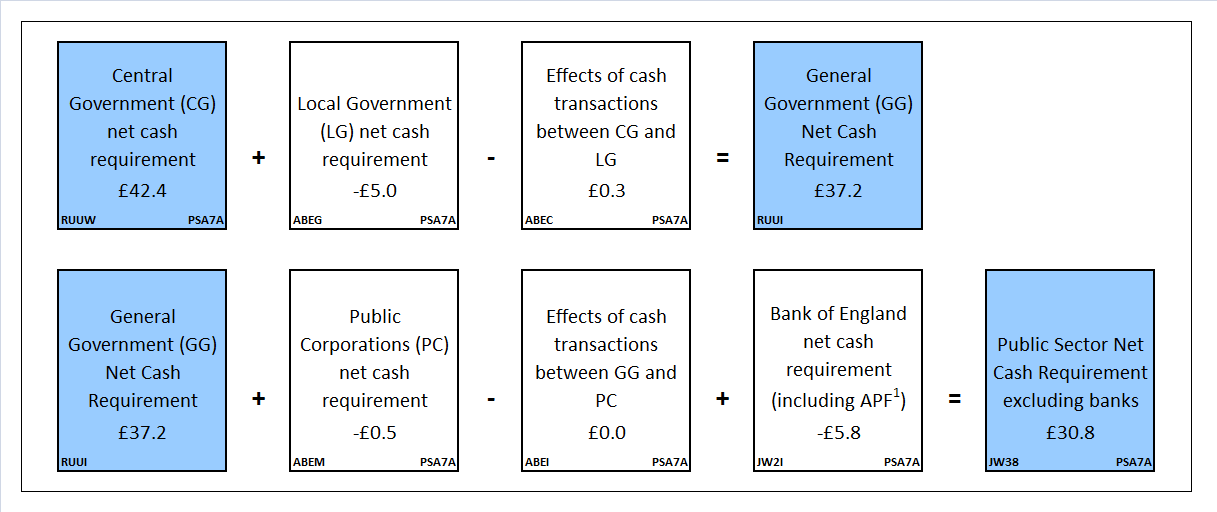
Effects of cash transactions between sub-sectors are removed in calculating public sector total net cash requirement (and consolidated expenditure and income totals)
Central government net cash requirement (CGNCR) is a focus for some users, as it provides an indication of how many gilts (government bonds) the Debt Management Office may issue to meet the government’s borrowing requirements.
CGNCR was in surplus by £0.8 billion in October 2015; £4.0 billion, or 84.3% less of a surplus than in October 2014.
In the current financial year-to-date (April 2015 to October 2015), CGNCR was £42.4 billion; a decrease of £7.9 billion, or 15.6%, compared with the same period in 2014.
Cash transfers from the Asset Purchase Facility (APF) were £2.1 billion lower in the current financial year-to-date (April 2015 to October 2015), than the previous financial year. Without the impact of these transfers, CGNCR would have been £9.9 billion lower in the current financial year-to-date (April 2015 to October 2015) than the same period in 2014.
Recent events impacting on CGNCR
In the financial year ending 2016 (April 2015 to March 2016) the following events reduced the CGNCR:
the transfers between the Bank of England Asset Purchase Facility Fund (BEAPFF) and central government
the sale of shares in Lloyds Banking Group
the sale of shares in Eurostar
the sale of shares in Royal Mail
the sale of shares in Royal Bank of Scotland
In the financial year ending 2015 (April 2014 to March 2015) the following events reduced the CGNCR:
the transfers between the BEAPFF and central government
the sale of shares in Lloyds Banking Group
In the financial year ending 2014 (April 2013 to March 2014) the following events reduced the CGNCR:
the transfers between the BEAPFF and central government
the sale of shares in Lloyds Banking Group
the sale of shares in Royal Mail
In the financial year ending 2013 (April 2012 to March 2013) the following events reduced the CGNCR:
the transfers between the BEAPFF and central government
the Royal Mail Pension Plan transfer and subsequent sale of assets
the transfer of the Special Liquidity Scheme final profits between BoE and central government
the 4G Spectrum sale
Public sector net cash requirement
Although the central government net cash requirement is the largest part of the public sector net cash requirement excluding public sector banks (PSNCR ex), the total public sector net cash requirement (PSNCR) can be very different. The reason is that the PSNCR includes the net cash requirement of the public sector banking groups. In recent years, the public sector banking groups have recorded large cash surpluses which have had a substantial impact on the public sector net cash requirement.
Back to table of contents9. Public sector net debt
Public sector net debt ex (PSND ex) represents the amount of money the public sector owes to UK private sector organisations and overseas institutions, largely as a result of government financial liabilities on the bonds (gilts) and Treasury bills it has issued.
For the purposes of UK fiscal policy, net debt is defined as total gross financial liabilities less liquid financial assets, where liquid assets are cash and short-term assets which can be released for cash at short notice and without significant loss. These liquid assets mainly comprise foreign exchange reserves and bank deposits.
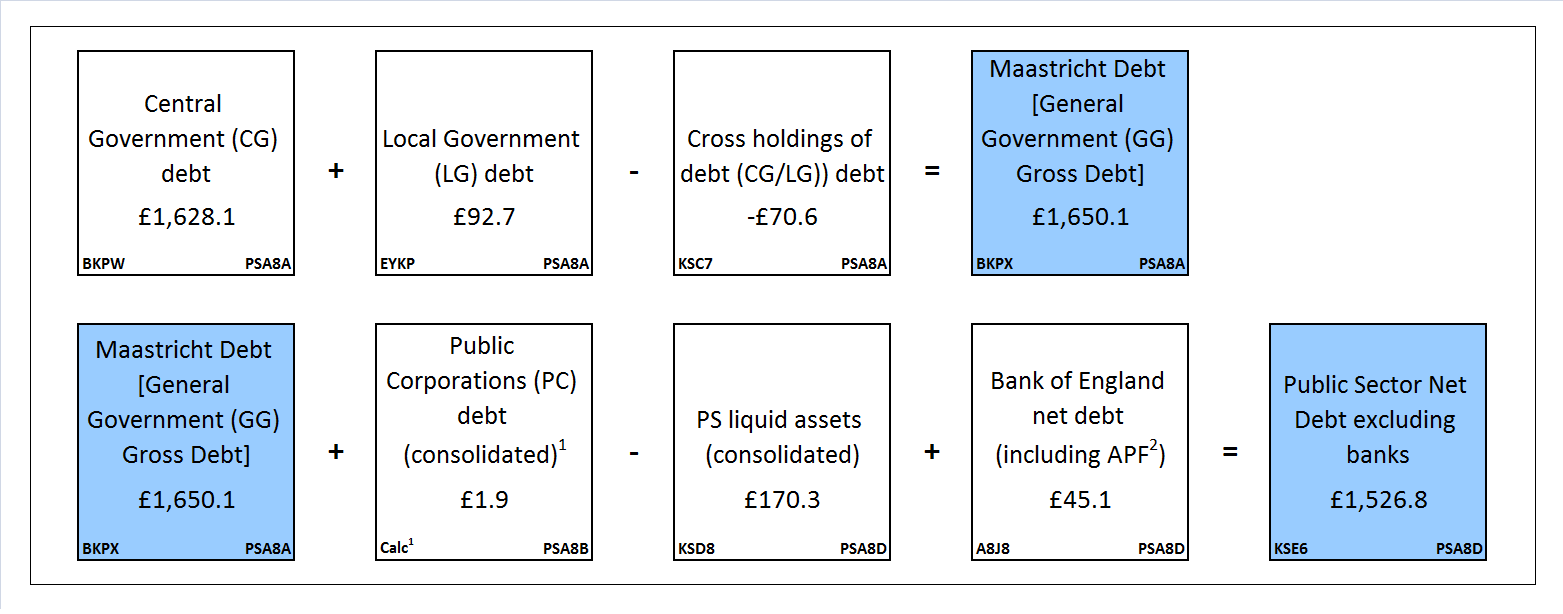
Diagram 3 presents public sector excluding public sector banks debt at the end of October 2015 by sub-sector. Time series for each of these component series are presented in Tables PSA8A to D attached to this bulletin.
Diagram 3: Sub-sector split of public sector net debt excluding public sector banks at October 2015 (£ billion)
Notes:
- PC Corporations' debt (consolidated) = non-financial PC gross debt (EYYD) Less CG/NFPCs' gross debt (KSC8) Less LG/NFPCs' cross holdings of debt (KSC9)
- APF - Bank of England Asset Purchase Facility
Download this image Diagram 3: Sub-sector split of public sector net debt excluding public sector banks at October 2015 (£ billion)
.png (57.5 kB)
Cross holdings between sub-sectors are removed in calculating public sector net debt, gross debt and liquid assets.
Figure 3 illustrates public sector net debt excluding banking groups (PSND ex) from the financial year ending March 1994 to date. PSND ex represents the amount of money the public sector owes to UK private sector organisations and overseas institutions, largely as a result of government liabilities on the bonds (gilts) and Treasury bills it has issued.
The increases in debt between the financial year ending 2009 (April 2008 to March 2009) and the financial year ending 2011 (April 2010 to March 2011) were larger than in the early part of the decade, as the economic downturn meant public sector net borrowing excluding public sector banks (PSNB ex) increased. Since then it has continued to increase but at a slower rate.
Figure 3: Public sector net debt excluding public sector banks; the financial year ending 1994 to date
All data excluding public sector banks, United Kingdom
Notes:
- Financial year ending 1994 (April 1993 to March 1994) to the financial year ending 2015 (April 2014 to March 2015)
- GDP = Gross Domestic Product
- ytd = year-to-date (April to October)
Download this chart Figure 3: Public sector net debt excluding public sector banks; the financial year ending 1994 to date
Image .csv .xlsChanges in net debt between 2 points in time are normally similar to the net cash requirement for the intervening period, though the relationship is not an exact one because the net cash requirement reflects actual prices paid while the net debt is at nominal prices. For instance, gilts are recorded in net debt at their redemption (or face) value, but they are often issued at a different price due to premia or discounts being applied. The net cash requirement will reflect the actual issuance and redemption prices, but net debt only ever records the face (or nominal) value.
Back to table of contents10. Central government account
Figure 4 illustrates that the central government current budget deficit (as a percentage of GDP) has reduced since the financial year ending 2010 (April 2009 to March 2010), but is still larger than before the global financial shock.
Figure 4: Central government receipts, expenditure and current budget deficit as a percentage of GDP by financial year; the financial year ending 1994 to the financial year ending 2015
All data excluding public sector banks, United Kingdom
Source: Office for National Statistics
Notes:
- The financial year ending 1994 (April 1993 to March 1994) to the financial year ending 2015 (April 2014 to March 2015)
- Current budget deficit is receipts minus expenditure but also includes the effects of depreciation
- GDP = Gross Domestic Product
Download this chart Figure 4: Central government receipts, expenditure and current budget deficit as a percentage of GDP by financial year; the financial year ending 1994 to the financial year ending 2015
Image .csv .xlsIn October 2015, the central government current budget deficit was £3.1 billion, an increase of £2.7 billion, or 656.3% compared with October 2014.
In recent years the current budget has been in deficit in most months. January and July tend to be surplus months as these are the 2 months with the highest receipts.
a) Current receipts
As cash receipts are generally accrued back to earlier periods when the economic activity took place, the first monthly estimate for receipts is by nature provisional, and must include a substantial amount of forecast data.
Central government receipts follow a strong cyclical pattern over the year, with high receipts in April, July, October and January due to quarterly corporation tax returns being accrued to these months.
In both January and July (to a lesser extent) accrued receipts are particularly high due to receipts from quarterly corporation tax combining with those from income tax self-assessment. The revenue raised through income tax self-assessment, as well as primarily affecting January and July receipts, also tends to lead to high receipts in the following month (February and October respectively), although to a lesser degree.
Pay as you earn (PAYE) tends to vary little throughout the financial year on a monthly basis (excluding bonus months).
In recent years transfers from both the Bank of England Asset Purchase Facility Fund (BEAPFF) and the Special Liquidity Scheme (SLS) have boosted central government receipts. Though these transfers to central government have no impact on public sector borrowing due to the central government receipts being offset by the payments from the Bank of England.
b) Current expenditure
Trends in central government current expenditure can be affected by monthly changes in debt interest payments which can be volatile as they depend on the monthly path of the Retail Prices Index. It can therefore be informative to consider the total central government current expenditure excluding debt interest payments.
The profile of accrued central government current expenditure excluding debt interest is generally less volatile through the year. However, one regular peak is in net social benefits, which are higher in November than in other months because this is when the winter fuel allowance is paid.
Growth in net social benefits is affected by inflation. Benefits were uprated by 5.2% in the financial year ending 2013 (April 2012 to March 2013) in line with the Consumer Prices Index (CPI). This contrasts with an equivalent figure of 2.2% in the financial year ending 2014 (April 2013 to March 2014), 2.7% in the financial year ending 2015 (April 2014 to March 2015) and 1.2% in the financial year ending 2016. However, for State Pensions there is a “triple guarantee” that means that they are uprated by the highest of the CPI, increases in earnings or 2.5%, which is the rise for the financial year ending 2016 (April 2015 to March 2016). Since the financial year ending 2014 (April 2013 to March 2014), the uprating only applies to benefits received by disabled people and pensioners – benefits for people of working age have only been increased by 1% in these 3 years.
It is difficult to compare the profile of monthly central government expenditure excluding debt interest and net social benefits since the financial year ending 2014 (April 2013 to March 2014) with earlier years because of a number of changes to central government funding for local authorities (in particular the timing of grants).
In the financial year ending 2012 (April 2011 to March 2012) and earlier years, the funds were distributed in multiple, similar-sized, payments throughout the year. In the financial year ending 2013 (April 2012 to March 2013), local authorities received almost all their funding from the Department for Communities and Local Government (DCLG) through redistributed business rates, rather than the Revenue Support Grant (RSG). In addition, in the financial year ending 2013 (April 2012 to March 2013), as in previous years, the bulk of the RSG was paid in April, with a smaller balance paid in February.
From the start of the financial year ending 2014 (April 2013 to March 2014), local authorities retained half of the business rates they collect, with the remainder redistributed through the RSG. The retained business rates are still classified as a central government tax (see background note on business rates). Furthermore, the RSG in the financial year ending 2014 (April 2013 to March 2014) (and in the financial year ending 2015 (April 2014 to March 2015)) included a number of grants that were paid by other departments in the financial year ending 2013 (April 2012 to March 2013), including one to fund council tax benefit localisation and was again paid mainly in April with a smaller balance in February. This means that central government current expenditure year-on-year growth for April and February for the financial year ending 2014 (April 2013 to March 2014) was high, while year-on-year growth in other months was generally lower.
In the financial year ending 2016 (April 2015 to March 2016) the RSG has been paid to local authorities with a different profile with a third of the total being paid in April and the remainder in equal instalments in all the other months. This means that for this financial year current expenditure growth in April and February will be lower while year on year growth in other months will generally be higher.
c) Net investment
Central government net investment is difficult to predict in terms of its monthly profile as it includes some large capital grants (such as those to local authorities and education institutions), and can include some large capital acquisitions or disposals, all of which vary from year to year. Net investment in the last quarter of the financial year is usually markedly higher than that in the previous 3 quarters.
Central government net investment includes the direct acquisition minus disposal of capital assets (such as buildings, vehicles, computing infrastructure) by central government. It also includes capital grants to and from the private sector and other parts of the public sector. Capital grants are varied in nature and cover payments made to assist in the acquisition of a capital asset, payments made as a result of the disposal of a capital asset, transfers in ownership of a capital asset and the unreciprocated cancellation of a liability.
Back to table of contents11. Recent events and methodological changes
Classification decisions
Each quarter we publish a Forward Workplan outlining the classification assessments we expect to undertake over the coming 12 months. To supplement this, each month a Classifications Update is published which includes expected implementation points (for different statistics) where possible.
Classification decisions are reflected in the public sector finances at the first available opportunity and where necessary outlined in this section of the statistical bulletin.
Sale of loans by UKAR
On 13 November 2015 UK Asset Resolution (UKAR) announced an agreement to sell £13 billion of assets. UKAR is classified as a central government body. When the sale is concluded it is expected to reduce UKAR’s liabilities to the private sector and will also enable UKAR to repay some of its loan from the government. These balance sheet movements will affect public sector net debt (PSND) and central government net cash requirement (CGNCR), but will have no immediate impact on public sector net borrowing (PSNB), although any future reduction in debt interest payments and receipts will impact PSNB.
Share sales
In recent years the government has entered a program of selling shares in publically owned organisations. For most share sales, the proceeds will reduce the central government net cash requirement (CGNCR) and public sector net debt (PSND) by an amount corresponding to the cash raised from the sale but have no impact on public sector net borrowing.
This section outlines the recent central government share sale program. In addition OBR discuss state-owned asset sales in their Economic and Fiscal Outlook July 2015 indicating expected future share sales in Chart 4.14.
Lloyds Banking Group
On 17 September 2013, the UK government began selling part of its share holdings in Lloyds Banking Group (LBG). A further share sale on 23 and 24 March 2014 meant that the UK government surrendered in total a 13.5% stake in the institution, a quantity sufficient to lead to LBG being re-classified from a public sector body to a private sector body.
Since December 2014, the government has continued reducing its shareholding in LBG via a pre-arranged trading plan, raising an estimated total of £16.2 billion to date. In June 2015 the government announced that it will launch a LBG share sale to the public "in the next 12 months".
In October 2015, an estimated £1.0 billion raised from these sales reduced central government net cash requirement and net debt in October 2015 by a corresponding amount.
Royal Bank of Scotland
In August 2015, the government announced the sale of approximately 5.4% of its shareholding in Royal Bank of Scotland. The £2.1 billion raised from this sale reduced central government net cash requirement and net debt in August 2015 by a corresponding amount.
Royal Mail
In June 2015, the government announced the sale of half of its retained shareholding in Royal Mail. The £750 million raised from this sale of a 15% stake reduced central government net cash requirement and net debt in June 2015 by a corresponding amount.
Eurostar
In March 2015, the government announced the sale of its 40% stake in the cross-Channel train operator Eurostar. The £757 million raised from this sale reduced central government net cash requirement and net debt in May 2015 by a corresponding amount.
Housing associations
As we announced on 30 October 2015 (118 Kb Pdf), "private registered providers” of social housing in England have been reclassified from the private corporation sector to the public corporation sector. The reclassification affects over 1,500 bodies providing social housing, including most housing associations and some for-profit housing bodies.
The reclassification will increase public sector net debt (PSND) back to July 2008 as the outstanding debt of the social housing providers is added. Based on data published by the Homes and Communities Agency (HCA), we estimate estimate that PSND at the end of March 2014 will increase by £55 billion and that public sector net borrowing (PSNB) for the financial year ending March 2014 will increase by around £3 billion. From discussions with the HCA, it is likely that PSNB for the financial year ending March 2015 will be higher at around £4.5 billion and assuming that this borrowing is financed by loans, bonds or similar instruments that PSND in this year will be £4.5 billion higher than the previous year at a total debt of £59 billion. These are initial estimates that may revise once further work has been completed to assure that the data being used are consistent with public sector finances methodologies and once the final outturn data for the financial year ending 2015 are available.
As indicated in the announcement on 30 October, we will continue to work to implement the reclassification in the public sector finances with the aim of inclusion in early 2016. Reclassifications such as this require some time to implement as data must be assured for quality and consistency with public sector finance methodologies and full monthly time series must be constructed (in this case back to July 2008).
Taxes and other revenue
In last month's bulletin we announced that in December 2015 we will be incorporating a number of taxes on production for the first time. These inclusions will reduce public sector net borrowing in the financial years ending 2014 and 2015 by approximately £140 million in each year and reapportion some central government income between taxes and fees. Taxes are recorded as current receipts whereas fees are recorded in the public sector finances as market output, which is a negative component of current expenditure. More detail on the taxes is provided below.
Police Service Agreement – British Transport Police Authority (BTPA) enters into agreements with train, freight and other operating companies in order to providing a policing service to their railway or railway property. These agreements, referred to as Police Services Agreements (PSAs), also require the companies to make payments for the service. Currently these payments are being treated as fees, so there will be no impact on net borrowing. Implementing the reclassification of these payments from fees to taxes will lead to an increase in central government current expenditure and an equal increase in central government current receipts. Data back to April 2004 will be affected with the magnitude of the change in the financial years ending 2013 and 2014 being £280 million and £240 million respectively.
Heavy Goods Vehicle Road User Levy – The government has introduced a road user levy for heavy goods vehicles (HGV) of 12 tonnes or more. The aim of the levy is to ensure these vehicles make a contribution to the wear and tear of the road network. The levy was introduced by the HGV Road User Levy Act 2013 and began on 1 April 2014. Since April 2014 this levy has been included in the public sector finances as part of Vehicle duty receipts, so there will be no impact on net borrowing. However, currently the levy is being split between duty paid by businesses and duty paid by households rather than including it all in vehicle duty paid by businesses. Correcting this apportionment will result in a downward revision to vehicle duty paid by households of around £120 million in the financial year ending 2015 and a matching increase in vehicle duty paid by businesses.
Community Infrastructure Levy – Community Infrastructure Levy is a planning charge, introduced by the Planning Act 2008 as a tool for local authorities in England and Wales to help deliver infrastructure to support the development of their area. It came into force on 6 April 2010 through the Community Infrastructure Levy Regulations 2010. The Community Infrastructure Levy has not previously been included and so its inclusion will reduce borrowing. Current estimates are that borrowing in the financial years ending in 2014 and 2015 will reduce by approximately £50 million.
Light dues – Light dues are the charges levied on ships for the maintenance of lighthouses and other aids to navigation. It is estimated that the inclusion of light dues will reduce public sector net borrowing by a little under £90 million in the financial years ending 2014 and 2015.
In addition to the above 4 taxes, further quality assurance work by ONS and HM Treasury has identified some additional departmental income that is not currently incorporated in the Public Sector Finances.
We are working on sourcing full time series for these income streams and aim to introduce them in early 2016.
The majority of these income items are fees for services (which are recorded as negative current expenditure) with an expected impact, in the financial year ending 2015, of reducing annual public sector net borrowing by approximately £0.5 billion.
There is a further £0.2 billion which are likely to increase current receipts (both through taxes on production and other receipts) and so reduce net borrowing.
There may also be a small reduction in net investment, and so net borrowing, as a result of some additional capital receipts.
New VAT rules for electronic services
On 1 January 2015, VAT rules relating to the supply of telecommunications, radio and television broadcasting and electronically supplied services changed.
Prior to 1 January 2015, supplies made by EU businesses to EU resident customers were subject to VAT in the country where the suppliers were established; from 1 January 2015, the supplies will be subject to VAT in the country where the customer is resident. The tax changes are as a result of European legislation.
The legislation provides for a transition period of 4 years during which the tax authority in the country where the supplier is located can retain a part of the VAT collected prior to passing on the remainder of the collected tax to the country where the customer is resident. From 1 January 2019, all collected tax must be transferred to the tax authority in the appropriate country.
We are currently considering how the transferred and retained tax should be treated in the public sector finances and will provide more detail over the coming months.
Diverted Profit Tax
The government has introduced a new tax – the Diverted Profits Tax – to counter the use of aggressive tax planning techniques used by multinational enterprises to divert profits from the UK. The legislation is included in the Finance Act 2015, and applies from 1 April 2015.
In public sector finances, Diverted Profit Tax will be treated as a tax on income and wealth and so reduce central government net borrowing.
Bank of England Asset Purchase Facility Fund
The APF currently holds government securities (gilts) on which it earns interest and it pays interest on the reserves created by the Bank of England to finance it. These flows are reflected in PSNB ex as they enter and leave the APF. The net liabilities of the APF increase PSND ex.
On 9 November 2012, the Chancellor announced an agreement with the Bank of England to transfer the excess cash in the APF to the Exchequer. These flows are internal to the public sector and so do not affect PSNB ex.
Note this treatment follows the conclusion of the 2013 PSF Review consultation (129.2 Kb Pdf).
In October 2015, £2.3 billion was transferred from the Bank of England Asset Purchase Facility Fund (BEAPFF) to HM Treasury, raising the amount transferred in the current financial year-to-date (April 2015 to October 2015) to £6.6 billion; £2.1 billion less than in the equivalent period in 2014.
The next expected APF transfer will occur in January 2016.
The Bank of England entrepreneurial income for the financial year ending 2015 (April 2014 to March 2015) was calculated as £12.5 billion. This is the total amount of dividend transfers that can impact on central government net borrowing in the financial year ending 2016 (April 2015 to March 2016).
Between April 2012 to March 2013, there were £11.3 billion of transfers from the BEAPFF to HM Treasury, while in the same period in financial year ending 2014 and 2015 the transfers were £31.1 billion and £10.7 billion respectively.
All cash transferred from the Asset Purchase Facility to HM Treasury is fully reflected in central government net cash requirement and net debt. For more detail of transactions relating to the Asset Purchase Facility, see Table PSA9.
Grants to local government
The Revenue Support Grant (RSG) is the main revenue funding grant paid by central government to local government in England.
In the financial year ending 2015 (March 2014 to April 2015), more than half of the RSG was paid in April with the remaining balance paid in February and March. The payment profile has changed for the financial year ending 2016 (March 2015 to April 2016), with one-third of the grant paid in April and the rest expected to be paid evenly through the year.
This change in profile explains almost all of the fall in central government current transfers to local government and central government other current spending in April 2015 compared with April last year. The impact of this change is offset in local government net borrowing.
Summer Budget 2015
In their July 2015 Economic and Fiscal Outlook, the Office for Budget Responsibility referred to uncertainty around the statistical implementation of 2 policy changes. These were the social sector rent measure which starts in the financial year ending 2017 and the movement of corporation tax payment dates which will be implemented in the financial year ending 2018. We will consider how transactions related to these, and any other Budget policies, will be recorded in the public finances and inform users in due course.
Back to table of contents12. Revisions since previous bulletin
In publishing monthly estimates, it is necessary that a range of different types of data sources are used. A summary of the different sources used and the implications this has for data revisions is provided in the document Sources summary and their timing (22.8 Kb Pdf).
The Public Sector Finances Revision Policy provides information of when users of the statistics published in the public sector finances and Government Deficit and Debt under the Maastricht Treaty statistical bulletins should expect to see methodological and data related revisions.
More detail of the methodology and sources employed can be found in the Public Sector Finances Methodological Guide (360.3 Kb Pdf).
We recently published an article explaining the use of GDP in fiscal ratio statistics (70.8 Kb Pdf).
Borrowing
Table 4 summarises revisions between the data contained in this bulletin and the previous publication.
This month’s bulletin reports revisions to public sector net borrowing (excluding public sector banks) (PSNB ex). These revisions are limited to the financial year-to-date (April to September 2015).
Public sector net borrowing (excluding public sector banks)
PSNB ex in the current financial year-to-date (April to September 2015) was revised down by £0.3 billion, largely as a result of a downward revision to central government net borrowing. These net borrowing revisions are solely the result of updated data sources and there are no impacts from methodology changes this month.
Central government borrowing
Over the current financial year-to-date, central government net borrowing (CGNB) has been revised down by £0.2 billion.
Current receipts were revised down by £0.2 billion, with a £0.3 billion reduction to both the estimates of taxes on production and social contributions. This £0.6 billion reduction was partially offset by an increase £0.4 billion to the estimate of income tax.
Current expenditure was revised down by £0.4 billion, largely due to a £0.6 billion decrease in the estimate of “other” current spending, being partially offset by an increase of £0.2 billion to the estimate of net social benefits.
The £0.2 billion decrease in current receipts combined with the £0.4 billion decrease in current expenditure led to a £0.2 billion decrease to the central government current budget deficit estimate.
This decrease in the current account combined with relatively small revisions to the estimate of capital spending (net investment), has resulted in a £0.2 billion decrease to the estimate of net borrowing in the current financial year-to-date.
Local government borrowing
Over the current financial year-to-date, the estimate of local government net borrowing (LGNB) has been decreased by £0.1 billion due to revisions to the estimates of grants between central and local government.
Public corporations borrowing
There have been no substantial revisions to the estimate of public corporation net borrowing (PCNB) over the current financial year-to-date.
Public sector net debt (excluding public sector banks)
Public sector net debt (excluding public sector banks) (PSND ex) at the end of September 2015 has been revised down by £0.4 billion, largely as a result of newly received Network Rail gilt holding information reducing the estimate of gross debt and revised local government data, increasing liquid assets.
For the purposes of UK fiscal policy, net debt is defined as total gross financial liabilities (such as gilts and sterling treasury bills) less liquid financial assets, where liquid assets are cash and short-term assets which can be released for cash at short notice and without significant loss. These liquid assets mainly comprise foreign exchange reserves and bank deposits.
Public sector net cash requirement (excluding public sector banks)
Public sector net cash requirement (excluding public sector banks) (PSNCR ex) in the financial year-to-date to (April to September 2015) has been revised up by £0.1 billion as a result of changes to both the central and local government cash position.
As a result of further quality assurance work, the Department for Communities and Local Government (DCLG) have provided revisions to their estimates of local government cash requirement (LGNCR) from April 2014 onwards. This has resulted in a £0.1 billion increase in LGNCR in the financial year ending March 2015 and a £0.6 billion increase in the current financial year-to-date (April to September 2015).
Newly received cash data from Network Rail has a resulted in a fall in the estimate of central government net cash requirement (CGNCR) of £0.1 billion in each month in the current financial year-to-date (April to September 2015). This £0.5 billion decrease in CGNCR has partially offset the increase in LGNCR in the current financial year-to-date.
Table 4: Revisions between this bulletin and the previous bulletin
| Previous bulletin refers to the PSF bulletin published on 21 October 2015 | ||||||||
| £ billion1 (not seasonally adjusted) | ||||||||
| Period | Net Borrowing | Net Debt | PSNCR ex9 | |||||
| CG2 | LG3 | NFPCs4 | BoE5 | PSNB ex6 | PSND ex7 | PSND % of GDP8 | ||
| 2010/11 | 0.0 | 0.0 | 0.0 | 0.0 | 0.0 | 0.0 | 0.0 | 0.0 |
| 2011/12 | 0.0 | 0.0 | 0.0 | 0.0 | 0.0 | 0.0 | 0.0 | 0.0 |
| 2012/13 | 0.0 | 0.0 | 0.0 | 0.0 | 0.0 | 0.0 | 0.0 | 0.0 |
| 2013/14 | 0.0 | 0.0 | 0.0 | 0.0 | 0.0 | 0.0 | 0.0 | 0.0 |
| 2014/1510 | 0.0 | 0.0 | 0.0 | 0.0 | 0.0 | 0.0 | 0.0 | 0.1 |
| 2015/16 ytd11 | -0.2 | -0.1 | 0.0 | 0.0 | -0.3 | -0.4 | 0.0 | 0.1 |
| 2015 April12 | 0.1 | 0.0 | 0.0 | 0.0 | 0.1 | -0.1 | -0.1 | 0.3 |
| 2015 May12 | 0.0 | -0.2 | 0.0 | 0.0 | -0.1 | -0.1 | 0.0 | 0.0 |
| 2015 June12 | 0.0 | 0.0 | 0.0 | 0.0 | 0.0 | 0.0 | 0.0 | -0.1 |
| 2015 July12 | 0.2 | 0.0 | 0.0 | 0.0 | 0.2 | -0.7 | 0.0 | 0.0 |
| 2015 August12 | -0.2 | 0.0 | 0.0 | 0.0 | -0.2 | -0.9 | 0.0 | -0.4 |
| 2015 September12 | -0.4 | 0.1 | 0.0 | 0.0 | -0.3 | -0.4 | 0.0 | 0.2 |
| Source: Office for National Statistics | ||||||||
| Notes: | ||||||||
| 1. Unless otherwise stated | ||||||||
| 2 .Central Government | ||||||||
| 3. Local Government | ||||||||
| 4. Non-Financial public corporations | ||||||||
| 5. Bank of England | ||||||||
| 6. Public sector net borrowing excluding public sector banks | ||||||||
| 7. Public sector net debt excluding public sector banks | ||||||||
| 8. GDP = Gross Domestic Product | ||||||||
| 9. Public sector cash requirement excluding public sector banks | ||||||||
| 10. 2014/15 represents financial year ending 2015 (April 2014 to March 2015) | ||||||||
| 11. ytd = Year-to-date | ||||||||
| 12. Monthly revisions are in part due to the quarterly practise of aligning the monthly public sector finances with quarterly datasets | ||||||||
Download this table Table 4: Revisions between this bulletin and the previous bulletin
.xls (41.5 kB)To provide users with an insight into the drivers of the historical revisions between publications, this bulletin presents 3 revisions tables;
Table PSA1R complements PSA1 and provides a revisions summary (between the current and previous publication) to headline statistics in this release
Table PSA2R complements PSA2 and provides the revisions (between the current and previous publication) to net borrowing by sector
Table PSA6R complements PSA6B and provides the revisions (between the current and previous publication) to the components of central government net borrowing
Tables PSA1R and PSA6R are published in excel format only in Appendix A to this release.
In addition, Appendix C to this bulletin presents a statistical analysis on several main components of the central government account (current receipts, current expenditure, net borrowing and net cash requirement) to determine whether their average revisions are statistically significant.
Back to table of contents13. New for the bulletin
Recent public sector finance articles
We are currently in the process of updating public sector finance guidance and methodology articles published on our website. Recently we have updated articles covering:
Background for users of Public Sector Finance Statistics (134.3 Kb Pdf)
Methodological Improvements to National Accounts for Blue Book 2015: Classifications
EU Government Deficit and Debt Return
On 16 October 2015, we published the latest EU Government Deficit and Debt Return. In this publication we report that:
General Government Net Borrowing (Maastricht Borrowing) in the financial year ending 2015 (April 2014 to March 2015) was £93.5 billion, equivalent to 5.1% of Gross Domestic Product
General Government Gross Debt (Maastricht Debt) at the end of March 2015 was £1,601 billion, equivalent to 87.5% of Gross Domestic Product
The data used to produce this publication are consistent with those used in the production of the public sector finances statistical bulletin published on 22 September 2015.
The EU Government Deficit and Debt statistical bulletin is published quarterly in January, April, July and October each year, to coincide with when the UK and other European Union member states are required to report on their deficit (or net borrowing) and debt to the European Commission.
It is important to note that the Gross Domestic Product (GDP) measure used as the denominator in the calculation of the debt ratios in the EU Government Deficit and Debt Return differs from that used within the public sector finances statistical bulletin. An article, the use of GDP in fiscal ratio statistics (70.8 Kb Pdf), explains that for debt figures reported in the monthly public sector finances, a 12 month GDP total centred on the month is employed, while in the EU Government Deficit and Debt Return the total GDP for the preceding 12 months is used.
The reconciliation of net cash requirement to debt
The issues and subsequent revisions to CGNCR reported in October 2014 were identified through work undertaken to reconcile the 3 different fiscal measures (that is, net cash requirement, net borrowing and net debt) and to reconcile the central government net cash requirement with cash reported in audited resource accounts.
We are currently building these reconciliation processes into the monthly production systems. The first of these new reconciliations, Table REC3, attempts to reconcile central government net cash requirement and net debt.
Table REC3 is not currently designated a National Statistic and should be considered as a work-in-progress, with plans to introduced further refinements in the coming months.
UK Statistics Authority assessment of public sector finances
Alongside monitoring the production and publication of official statistics, the UK Statistics Authority's statutory function is to prepare, adopt and publish a Code of Practice for Statistics (in consultation with others as appropriate), setting out the standards that the Statistics Authority expects official statistics to meet. The Statistics Authority also determines whether official statistics comply with the Code and, if so, designates them with the quality mark “National Statistics”. The process of determining compliance with the Code and designation as National Statistics is known as “Assessment”.
On 8 October 2015 the UK Statistics Authority published its latest assessment report of public sector finances. The report confirmed the National Statistics status of the public sector finances bulletin subject to certain requirements being met.
Back to table of contents14. List of tables associated with this bulletin
PSA1 Public Sector Summary
PSA2 Public Sector Net Borrowing: by sector
PSA3 Public Sector Current Budget Deficit, Net Borrowing and Net Cash Requirement (excluding public sector banks)
PSA4 Public Sector Net Debt (excluding public sector banks)
PSA5A Long Run of Fiscal Indicators as a percentage of GDP on a financial year basis
PSA5B Long Run of Fiscal Indicators as a percentage of GDP on a quarterly basis*
PSA6A Net Borrowing: month and year-to-date comparisions
PSA6B Central Government Account: Overview
PSA6C Central Government Account: Total Revenue,Total Expenditure and Net Borrowing
PSA6D Central Government Account: Current Receipts
PSA6E Central Government Account: Current Expenditure
PSA6F Central Government Account: Net Investment
PSA6G Local Government Account: Overview*
PSA6H Local Government Account: Total Revenue, Total Expenditure and Net Borrowing*
PSA6I Local Government Account: Current Receipts*
PSA6J Local Government Account: Current Expenditure*
PSA6K Local Government Account: Net Investment*
REC1 Reconciliation of Public Sector Net Borrowing and Net Cash Requirement (excluding banking groups)
REC2 Reconciliation of Central Government Net Borrowing and Net Cash Requirement
PSA7A Public Sector Net Cash Requirement
PSA7B Public Sector Net Cash Requirement*
PSA7C Central Government Net Cash Requirement
PSA7D Central Government Net Cash Requirement on own account (receipts and outlays on a cash basis)
REC3 Reconciliation of Central Government Net Cash Requirement and Debt (Experimental Statistic)
PSA8A General Government Consolidated Gross Debt nominal values at end of period
PSA8B Public Sector Consolidated Gross Debt nominal values at end of period
PSA8C General Government Net Debt nominal values at end of period
PSA8D Public Sector Net Debt nominal values at end of period
PSA9 Bank of England Asset Purchase Facility Fund (APF)PSA10
Public Sector transactions by sub-sector and economic category
PSA1R Public Sector Statistics: Revisions since last publication*
PSA2R Public Sector Net Borrowing: by sector; Revisions since last publication
PSA6R Central Government Account: overview; Revisions since last publication*
These tables are published in Excel format only.
Appendices – Data in this release
Appendix A Public Sector Finances Tables 1 to 10
Appendix B Large impacts on public sector fiscal measures excluding financial intervention (one off events)
Appendix C Revisions Analysis on several main components of the central government account (current receipts, current expenditure, net borrowing and net cash requirement)
The following guidance documents aim to help users gain a detailed understanding of the public sector finances: Monthly statistics on Public Sector Finances: a methodological guide; Developments to Public Sector Finances Statistics and Quality and Methodology Information .
Back to table of contents