Table of contents
- Labour Productivity, Q3 2014
- About this release
- Interpreting these statistics
- General commentary
- Whole economy labour productivity
- Unit labour costs
- Manufacturing labour productivity
- Services labour productivity
- Market sector (experimental statistics) labour productivity
- Regional labour productivity
- Revisions
- Notes on sources
- Background notes
- Methodology
1. Labour Productivity, Q3 2014
- UK Labour Productivity as measured by output per hour increased by 0.6% in the third quarter of 2014 compared with the previous quarter and was 0.3% higher than a year earlier. However, productivity remains about 2% below its level prior to the economic downturn in 2008.
- Output per hour increased in all of the main industrial groupings in the third quarter, by 0.5% in the production industries and 0.6% in the service industries.
- Unit labour costs increased across the whole economy by 0.5% in the third quarter, reflecting a sharp increase in labour costs per hour worked.
- This edition contains new estimates of regional productivity to 2013. These estimates show that productivity is above the UK average in London and the South East, and well below the UK average in Wales and Northern Ireland.
2. About this release
This release reports labour productivity statistics for the third quarter of 2014 for the whole economy and a range of industries, together with selected data on unit labour costs. Labour productivity measures the amount of real (inflation-adjusted) economic output that is produced by a unit of labour input (in terms of workers, jobs and hours worked) and is a key indicator of economic performance. Since labour costs account for around two-thirds of the cost of production of UK economic output, unit labour costs provide an indication of inflationary pressures in the economy.
Output statistics in this release are consistent with the latest Quarterly National Accounts published on 23 December 2014. Labour input measures are consistent with the latest Labour Market Statistics as described further in the 'General commentary' and 'Notes on sources' sections below.
Back to table of contents3. Interpreting these statistics
Whole economy output (gross value added – GVA) increased by 0.8% in the third quarter of 2014, while the Labour Force Survey (LFS) shows that the number of workers, jobs and hours increased by 0.4%, 0.3% and 0.1% respectively over this period1. Since growth of labour productivity can be decomposed as growth of GVA minus growth of labour input, this combination of movements in output, workers, jobs and hours implies that UK labour productivity increased by 0.4% in terms of output per worker and output per job, and by 0.6% in terms of output per hour2.
Differences between growth of output per worker and output per job reflect changes in the ratio of jobs to workers. This ratio was unchanged in Q3. Differences between these measures and output per hour reflect movements in average hours which, though typically not large from quarter to quarter, can be material over a period of time. For example, a shift towards part-time employment will tend to reduce average hours. For this reason, output per hour is a more comprehensive indicator of labour productivity and is the main focus of the commentary in this release.
Unit labour costs (ULCs) reflect the full labour costs, including social security and employers’ pension contributions, incurred in the production of a unit of economic output, while unit wage costs (UWCs) are a narrower measure, excluding non-wage labour costs3. Growth rates of these series can be decomposed as growth of labour costs per unit of labour input minus growth of labour productivity. For example, with labour productivity increasing by 0.6% on an output per hour basis in the third quarter, the 0.5% increase in ULCs implies that labour costs per hour increased by 1.1% across the economy as a whole. In the manufacturing sector, the combination of output per hour growth of 0.6% and no change in unit wage costs implies an increase in manufacturing wage costs per hour of around 0.6% over the quarter.
Most of the series in this release are designated as National Statistics, meaning their production has been subject to rigorous quality assurance and methodological scrutiny. However, some service industry estimates use component series from the Index of Services (IOS) which are designated as experimental statistics (that is, not yet accredited as National Statistics, for example because the methodology is under development or reflecting concerns over data sources). Labour productivity estimates that use these series as their numerators are also labelled as experimental statistics. Market sector productivity estimates are also experimental series. More information on the experimental IOS series is available on the Guidance and methodology section of the ONS website.
Notes for interpreting these statistics
- The growth rate of GVA in Q3 differs slightly from the growth rate of GDP (0.7%). Growth rates for whole economy workers, jobs and hours shown in Table 10 may differ slightly from growth rates based on LFS aggregate estimates due to different methods of seasonal adjustment.
- Slight differences between published and implied growth rates of productivity are due to rounding.
- Both measures include labour costs of the self-employed.
4. General commentary
Figure 1 shows cumulative contributions to growth of output per hour since 2008 by broad industry. The height of each bar reflects labour productivity movements in that industry and the industry weight, which in turn is a function of its weight in hours worked and output1. In Q3 2014, whole economy output per hour was 1.8% lower than in Q1 2008. This is approximately 16% lower than had productivity maintained its pre-downturn trend.
Figure 1: Cumulative contributions to quarter on quarter growth of whole economy output per hour
Seasonally adjusted
Source: Office for National Statistics
Notes:
- ABDE refers to Agriculture, Forestry and Fishing (section A), Mining and Quarrying (section B), Electricity, Gas, Steam and Air Conditioning Supply (section D) and Water Supply, Sewerage, Waste Management and Remediation Activities (section E).
Download this chart Figure 1: Cumulative contributions to quarter on quarter growth of whole economy output per hour
Image .csv .xlsFigure 1 highlights the negative contribution to productivity of the ABDE industry aggregate and, to a lesser extent, Financial Services.
Notes for general commentary
- The decomposition is exact for periods over which the National Accounts have been balanced through the supply-use framework, that is to 2012. Small inconsistencies arise from Q1 2013 because the GVA weights are currently fixed for these periods.
5. Whole economy labour productivity
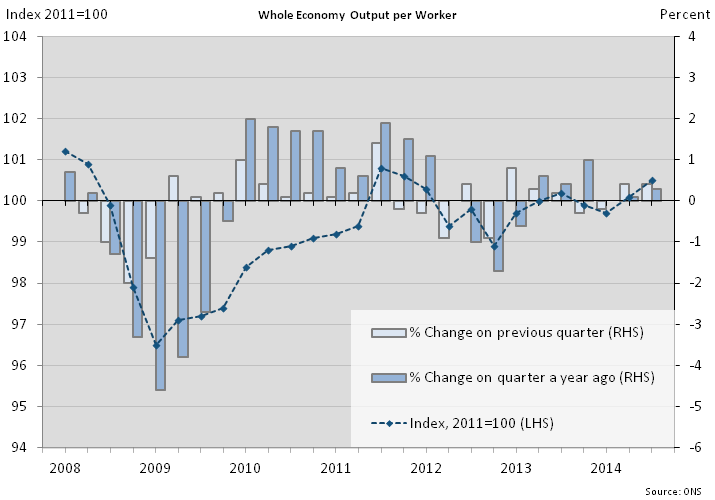
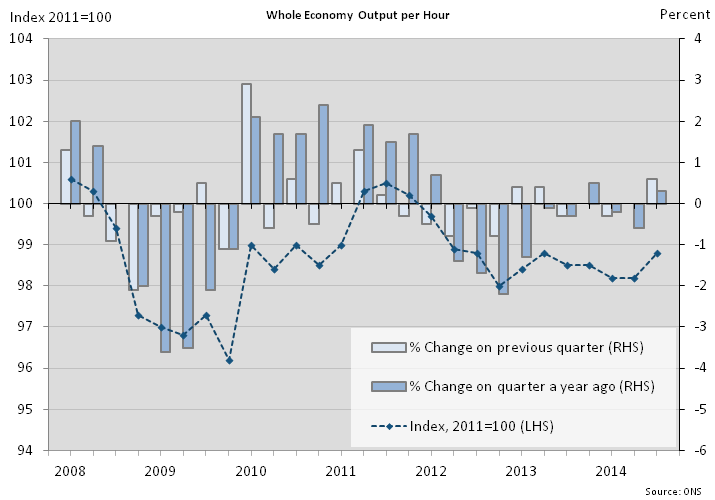
Figure 2 shows whole economy output per worker in terms of index levels and percentage changes. Figure 3 shows whole economy output per hour, and Figure 4 provides a breakdown of the components of labour productivity over recent quarters. Figure 4 shows that hours worked have increased faster than jobs since 2011, implying that average hours per job have increased. This is consistent with the weaker path of output per hour compared with output per worker shown in Figures 2 and 3. More information is available in Reference Table LPROD01 (356.5 Kb Excel sheet) and in the tables at the end of the PDF version of this statistical bulletin.
Figure 2: Whole economy output per worker
Seasonally Adjusted
Source: Office for National Statistics
Download this image Figure 2: Whole economy output per worker
.png (35.6 kB) .xls (7.2 MB)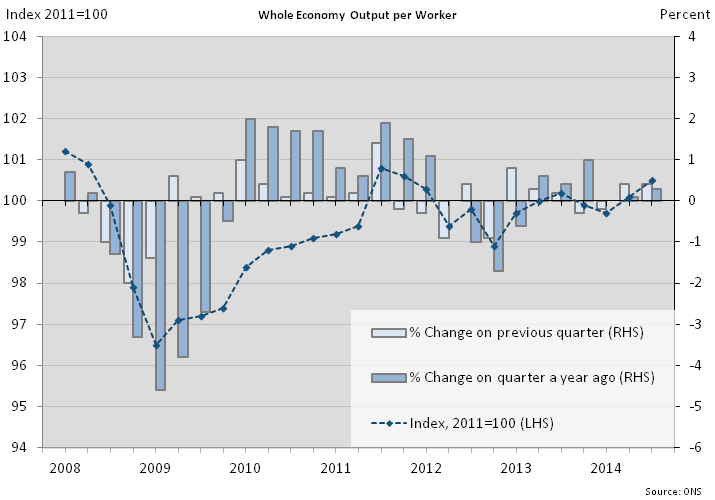
Figure 3: Whole economy output per hour
Seasonally Adjusted
Source: Office for National Statistics
Download this image Figure 3: Whole economy output per hour
.png (34.6 kB) .xls (7.2 MB)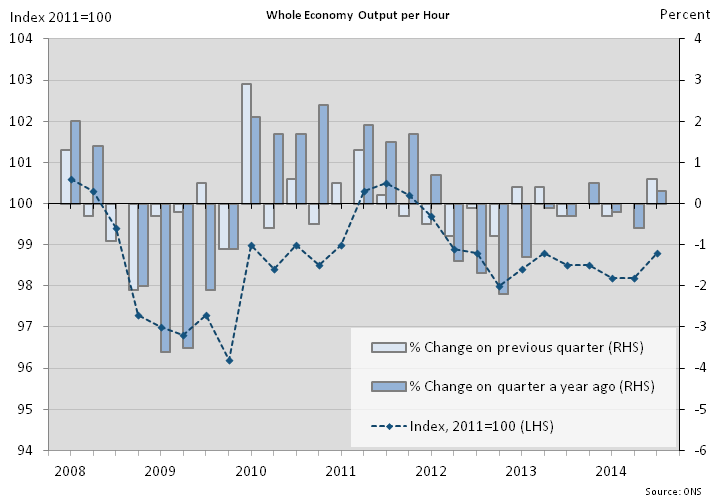
Figure 4: Whole economy labour productivity components
Seasonally Adjusted
Source: Office for National Statistics
Download this chart Figure 4: Whole economy labour productivity components
Image .csv .xls6. Unit labour costs
Figure 5 shows whole economy ULCs in terms of index levels and percentage changes on the previous quarter and on the previous year. In Q3, ULCs increased by 0.5% on the previous quarter but the year-on-year increase was more subdued (0.2%).
Figure 5: Whole economy unit labour costs
Seasonally Adjusted
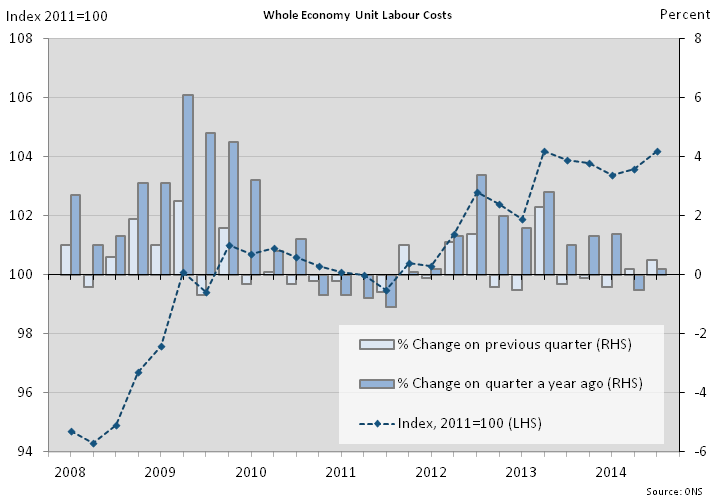
Source: Office for National Statistics
Download this image Figure 5: Whole economy unit labour costs
.png (34.1 kB) .xls (7.2 MB)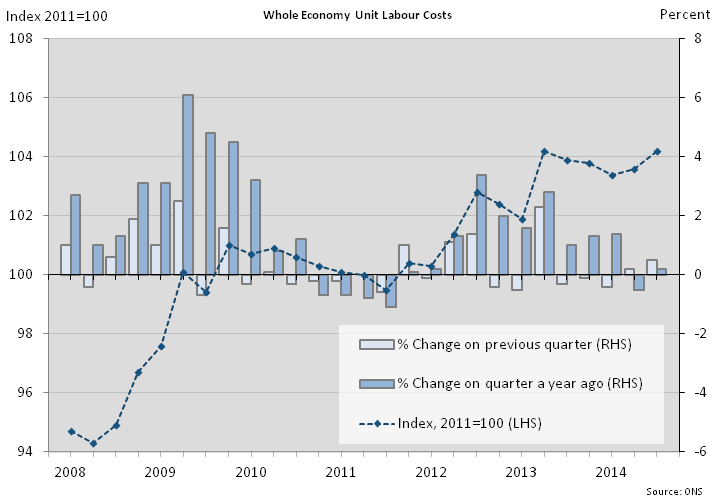
Manufacturing unit wage costs (Figure 6) were unchanged in Q3 compared with the previous quarter and 1.0% lower than a year earlier. As well as being a narrower measure than unit labour costs, the manufacturing unit wage cost series currently uses average weekly earnings in manufacturing (a measure of employee earnings) to proxy the earnings of self-employed workers in manufacturing, which is inconsistent with other ONS data on incomes of the self employed. Subject to this proviso, the robust increase in manufacturing output per hour in the year to Q3 (5.2%) implies that manufacturing wage costs per hour have also increased significantly, by around 4%.
Figure 6: Manufacturing unit wage costs
Seasonally Adjusted

Source: Office for National Statistics
Download this image Figure 6: Manufacturing unit wage costs
.png (35.1 kB) .xls (7.2 MB)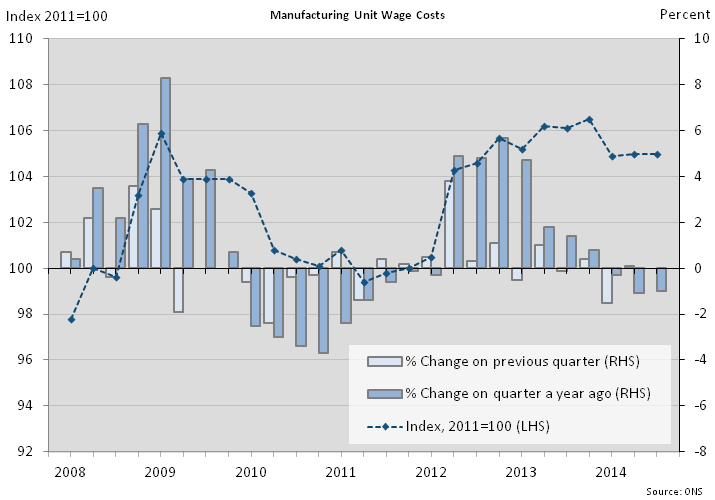
ONS published proposals for replacing manufacturing UWCs with a broader and more consistently derived measure of manufacturing ULCs in an article 'Sectional unit labour costs' on 28 November 2012.
More information on unit labour costs and unit wage costs is available in Table 2 of Reference Table LPROD01 (356.5 Kb Excel sheet) , and in the tables at the end of the PDF version of this statistical bulletin.
Back to table of contents7. Manufacturing labour productivity
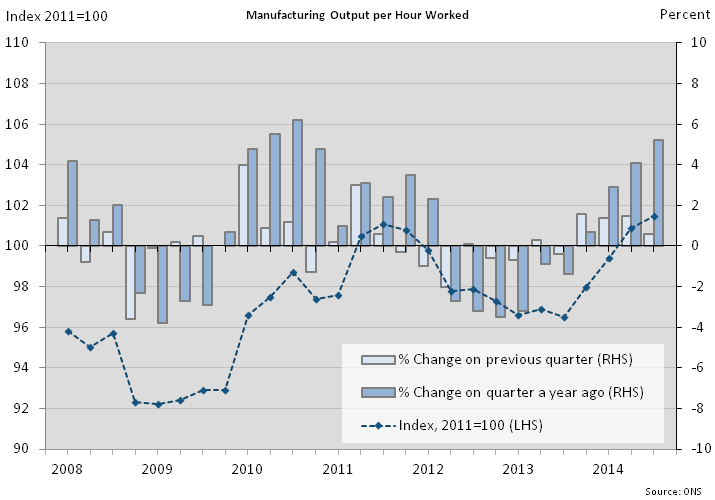
Figures 7 (output per job) and 8 (output per hour) show movements in labour productivity in manufacturing in terms of levels and percentage changes on the previous quarter and on the previous year. Manufacturing output per hour has increased in each of the latest four quarters and was 5.2% higher than a year earlier in Q3, the fastest rate of increase since 2010. Figure 9 provides information on the component movements in manufacturing output and labour inputs, showing that growth of labour inputs into manufacturing has been much more subdued than across the whole economy. In particular, hours worked in manufacturing have fallen in each of the latest two quarters, although the number of manufacturing jobs has increased.
Figure 7: Manufacturing output per job
Seasonally Adjusted
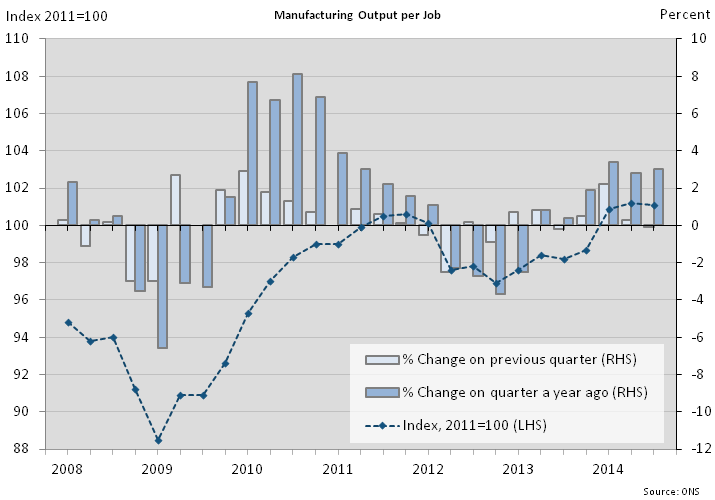
Source: Office for National Statistics
Download this image Figure 7: Manufacturing output per job
.png (34.5 kB) .xls (7.2 MB)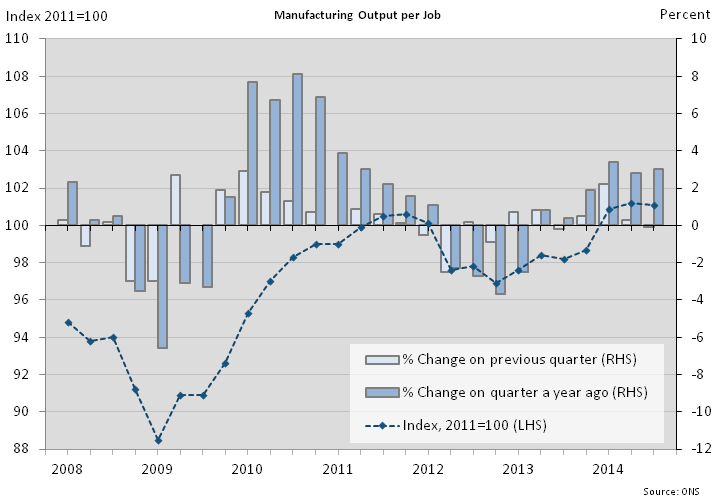
Figure 8: Manufacturing output per hour worked
Seasonally Adjusted
Source: Office for National Statistics
Download this image Figure 8: Manufacturing output per hour worked
.png (34.9 kB) .xls (7.2 MB)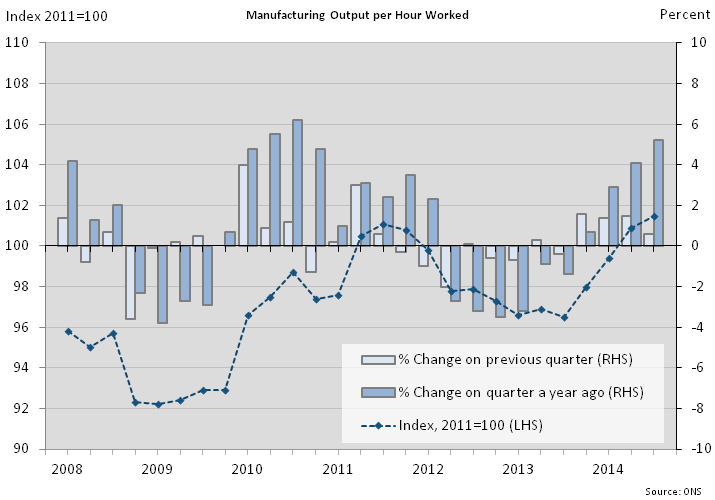
Figure 9: Components of manufacturing productivity measures
Seasonally adjusted
Source: Office for National Statistics
Download this chart Figure 9: Components of manufacturing productivity measures
Image .csv .xlsFigure 10 shows the cumulative contributions to growth of manufacturing output per hour since 2008. This analysis highlights the large negative contribution to productivity of industries 20-21 (Chemicals and Pharmaceuticals), particularly since 2010. By contrast, industries 26-30 (Equipment industries) have made strongly positive contributions to productivity growth since 2010.
Figure 10: Cumulative contributions to quarter on quarter growth of manufacturing output per hour
Seasonally adjusted
Source: Office for National Statistics
Notes:
- 10-19 refers to Food products, beverages and tobacco (10-12), Textiles, wearing apparel & leather (13-15), Wood & paper products & printing (16-18) and Coke & refined petroleum products (19). 31-33 refers to Other Manufacturing.
- 20-21 refers to Chemical and Pharmaceutical products.
- 22-25 refers to Rubber, plastics & other non-metallic minerals (22-23), Basic metals and metal products (24-25).
- 26-30 refers to Computer products, Electrical equipment (26-27), Machinery & equipment (28) and Transport equipment (29-30).
Download this chart Figure 10: Cumulative contributions to quarter on quarter growth of manufacturing output per hour
Image .csv .xlsMore information on labour productivity of sub-divisions of manufacturing is available in Reference Table LPROD01 (356.5 Kb Excel sheet) (Tables 3 and 4), and in the tables at the end of the PDF version of this statistical bulletin. Care should be taken in interpreting quarter on quarter movements in productivity estimates for individual sub-divisions, as small sample sizes of the source data can cause volatility.
Tables 3 and 4 include annual estimates for the level of productivity in £ terms for the National Accounts base year of 2011. These are estimates of GVA per unit of labour input and are not necessarily related to pay rates. Output per job (Table 3) varied from £39.3k in Wood and paper products (divisions 16-18) to £134.4k in Chemicals & Pharmaceuticals (divisions 20-21). The average for the whole of manufacturing was £57.5k and the average for the whole economy was £47.2k in 2011.
Chemicals & Pharmaceuticals was also top of the distribution for output per hour in 2011 (£75.2), with Wood, paper products, & printing (divisions 16-18) and Basic metals & metal products (divisions 24-25) at the bottom of the distribution. On this basis the average for manufacturing as a whole was £31.1 and the average for the whole economy was £30.0 per hour.
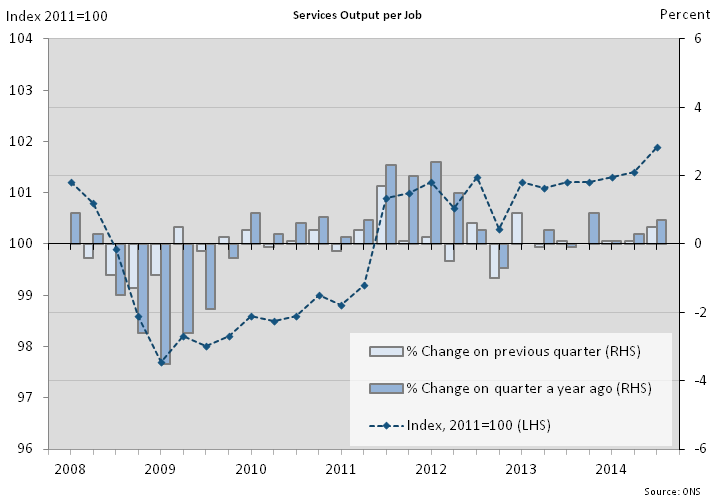
Back to table of contents8. Services labour productivity
Figures 11 (output per job) and 12 (output per hour) show movements in labour productivity in services in terms of index levels and percentage changes on the previous quarter and on the previous year. Figure 13 provides information on the component movements in services output and labour inputs. In contrast to manufacturing, labour inputs into the service industries have grown more or less in line with output since 2011, and productivity growth has accordingly been more muted.
Figure 11: Services output per job
Seasonally Adjusted
Source: Office for National Statistics
Download this image Figure 11: Services output per job
.png (32.3 kB) .xls (7.2 MB)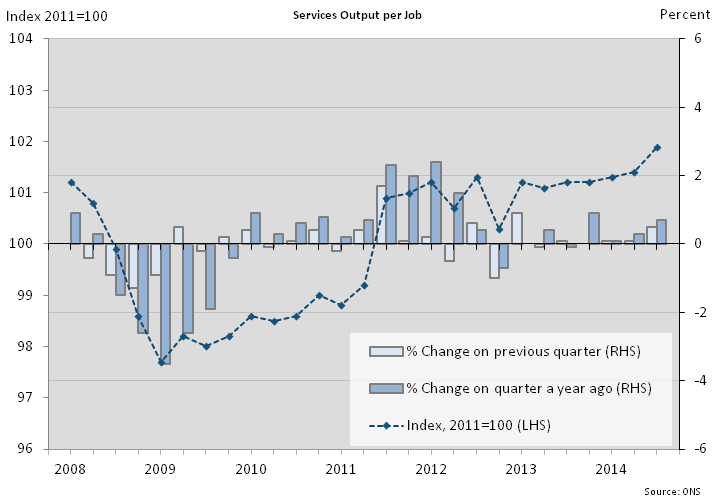
Figure 13: Components of services productivity measures
Seasonally Adjusted
Source: Office for National Statistics
Download this chart Figure 13: Components of services productivity measures
Image .csv .xlsFigure 14 shows the cumulative contributions to growth of services output per hour since the economic downturn. From the beginning of 2008 to the third quarter of 2014, industries O-Q (Government services) and industry K (Financial and insurance activities) have made the largest negative contributions to services output per hour. In the case of O-Q the negative contribution mainly reflects hours rising faster than output, particularly over the period 2008-11. In the case of K, the negative contribution mainly reflects falling output over the whole period since 2008, not matched by falls in hours worked.
Industry L (Real estate activities) has made the largest positive contribution to services output per hour since 2008. This mainly reflects growth of imputed value-added from owner-occupied housing, for which there is no corresponding labour input.
Figure 14: Cumulative contributions to quarter on quarter growth of services output per hour
Seasonally Adjusted
Source: Office for National Statistics
Notes:
- G,H,I refers to Wholesale and retail trade; repair of motor vehicles and motorcycles (G), Transportation and storage (H) and Accommodation and food service activities (I)
- J refers to Information and communication
- K refers to Financial and insurance activities
- L refers to Real Estate activities
- M,N refers to Professional, scientific and technical activities (M), Administrative and support service activities (N)
- O,P,Q refers to Government Services
- R,S,T,U refers to Other Services
Download this chart Figure 14: Cumulative contributions to quarter on quarter growth of services output per hour
Image .csv .xlsMore information on labour productivity of services industries is available in Tables 5 and 6 in Reference Table LPROD01 (356.5 Kb Excel sheet) and in the tables at the end of the PDF version of this statistical bulletin.
In general, the dispersion of labour productivity growth rates across service industries is less pronounced than within manufacturing. At face value, the dispersion of productivity levels is more pronounced. However, it should be borne in mind that labour productivity in industry L is affected by the National Accounts concept of output from owner-occupied housing, which adds to the numerator but without a corresponding component in the denominator. Excluding this industry, output per job in 2011 varied from £21.6k in Accommodation & food services (section I) to £106.2k in Finance & insurance (section K). These industries were also at the bottom and top of the productivity distribution in terms of output per hour (Table 6).
Back to table of contents9. Market sector (experimental statistics) labour productivity
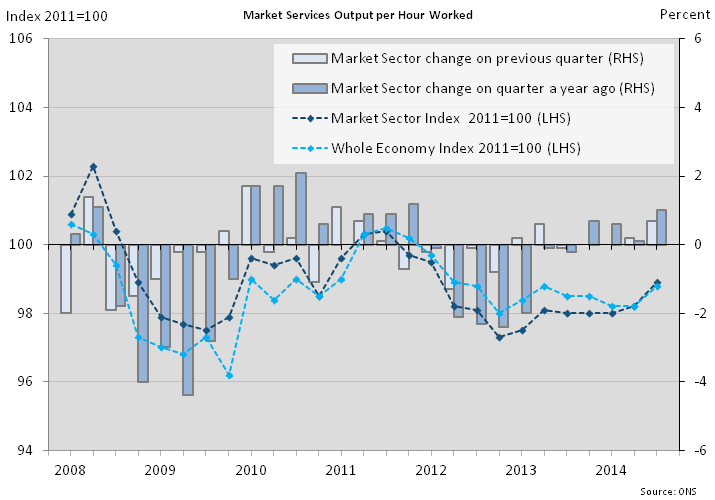
Figure 15 shows movements in output per hour in the market sector with the whole economy series from Figure 3 plotted for comparison purposes. Market sector productivity fell more steeply than whole economy productivity during 2011 and 2012. However, between Q4 2012 and Q3 2014, market sector output per hour increased by 1.6% compared with an increase of 0.8% for the whole economy measure.
Figure 15: Market sector output per hour
Seasonally Adjusted
Source: Office for National Statistics
Download this image Figure 15: Market sector output per hour
.png (42.8 kB) .xls (7.2 MB)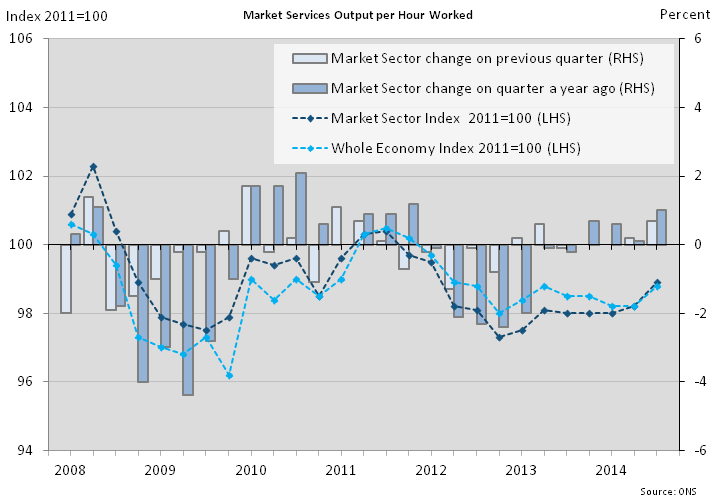
Longer time series on market sector labour productivity are available in Table 7 of Reference Table LPROD01 (356.5 Kb Excel sheet) and in the tables at the end of the PDF version of this statistical bulletin.
Back to table of contents10. Regional labour productivity
This section uses regional estimates of nominal GVA (NGVA) up to 2013, consistent with the ONS regional GVA release on 10 December 2014. The estimates in Table 9 of Reference Table LPROD01 (356.5 Kb Excel sheet) and in the tables at the end of the PDF version of this statistical bulletin indicate the relative value of economic output per job and per hour across the NUTS1 regions, indexed to the UK=100. In interpreting these statistics it should be borne in mind that they do not take account of price differences across regions (e.g. in housing costs) and should not therefore be interpreted as measures of relative living standards.
NGVA data have been revised up in all regions and in all time periods, reflecting an extensive program of changes to the National Accounts implemented with Blue Book 2014. These changes in turn reflect the adoption of a new accounting standard (ESA10) in addition to the normal Blue Book processes of balancing, benchmarking to administrative data, updating of weights etc. ONS has published a number of articles describing these changes, available here. Although regional GVA estimates have increased for all regions, the rate of increase is not uniform. London saw the smallest increases in GVA over the revision period, while some regions, such as Northern Ireland, display proportionately larger upward revisions to NGVA compared to data prior to Blue Book 2014.
Regional jobs and hours estimates have also been revised from 2001 to reflect updated LFS weights arising from the 2011 Census. The impact of these revisions is fairly uniform across the regions.
Figure 16 shows that, of the NUTS1 regions, only in London and the South East is NGVA per job above the UK average, although this is sufficient for England as a whole to be fractionally above average. NGVA per job was close to the UK average in 2013 in the East of England and in Scotland. In all other regions, NGVA per job was at least 10% lower than the UK average in 2013.
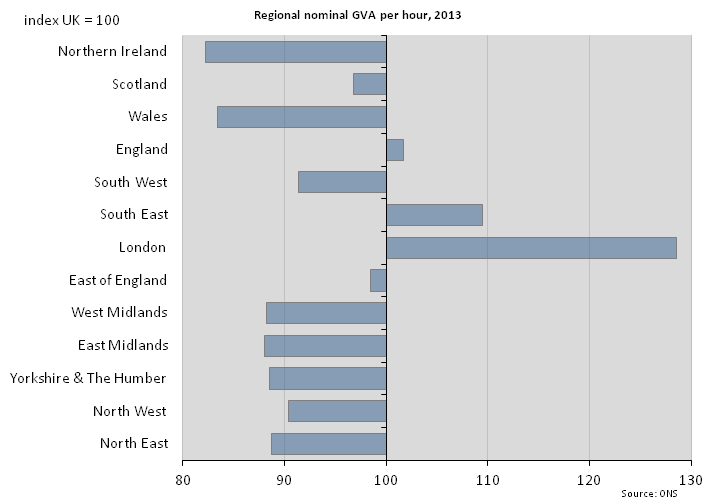
A broadly similar pattern obtains for NGVA per hour (Figure 17), although the margin by which London exceeds the UK average is significantly smaller, and Wales and Northern Ireland exchange places at the bottom of the productivity distribution. Differences between Figures 16 and 17 reflect differences in average hours worked across the regions. In 2013, average hours worked were highest in London and lowest in the South West.
Regional productivity differentials have been fairly stable over time, although there is some faint evidence that London's productivity advantage is narrowing a little, and that productivity in Scotland is closing in on the UK average.
Figure 16: Regional nominal GVA per job, 2013
United Kingdom: NUTS1 regions

Source: Office for National Statistics
Download this image Figure 16: Regional nominal GVA per job, 2013
.png (26.0 kB) .xls (54.3 kB)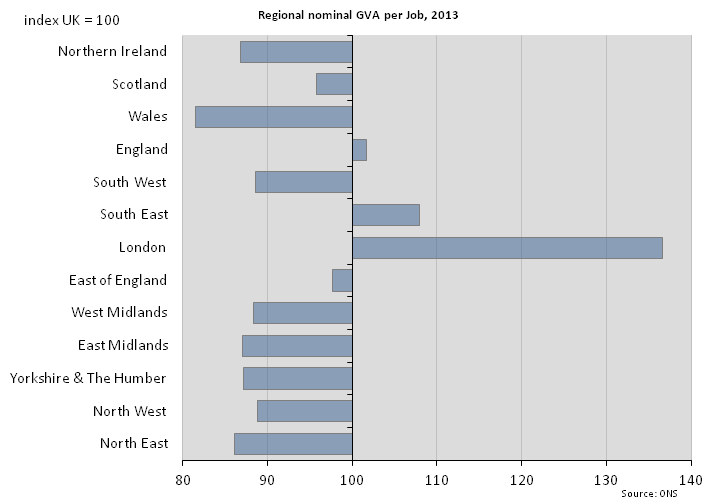
Figure 17: Regional nominal GVA per hour, 2013
United Kingdom: NUTS1 regions
Source: Office for National Statistics
Download this image Figure 17: Regional nominal GVA per hour, 2013
.png (25.5 kB) .xls (54.3 kB)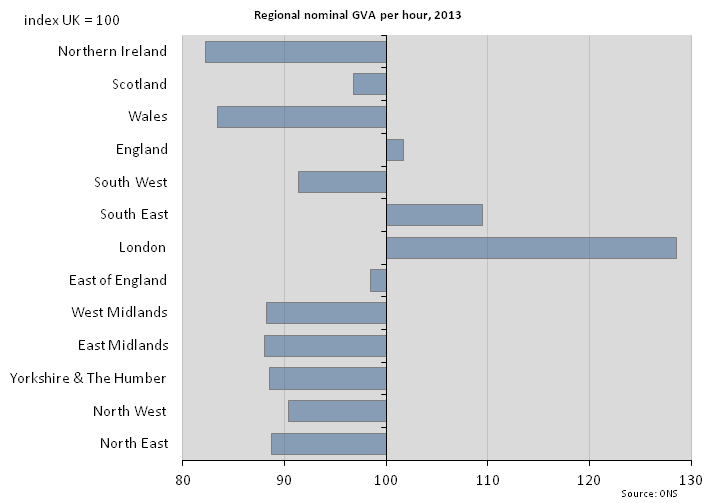
On 18 December 2014 ONS published experimental statistics on real (inflation adjusted) GVA by region, constrained to UK totals for the years 1998-2012. For 2012, the distribution of productivity shown in Table 9 would generally be very similar using these real GVA estimates as the numerators rather than NGVA.
Back to table of contents