Table of contents
- Labour Productivity, Q1 (Jan to Mar) 2015
- About this release
- Interpreting these statistics
- General commentary
- Whole economy labour productivity measures
- Manufacturing labour productivity measures
- Services labour productivity measures
- Industry spotlight - information and communication services industry
- Revisions
- Notes on sources
- Background notes
- Methodology
1. Labour Productivity, Q1 (Jan to Mar) 2015
- UK labour productivity as measured by output per hour grew by 0.3% in the first quarter of 2015 compared with the previous quarter. This measure is 1.3% higher than the same period in 2014, the fastest annual growth since Q1 2012.
- Whole economy unit labour costs decreased by 0.6% on the quarter and were 0.9% higher than a year ago. Growth of labour costs per hour remains subdued.
- Output per hour in the manufacturing and production sectors fell on the quarter and on the year.
- Output per hour grew in the services sector, though estimates of individual service industries were more mixed.
- New for this release is an Industry Spotlight section, focusing on productivity in Information and communication services. This shows a pronounced slowdown in productivity in telecommunications services in recent years, after very strong growth prior to the economic downturn.
2. About this release
This release reports labour productivity estimates for the first quarter (Jan to Mar) of 2015 for the whole economy and a range of sub-industries, together with selected estimates of unit labour costs. Labour productivity measures the amount of real (inflation-adjusted) economic output that is produced by a unit of labour input (measured in this release in terms of workers, jobs and hours worked) and is an important indicator of economic performance.
Labour costs make up around two-thirds of the overall cost of production of UK economic output. Unit labour costs are therefore a closely watched indicator of inflationary pressures in the economy.
Output statistics in this release are consistent with the latest Quarterly National Accounts published on 30 June 2015. Labour input measures are consistent with the latest Labour Market Statistics as described further in the 'General commentary' and 'Notes on sources' sections below.
New for this release is an Industry Spotlight section, focusing on productivity in Information and communication services. New seasonal adjustment factors have altered the quarterly path of hours worked and improved the short-term tracking of output per hour. Further information is provided in the Revisions section below.
Back to table of contents3. Interpreting these statistics
Whole economy output (measured by gross value added - GVA) increased by 0.4% in the first quarter of 2015, while the Labour Force Survey (LFS) shows that the number of workers, jobs and hours increased by 0.7%, 0.6% and 0.1% respectively over this period1. This combination of movements in outputs and labour inputs implies that labour productivity across the whole economy fell a little in terms of output per worker and output per job but increased a little in terms of output per hour.
Differences between growth of output per worker and output per job reflect changes in the ratio of jobs to workers. This ratio fell very slightly in Q1. Differences between these measures and output per hour reflect movements in average hours per job and per worker which, though typically not large from quarter to quarter, can be material over a period of time. For example, a shift towards part-time employment will tend to reduce average hours. For this reason, output per hour is a more comprehensive indicator of labour productivity and is the main focus of the commentary in this release.
Labour productivity equation

This equation explains how Labour Productivity is calculated and how it can be derived using growth rates for GVA and labour inputs.
Unit labour costs (ULCs) reflect the full labour costs, including social security and employers’ pension contributions, incurred in the production of a unit of economic output, while unit wage costs (UWCs) are a narrower measure, excluding non-wage labour costs. Growth of ULCs can be decomposed as:
ULC equation

This equation explains how ULCs are calculated and how it can be derived from growth of labour costs per unit of labour (such as labour costs per hour worked) and growth of labour productivity.
In the first quarter, whole economy output per hour grew by 0.3% and ULCs fell by 0.6%. Plugging these values into the ULC equation and re-arranging yields an implied fall of approximately 0.3% in labour costs per hour. This implied movement differs from other ONS information on labour remuneration such as Average Weekly Earnings (AWE) and Indices of Labour Costs per Hour (ILCH), chiefly because the labour cost component includes estimated remuneration of self-employed labour, which is not included in AWE and ILCH.
Most of the series in this release are designated as National Statistics, meaning their production has been subject to rigorous quality assurance and methodological scrutiny. However, some service industry estimates use component series from the Index of Services (IOS) which are designated as experimental statistics (that is, not yet accredited as National Statistics, for example because the methodology is under development or reflecting concerns over data sources). Labour productivity estimates that use these series as their numerators are also labelled as experimental statistics. Market sector productivity estimates are also experimental series. More information on the experimental IOS series is available on the Guidance and methodology section of the ONS website.
Notes for interpreting these statistics
- Growth rates for whole economy workers, jobs and hours shown in Table 10 of this release may differ slightly from growth rates based on LFS aggregate estimates due to different methods of seasonal adjustment.
4. General commentary
Productivity estimates are derived from estimates of labour inputs and economic outputs which are measured largely independently of one another. The buoyancy of the labour market has surprised many commentators and showed little sign of slowing in the first quarter. The number of recorded jobs grew by 2.4% in 2014, the fastest rate since 1989 and equivalent to average increases of 184 thousand jobs per quarter, while an additional 183 thousand jobs were added in the first quarter of 20151. Within these broad totals, full-time jobs have been increasing faster than part-time jobs, and employee jobs have increased faster than self-employment. Indeed, LFS estimates show that self-employment fell by 1.5% in the year to the first quarter.
The resilience of jobs in manufacturing is noteworthy. Over the 30 years prior to the economic downturn in 2008-09, the number of manufacturing jobs fell by around 3% per year on average, as the economy re-orientated itself towards the service sector and large swathes of manufacturing production moved overseas. Over the 4 years 2011-14, jobs in manufacturing declined, but by only 0.3% per year on average or around a tenth of the pre-downturn trend.
Across the whole economy, average hours worked per job increased between 2010 and 2013 and have been fairly flat since then at around 31 hours per week, a level last seen in 2007. The increase in average hours has been particularly pronounced in construction, where average hours worked in 2014 was the highest since 2002 and around 2 hours a week higher than in 2012. Average hours worked have also increased in manufacturing, and this combined with very low rates of job losses noted above means that hours worked in manufacturing have been more or less flat since Q1 2009, following decades of declines.
UK economic output is estimated to have increased at an average rate of around 0.7% per quarter since the start of 2013. Output of the production industries has grown a little below the whole economy figure, and output of market services has grown a little faster.
Figure 1: Cumulative contributions to quarter on quarter growth of whole economy output per hour
Seasonally adjusted, UK, quarter 1 (Jan to Mar) 2008 to quarter 1 (Jan to Mar) 2015
Source: Office for National Statistics
Notes:
- ABDE refers to Agriculture, Forestry and Fishing (section A), Mining and Quarrying (section B), Electricity, Gas, Steam and Air Conditioning Supply (section D) and Water Supply, Sewerage, Waste Management and Remediation Activities (section E)
Download this chart Figure 1: Cumulative contributions to quarter on quarter growth of whole economy output per hour
Image .csv .xlsThe impact of measured movements in hours worked and economic output on productivity is summarised in Figure 1, which de-composes movements in output per hour since Q1 2008 in terms of cumulative quarterly changes. Output per hour was around 1% lower in Q1 2015 than in Q1 2008. This is entirely accounted for by industries ABDE (non-manufacturing production and agriculture) and by financial services.
The weakness of productivity in these sectors (which can to some extent be rationalised in terms of resource depletion in the oil and gas extraction industry and increased regulation in financial services) should not detract from what is otherwise exceptionally weak productivity in other industries. Output per hour in services other than financial services has grown by around 0.2% per quarter since the bottom of the economic downturn in Q1 2009, compared with trend productivity growth of around 0.5% per quarter prior to the downturn. And output per hour in manufacturing has expanded at an average quarterly rate of around 0.3% since Q1 2009, compared with almost 1% per quarter prior to the downturn.
Figure 2: Whole economy year on year changes to unit labour costs
Seasonally adjusted, UK, quarter 1 (Jan to Mar) 2008 to quarter 1 (Jan to Mar) 2015
Source: Office for National Statistics
Download this chart Figure 2: Whole economy year on year changes to unit labour costs
Image .csv .xlsFigure 2 shows the progression of ULC changes since Q1 2008, with each period representing growth on the quarter from the prior year. The bars represent the decomposition of ULC changes into changes in total labour costs per hour and changes in output per hour, which has been reversed so a negative bar represents positive productivity growth.
The growth of unit labour costs at the whole economy level remains subdued, as the upturn in growth of labour remuneration per hour (broader than, but correlated with, conventional measures of labour earnings such as average weekly earnings (AWE)) has broadly matched the gradual acceleration of labour productivity noted above. More recent data for the three months Feb-Apr 2015 indicate a further pick-up in AWE, but it is too early to say whether this will convert either into the broad labour remuneration concept used in compiling ULCs, or indeed whether this upturn could herald an upturn in productivity growth.
Figure 3: Unit labour costs by broad industry
UK, 1997 to 2014
Source: Office for National Statistics
Download this chart Figure 3: Unit labour costs by broad industry
Image .csv .xlsFigure 3 shows trends in ULCs by broad industry, based on experimental estimates available in a Reference Table (261.5 Kb Excel sheet) component of this release. Note that the manufacturing ULC series shown in Figure 3 differs in coverage and methodology from the manufacturing unit wage cost series shown in Table 2 of the pdf version of this release. Variation in ULC evolution by industry mainly reflects variation in productivity trends, as movements in labour remuneration tend to be closely correlated across industries. For example, since 2008 hourly labour remuneration has grown by around 2% per year in manufacturing and the broader production industries. Yet ULCs have grown faster in the production industries than in manufacturing, reflecting weak productivity in the non-manufacturing components.
Notes for general commentary
- Employment growth in 2014 is likely to be revised up slightly when new population estimates are incorporated into the LFS estimates in early 2016.
5. Whole economy labour productivity measures
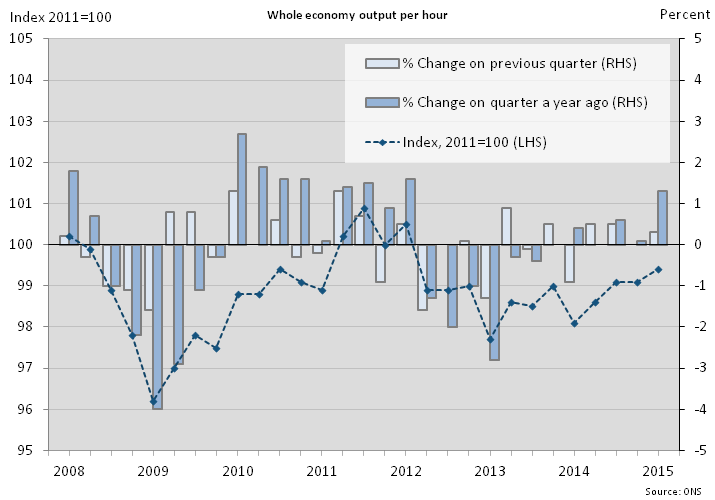
The whole economy output per hour estimate for Q1 2015 continued a gradual upward trend, with an increase on the year and on the quarter (shown in figure 4). Output per hour is still below its Q1 2008 level and its post crisis peak in Q3 2011.
Figure 4: Whole economy output per hour
Seasonally adjusted, UK, quarter 1 (Jan to Mar) 2008 to quarter 1 (Jan to Mar) 2015
Source: Office for National Statistics
Download this image Figure 4: Whole economy output per hour
.png (36.4 kB) .xls (7.1 MB)
Productivity growth is stronger when considered on an output per job basis. This difference suggests those who are employed are working longer hours and this is reflected in the strong growth of hours relative to jobs and output since mid-2011 (see figure 5), though the difference has narrowed slightly in the latest quarter.
Figure 5: Whole economy labour productivity components
Seasonally adjusted, UK, quarter 1 (Jan to Mar) 2008 to quarter 1 (Jan to Mar) 2015
Source: Office for National Statistics
Download this chart Figure 5: Whole economy labour productivity components
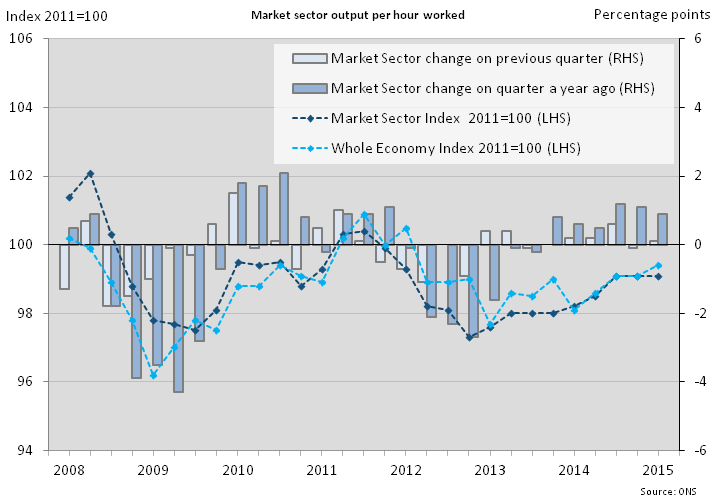
Image .csv .xlsQuarter on quarter growth in market sector output per worker (not a National Statistic) has lagged that of the whole economy for the past two years. Yet the measure has grown faster than market sector output per hour (also not a National Statistic), suggesting that the market sector is following the same trend as the whole economy with workers putting in more hours.
On a per hour basis, market sector productivity has more closely tracked that of the whole economy over the past year (see figure 6).
Figure 6: Market sector output per hour
Seasonally adjusted, UK, quarter 1 (Jan to Mar) 2008 to quarter 1 (Jan to Mar) 2015
Source: Office for National Statistics
Download this image Figure 6: Market sector output per hour
.png (42.4 kB) .xls (7.1 MB)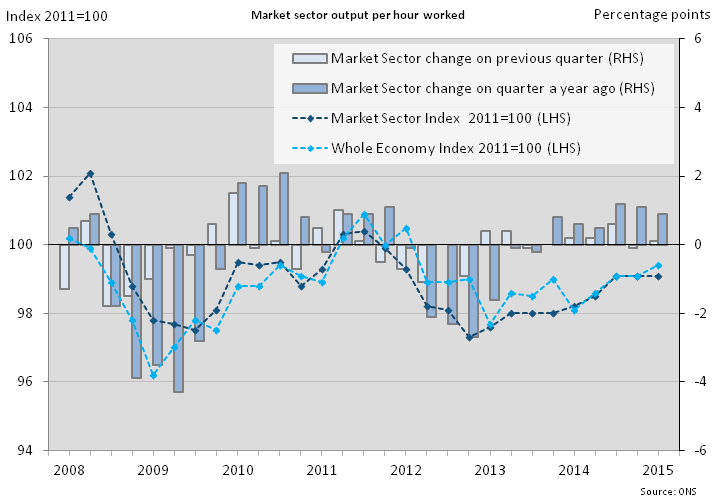
More information is available in Reference Table LPROD01 (362 Kb Excel sheet) and in the tables at the end of the pdf version of this statistical bulletin.
Back to table of contents6. Manufacturing labour productivity measures
Manufacturing output per hour has fallen 0.8% in Q1 2015 compared to a year earlier as most industry groups (with the exception of the chemical and pharmaceutical industry, group 20-21) have moved from a positive productivity performance to a negative one (see figure 7).
Figure 7: Contributions to growth of manufacturing output per hour
Seasonally adjusted, UK, quarter 1 (Jan to Mar) 2008 to quarter 1 (Jan to Mar) 2015
Source: Office for National Statistics
Notes:
- 10-19 refers to Food products, beverages and tobacco (10-12), Textiles, wearing apparel & leather (13-15), Wood & paper products & printing (16-18) and Coke & refined petroleum products (19). 31-33 refers to Other Manufacturing
- 20-21 refers to Chemical and Pharmaceutical products
- 22-25 refers to Rubber, plastics & other non-metallic minerals (22-23), Basic metals and metal products (24-25)
- 26-30 refers to Computer products, Electrical equipment (26-27), Machinery & equipment (28) and Transport equipment (29-30)
Download this chart Figure 7: Contributions to growth of manufacturing output per hour
Image .csv .xlsIn recent periods, the metals and non-metals industries (group 22-25) has seen the largest fall in output per hour from a year prior, though productivity in this industry has been relatively volatile for the past couple of years. The machinery and equipment industry group (which includes computer products, and electrical and transport equipment) performed relatively well after the initial downturn, but in the most recent quarter the group saw the largest fall in output per hour to the prior year.
The overall fall in manufacturing productivity is down to labour inputs (in terms of hours and jobs) recently growing at a steady pace while GVA growth is flattening out, as shown in figure 8. GVA grew in 2013 after the post crisis recovery stumbled in 2011 and 2012, though growth has been slower since the start of 2014, while jobs growth (and more recently, hours growth) have picked up.
Figure 8: Components of manufacturing productivity measures
Seasonally adjusted, UK, quarter 1 (Jan to Mar) 2008 to quarter 1 (Jan to Mar) 2015
Source: Office for National Statistics
Download this chart Figure 8: Components of manufacturing productivity measures
Image .csv .xlsMore information on the labour productivity of sub-divisions of manufacturing is available in Reference Table LPROD01 (362 Kb Excel sheet) (Tables 3 and 4), and in the tables at the end of the pdf version of this statistical bulletin. Care should be taken in interpreting quarter on quarter movements in productivity estimates for individual sub-divisions, as small sample sizes of the source data can cause volatility.
Tables 3 and 4 include annual estimates for the level of productivity in £ terms for the National Accounts base year of 2011. These are estimates of GVA per unit of labour input and are not necessarily related to pay rates. Output per job (Table 3) varied from £39.2k in Wood and paper products (divisions 16-18) to £134.4k in Chemicals & Pharmaceuticals (divisions 20-21). The average for the whole of manufacturing was £57.4k and the average for the whole economy was £47.2k in 2011.
Chemicals & Pharmaceuticals was also top of the distribution for output per hour in 2011 (£75.0), with Wood, paper products, & printing (divisions 16-18) at the bottom of the distribution (£21.6). On this basis the average for manufacturing as a whole was £31.0 and the average for the whole economy was £29.9 per hour.
Back to table of contents7. Services labour productivity measures
Services output per hour growth on the quarter from a year prior has remained positive since 2014 Q3, which is in contrast to six quarters of negative growth for this measure from Q2 2012 (see figure 9).
Figure 9: Contributions to growth of services output per hour
Seasonally adjusted, UK, quarter 1 (Jan to Mar) 2008 to quarter 1 (Jan to Mar) 2015
Source: Office for National Statistics
Notes:
- G-I refers to Wholesale and retail trade; repair of motor vehicles and motorcycles (G), Transportation and storage (H) and Accommodation and food service activities (I)
- J refers to Information and communication
- K refers to Financial and insurance activities
- L refers to Real Estate activities
- M-N refers to Professional, scientific and technical activities (M), Administrative and support service activities (N)
- O-Q refers to Government Services
- R-U refers to Other Services
Download this chart Figure 9: Contributions to growth of services output per hour
Image .csv .xlsProductivity growth has returned to the government services industry (O-Q), while professional and admin services (M-N) returned negative productivity growth on a year prior in Q1, despite a positive performance in much of the post-crisis period. The retail industry has recently performed well in terms of output per hour from the previous year, recovering from four weak periods from 2012 Q2.
GVA has grown steadily since mid-2009 (see figure 10), while jobs have grown at a slower pace. This has resulted in stronger output per job growth to that of output per hour since Q4 2011.
Figure 10: Components of services productivity measures
Seasonally adjusted, UK, quarter 1 (Jan to Mar) 2008 to quarter 1 (Jan to Mar) 2015
Source: Office for National Statistics
Download this chart Figure 10: Components of services productivity measures
Image .csv .xlsMore information on labour productivity of services industries is available in Tables 5 and 6 of Reference Table LPROD01 (362 Kb Excel sheet) and in the tables at the end of the pdf version of this statistical bulletin.
In general, the dispersion of labour productivity growth rates across service industries is less pronounced than within manufacturing. But the dispersion of productivity levels is more pronounced. Yet, it should be borne in mind that labour productivity in industry L is affected by the National Accounts concept of output from owner-occupied housing, which adds to the numerator but without a corresponding component in the denominator. Excluding this industry, output per job in 2011 varied from £21.6k in Accommodation & food services (section I) to £106.5k in Finance & insurance (section K). These industries were also at the bottom and top of the productivity distribution in terms of output per hour (Table 6).
Back to table of contents8. Industry spotlight - information and communication services industry
The Information and communication services industry (industry J) consists of six divisions:
- Publishing activities (division 58)
- Motion picture, video and television programme production, sound recording and music publishing activities (59)
- Programming and broadcasting activities (60)
- Telecommunications (61)
- Computer programming, consultancy and related activities (62)
- Information service activities (63)
Annual output per hour for industry J saw a large boost in the late 1990s and early 2000s, driven by high output growth rates. Figure 11 shows this boost, with a decomposition of productivity into annual changes in output (represented by the lighter bars) and hours worked (the darker bars). The hours worked data are reversed, so a negative bar denotes an increase in hours worked, in order to show the effect changes have had on labour productivity.
Figure 11: Information and communication services, output per hour
UK, 1997 to 2014
Source: Office for National Statistics
Download this chart Figure 11: Information and communication services, output per hour
Image .csv .xlsGrowth of output per hour for industry J has trended downwards since 2003, though it has been more volatile since 2009. The downward trend, in recent years, has been due to low output growth and annual increases in hours worked, which have kept productivity growth negative for three out of four quarters.
When looking at total hours worked for industry J, computer programming and consultancy (division 62) accounted for approximately 52% of the total in 2014 (see figure 12). Telecommunications was the second largest component, accounting for roughly 17% of total hours worked in 2014. The proportion of hours worked allocated to each division of industry J has stayed relatively stable over time, with computer programming and consultancy maintaining the largest share.
Figure 12: Components of Industry J by hours worked
UK, 2014
Source: Office for National Statistics
Notes:
- 58 refers to Publishing activities
- 59 refers to Motion picture, video and television programme production, sound recording and music publishing activities
- 60 refers to Programming and broadcasting activities
- 61 refers to Telecommunications
- 62 refers to Computer programming, consultancy and related activities
- 63 refers to Information service activities
Download this chart Figure 12: Components of Industry J by hours worked
Image .csv .xlsOutput in industry J followed a similar trend, with computer programming and consultancy maintaining the largest share amongst the six components. It accounted for approximately 52% of total output in 2014. The second largest component, telecommunications, accounted for approximately 24% of the total.
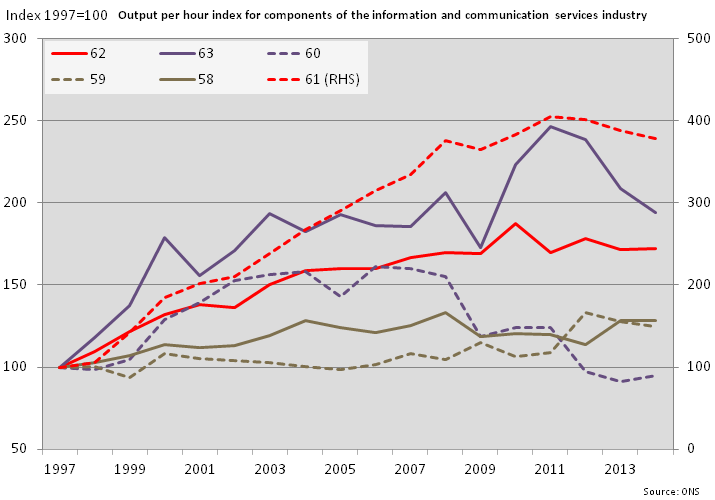
Figure 13 shows indexed output per hour growth rates for the six components of industry J. Telecommunications is shown on the right hand scale, while all other divisions are represented on the left hand scale.
Figure 13: Output per hour trends for the components of industry J
UK, 1997 to 2014
Source: Office for National Statistics
Download this image Figure 13: Output per hour trends for the components of industry J
.png (38.2 kB) .xls (49.7 kB)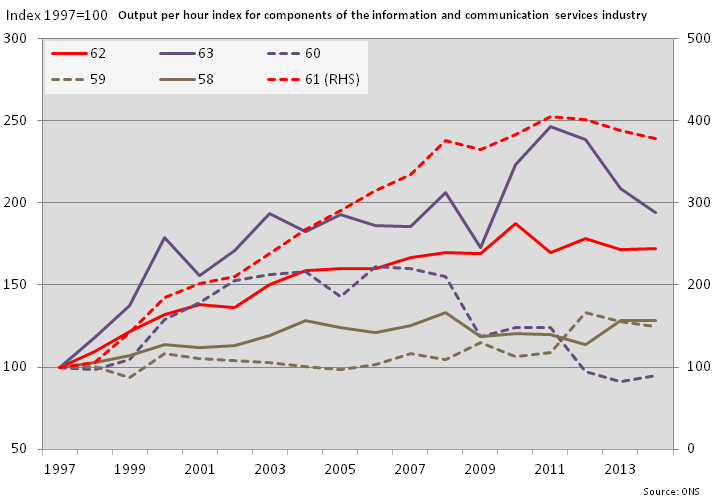
The figure shows that telecommunications has outperformed industry J’s other components in terms of output per hour by a significant margin. Productivity for telecommunications grew by about 13% a year, on average, from 1997 to 2008, and appeared to recover after a pro-cyclical dip in 2009. But output per hour then fell in each of 2012, 2013 and 2014.
Output per hour for computer programming and consultancy, the largest division of industry J, grew by 5% a year, on average, from 1997 to 2008, but since 2008 its performance has been relatively flat.
Notes for Industry spotlight - information and communication services industry
- This section of the bulletin was researched and drafted by Azhar Iqbal, a member of the Knowledge Economy & Productivity team at ONS.
9. Revisions
The Revisions table in Reference Table LPROD01 (362 Kb Excel sheet) shows revisions to growth rates of the main productivity estimates for the whole economy and selected sub-industries between this release and the previous release on 1 April 2015.
On the output side, GVA estimates have been revised back to Q1 2014, including revisions to construction estimates arising from the introduction of an interim solution for construction price indices. Compared with the last Labour Productivity release on 1 April 2015, quarterly construction GVA has been revised upwards by up to 4.2% on a quarterly basis, and by 1.9% in 2014. GVA as a whole has been revised up by 0.2% in 2014.
On the input side revisions reflect the outcome of the periodic review of seasonal adjustment parameters applied to jobs and hours estimates. This has had only a limited impact on jobs. But the review of hours has also introduced adjustments to align the LFS 13-week sampling frame with calendar quarters. This has led to extensive changes to seasonally adjusted hours estimates, even where seasonally adjusted jobs estimates are unchanged. This process also introduces material differences between calendar year averages of seasonally adjusted quarterly estimates and their non-seasonally adjusted (NSA) counterparts. For example, NSA total hours worked are estimated to have grown by 2.0% in 2012 and by 1.8% in 2013, while the new seasonally adjusted series shows growth of 1.4% in 2012 and 2.4% in 2013. Differences between NSA and seasonally adjusted calendar year totals are also a feature of the published LFS aggregate hours series. But users should note that differences at the aggregate level between hours estimates used in this release and the LFS published aggregate are somewhat larger than in recent editions of this release.
A research note on sources of revisions (145.4 Kb Pdf) to labour productivity estimates is available on the ONS website.
Table A below summarises differences between first published estimates for each of the statistics in the first column with the estimates for the same statistics published three years later. This summary is based on five years of data, that is, for first estimates of quarters between Q2 2007 and Q1 2012, which is the last quarter for which a three-year revision history is available. The averages of these differences with and without regard to sign are shown in the right hand columns of the table, and these can be compared with the value of the estimates in the latest quarter, shown in the second column. Additional information on revisions to these and other statistics published in this release is available in the Revisions Triangles (1.69 Mb Excel sheet) component of this release.
Table A: Revisions
| Revisions between first publication and estimates five years later (2007 Q2 - 2012 Q1) | |||
| Change on quarter a year ago | Value in latest period (%) | Average over 5 years (bias) | Average over 5 years without regard to sign (average absolute revision) |
| Output per worker | 1 | 0 | 0.9 |
| Output per job | 0.9 | 0 | 0.8 |
| Output per hour | 1.3 | 0 | 0.7 |
| Unit labour costs | 0.9 | 0 | 1.3 |
| Unit wage costs | 2.2 | -0.2 | 1.2 |
Download this table Table A: Revisions
.xls (28.2 kB)This revisions analysis shows that whole economy labour productivity growth estimates have tended to be unrevised over time (on a year-on-year basis). Unit labour costs have also been unrevised, while unit wage costs have tended to be revised down by 0.2 percentage points. Were the average revisions to apply to the current release, growth of output per hour in the year to the first quarter of 2015 would be unrevised at 1.3% over the next three years. Growth of unit labour costs would also be unrevised from 0.9%, while growth of unit wage costs would be revised from 2.2% to 2.0% over the same period.
Back to table of contents