1. Main points
The price of services sold by UK companies, as estimated by the aggregate Services Producer Price Index (SPPI), increased 0.5% in the year to quarter 3 of 2015, compared with an increase of 0.6% in the year to quarter 2 of 2015
Between quarters 2 and 3 of 2015, the aggregate SPPI rose by 0.1%, compared with an increase of 0.3% between quarters 1 and 2 of 2015
Professional, scientific and technical activities, transportation and storage, and real estate activities provided the greatest upward contributions to the annual rate of inflation. This was partially offset by a fall in prices for water supply, sewerage and waste management services
Real estate activities continued to show the largest rise in prices, with prices increasing by 3.3% in the year to quarter 3 of 2015
Water supply, sewerage and waste management services showed the largest fall in prices, decreasing by 7.7% in the year to quarter 3 of 2015
2. What is Services Producer Price Inflation?
The Services Producer Price Index (SPPI) provides a measure of inflation for the UK service sector. It is constructed from a statutory quarterly survey, which measures changes in the price received for selected services provided by UK businesses to other UK businesses and government. Individual SPPIs are available; these provide information on price change for a selection of service industries. These individual price indices are also aggregated together to create a service industry SPPI with limited coverage (it does not provide full coverage of the “service sector”).
The primary use of the SPPI is as a deflator in the UK National Accounts. However, it is also important as an inflationary measure to inform monetary policy and to account for inflation in long-term service procurement contracts. For more information on the uses of SPPI please see the separate document Users of Services Producer Price Indices data (67.2 Kb Pdf).
The figures presented in this statistical bulletin are considered provisional for the latest 2 quarters (quarter 2 and quarter 3 of 2015) and may be revised as late data is received.
None of the indices presented in this bulletin are seasonally adjusted.
Coverage of SPPI
The service sector currently accounts for around 78% of the UK economy based on its weight in Gross Domestic Product (GDP). We do not currently produce an SPPI for every industry in the service sector and so the aggregate SPPI is a partial, best estimate, of the overall inflation to UK businesses in the service sector. Currently, we estimate that the SPPIs presented in this statistical bulletin represent 59% of the total service sector at industry level. The SPPI's coverage of the service sector at Standard Industrial Classification (SIC) class, division and section level is available in the SPPI coverage document (113 Kb Excel sheet). As resources allow, we will continue to review the existing SPPIs and expand coverage through developing SPPIs for new industries. As such, the composition of aggregate SPPI will sometimes change, but will always remain our best estimate of inflation in the UK service sector. The fact that coverage may change over time should be considered by users when deciding which indices best meet their needs.
Newly developed SPPIs
A development project to increase the industrial coverage of the SPPI took place between 2009 and 2012, which resulted in the development of 8 new SPPIs. These are:
accountancy services
legal services
architectural services
engineering services
cargo handling services
advertising services
business management consultancy
storage and warehousing
Since their development, these indices have been published as experimental series. Since the quarter 4 2013 release, these indices are no longer published separately, but are instead included in this release and make up part of the aggregate SPPI. The inclusion of these new indices has changed the composition of the aggregate SPPI, increasing the coverage of the service industry and improving the measure. Further information about the impact of adding these new indices to the aggregate can be found in the quarter 4 2013 SPPI statistical bulletin.
All of the statistics contained in this release are official statistics. However, since these newly developed series have not yet undergone a full assessment against the Code of Practice for Official Statistics by the UK Statistics Authority they cannot currently be labelled as National Statistics.
Back to table of contents3. Summary
Between mid-2005 and mid-2008, the annual rate of inflation in the service sector, as estimated by the aggregate Services Producer Price Index (SPPI), rose steadily from an annual rate of 1.3% in quarter 2 of 2005 to a peak of 3.7% during quarters 1 and 2 of 2008. At the end of 2008, the rate of inflation fell rapidly, from annual inflation of 3.6% in quarter 3 of 2008 to deflation (prices lower than they were in the same quarter of the previous year) of 1.6% in quarter 3 of 2009.
The annual rate of inflation began to increase at the end of 2009, reaching its post-economic downturn high of 1.8% in quarter 2 of 2010. Since mid-2010, inflation has tended to remain relatively steady at around 1%. In quarter 3 of 2015, prices increased by 0.5%.
Looking at the latest estimates (Table A) of the aggregate SPPI for quarter 3 of 2015, the main movements were:
prices received by UK service providers increased 0.5% in the year to quarter 3 of 2015, down slightly from an increase of 0.6% in quarter 2 of 2015
the main upward contributions to the annual rate came from increases in the prices charged for professional, scientific and technical activities, transportation and storage, and real estate activities, however, these were partially offset by a fall in the price of water supply, sewerage and waste management services
service prices rose 0.1% between quarter 2 and 3 of 2015, down from an increase of 0.3% between quarter 1 and 2 of 2015
the main upward contribution to the quarterly rate of inflation came from real estate activities
Water supply, sewerage and waste management services showed the greatest decrease in the quarterly rate of inflation with prices falling 2.1% in the year to quarter 3 of 2015 compared with an increase of 0.5% in the year to quarter 2 of 2015
Table A: Output prices (gross sector) - aggregate Services Producer Price Index
| United Kingdom | ||
| % change | ||
| Year | Quarter | |
| Q1 2011 | 1.0 | 0.3 |
| Q2 2011 | 1.1 | 1.0 |
| Q3 2011 | 1.1 | -0.5 |
| Q4 2011 | 1.2 | 0.4 |
| Q1 2012 | 1.3 | 0.4 |
| Q2 2012 | 0.8 | 0.5 |
| Q3 2012 | 1.5 | 0.2 |
| Q4 2012 | 1.5 | 0.4 |
| Q1 2013 | 1.5 | 0.4 |
| Q2 2013 | 0.8 | -0.2 |
| Q3 2013 | 0.8 | 0.2 |
| Q4 2013 | 1.3 | 0.9 |
| Q1 2014 | 0.9 | 0.0 |
| Q2 2014 | 1.5 | 0.4 |
| Q3 2014 | 1.5 | 0.2 |
| Q4 2014 | 0.7 | 0.1 |
| Q1 2015 | 0.7 | 0.0 |
| Q2 2015 | 0.6 | 0.3 |
| Q3 2015 | 0.5 | 0.1 |
| Source: Office for National Statistics | ||
| Notes: | ||
| 1. The aggregate SPPI is calculated on a gross sector basis | ||
| 2. The aggregate SPPI is an aggregate of the individual industry level SPPIs (excluding Financial Intermediation) published in the SPPI Statistical Bulletin. It does not provide full coverage of the service sector | ||
| 3. Not all of the industry level SPPIs used to construct the aggregate SPPI are National Statistics | ||
| 4. Q1 refers to Quarter 1 (January to March), Q2 refers to Quarter 2 (April to June), Q3 refers to Quarter 3 (July to September) and Q4 refers to Quarter 4 (October to December) | ||
Download this table Table A: Output prices (gross sector) - aggregate Services Producer Price Index
.xls (25.6 kB)
Figure A: Aggregate Services Producer Price Index
Quarter 3 (July to Sept) 2005 to Quarter 3 (July to Sept) 2015, United Kingdom
Source: Services Producer Price Index (SPPI) - Office for National Statistics
Notes:
- The aggregate SPPI is calculated on a gross sector basis
- The aggregate SPPI is an aggregate of the individual industry level SPPIs (excluding financial intermediation) published in the SPPI Statistical Bulletin. It does not provide full coverage of the service sector
- Not all of the industry level SPPIs used to construct the aggregate SPPI are National Statistics
- Q1 refers to Quarter 1 (January to March), Q2 refers to Quarter 2 (April to June), Q3 refers to Quarter 3 (July to September) and Q4 refers to Quarter 4 (October to December)
Download this chart Figure A: Aggregate Services Producer Price Index
Image .csv .xls4. Annual inflation
The aggregate Services Producer Price Index (SPPI) rose by 0.5% in the year to quarter 3 of 2015, down slightly from an increase of 0.6% in the year to quarter 2 of 2015. Of the 10 sections (as defined by the 2007 Standard Industrial Classification) that are combined to form the aggregate SPPI, 7 showed price increases.
The main upward contributions to the annual rate of the aggregate SPPI came from professional, scientific and technical activities, which increased 0.6% in the year to quarter 3 of 2015 (down from an increase of 0.9% in the year to quarter 2 of 2015). Transportation and storage and real estate activities also had notable contributions to the increase of the aggregate in the year to quarter 3 of 2015, increasing by 0.9% and 3.3%, respectively. These increases were partially offset by a fall in the price of water supply, sewerage and waste management services, where prices fell by 7.7% in the year to quarter 3 of 2015 (compared to a decrease of 6.7% in the year to quarter 2 of 2015) (Table B and Figure B).
Table B: Annual growth in SPPI (percentage change, latest quarter on corresponding quarter of previous year)
| Quarter 3 (Jul to Sep) 2015, United Kingdom | ||||
| Section | Annual percentage change | |||
| Water Supply, Sewerage & Waste Management | -7.7 | |||
| Repair & Maintenance of Motor Vehicles | 1.9 | |||
| Transportation & Storage | 0.9 | |||
| Accommodation & Food | -0.6 | |||
| Information & Communication | -0.1 | |||
| Real Estate Activities | 3.3 | |||
| Professional, Scientific & Technical Activities | 0.6 | |||
| Administrative & Support Services | 0.1 | |||
| Education | 0.3 | |||
| Other Services | 1.6 | |||
| Aggregate SPPI | 0.5 | |||
| Source: Office for National Statistics | ||||
| Notes: | ||||
| 1. The section level SPPIs are an aggregate of individual industry level SPPIs (excluding Financial Intermediation) published in the SPPI Statistical Bulletin. They do not provide full coverage of the service sector | ||||
| 2. Not all of the industry level SPPIs used to construct the section level SPPIs are National Statistics | ||||
Download this table Table B: Annual growth in SPPI (percentage change, latest quarter on corresponding quarter of previous year)
.xls (24.6 kB)
Figure B: Contribution to annual growth rate (0.5%)
Quarter 3 (July to Sept) 2015, United Kingdom
Source: Office for National Statistics
Notes:
- The section level SPPIs are an aggregate of the individual industry level SPPIs (excluding Financial Intermediation) published in the SPPI Statistical Bulletin. They do not provide full coverage of the section listed
- Not all of the industry level SPPIs used to construct the section-level SPPIs are National Statistics
Download this chart Figure B: Contribution to annual growth rate (0.5%)
Image .csv .xlsIncreases in price for professional, scientific and technical activities, transportation and storage, and real estate activities, provided the main contributions to the rise in the aggregate SPPI in the year to quarter 3 of 2015.
Professional, scientific and technical activities prices increased by 0.6% in the year to quarter 3 of 2015. This was mainly caused by a rise in the prices in accountancy and legal services.
Accountancy prices increased by 2.5% in the year to quarter 3 of 2015, compared with an increase of 3.4% in the year to quarter 2 of 2015. This rise is mainly a result of increases in the prices of audit/assurance services and tax consultancy where prices have risen by 2.1% and 3.7% respectively in the year to quarter 3 of 2015.
Legal service prices increased by 3.0% in the year to quarter 3 of 2015, up from an increase of 2.2% in the year to quarter 2 of 2015. This increase is mainly due to the prices for business and commercial legal services rising by 3.0%.
Transportation and storage prices increased by 0.9% in the year to quarter 3 of 2015, unchanged from the year to quarter 2 of 2015. This increase was due to a rise in the prices for business airfares and sea and coastal water freight.
In the year to quarter 3 of 2015 business airfares prices increased by 4.7%, up slightly from an increase of 4.6% in the year to quarter 2 of 2015. There has been an increase in prices for all fare types.
Sea and coastal water freight prices increased by 10.1% in the year to quarter 3 of 2015, a significant rise compared to an increase of 5.8% in the year to quarter 2 of 2015, as a result of increases in coastal, European and global freight prices.
Real estate activity continued to make a notable upward contribution to the annual rate of inflation. Prices increased by 3.3% in the year to quarter 3 of 2015, down slightly from an increase of 3.4% in the year to quarter 2 of 2015. This was mainly due to an increase in the price of estate agencies, where prices increased by 8.0% in the year to quarter 3 of 2015, down from an increase of 8.5% in the year to quarter 2 of 2015. The increase in the estate agent index has been driven by significant rises in the value of commercial properties, not by the percentage fees that estate agents receive, which have remained stable.
The increases seen in professional, scientific and technical activities, transportation and storage, and real estate activities were partially offset by a fall in the prices charged for water supply, sewerage and waste management services, where prices fell 7.7% in the year to quarter 3 of 2015, compared to a decrease of 6.7% in the year to quarter 2 of 2015. This is mainly a result of the decrease in prices for sorted recovered materials services, where prices fell 21.9% in the year to quarter 3 of 2015. The fall in prices of sorted recovered materials services mirrors the decline seen in the world metal industry.
Figure C shows the SPPI sorted recovered materials services index. The main driver behind the price reductions seen in this index is weak demand from the Chinese manufacturing sector. This reduced demand has pushed down the value of the majority of metals, which has led to contributors to the SPPI reporting that they have to charge less for the materials when they are recovered. This is also being exacerbated by the increase in cheap exports from China, leading to demand being far lower than supply.
Figure C: Service Producer Price Index for sorted recovered materials services
Quarter 3 (July to Sept) 2010 to Quarter 3 (July to Sept) 2015, United Kingdom
Source: Office for National Statistics
Notes:
- Q1 refers to Quarter 1 (January to March), Q2 refers to Quarter 2 (April to June), Q3 refers to Quarter 3 (July to September) and Q4 refers to Quarter 4 (October to December)
Download this chart Figure C: Service Producer Price Index for sorted recovered materials services
Image .csv .xls
Figure D: Contribution to the change in the 12 month growth rate between quarter 2 (Apr to June) and quarter 3 (July to Sept) 2015 (0.1 %)
United Kingdom
Source: Office for National Statisics
Notes:
- The section level SPPIs are an aggregate of the individual industry level SPPIs (excluding Financial Intermediation) published in the SPPI Statistical Bulletin. They do not provide full coverage of the section listed
- Not all of the industry level SPPIs used to construct the section-level SPPIs are National Statistics
- Q1 refers to Quarter 1 (January to March), Q2 refers to Quarter 2 (April to June), Q3 refers to Quarter 3 (July to September) and Q4 refers to Quarter 4 (October to December)
Download this chart Figure D: Contribution to the change in the 12 month growth rate between quarter 2 (Apr to June) and quarter 3 (July to Sept) 2015 (0.1 %)
Image .csv .xlsThe aggregate SPPI increased 0.5% in the year to quarter 3 of 2015, compared with an increase of 0.6% in the year to quarter 2 of 2015. Figure D shows how the SPPI sections have contributed towards this 0.1 percentage point reduction. The main contribution to the change came from falling prices for information and communication, but this was partially offset by increases in administrative and support services.
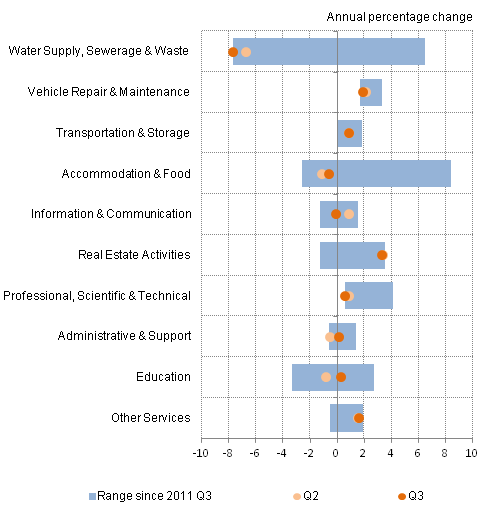
Figure E : Services Producer Price Index by section
United Kingdom
Source: Office for National Statistics
Notes:
- Q1 refers to Quarter 1 (January to March), Q2 refers to Quarter 2 (April to June), Q3 refers to Quarter 3 (July to September) and Q4 refers to Quarter 4 (October to December)
Download this image Figure E : Services Producer Price Index by section
.png (20.0 kB) .xls (22.5 kB)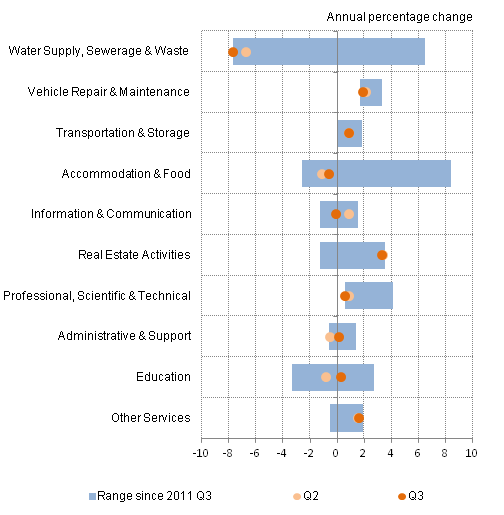
Examining inflation for each of the sections that contribute to the aggregate SPPI reveals a diverse set of trends. Figure E shows both the range of annual inflation rates experienced by each of the sections since quarter 3 of 2011 and the annual rates of inflation for the 2 most recent quarters. The 10 sections were split evenly between those which saw an increase in inflation relative to the last quarter and those which experienced a fall. There was a slight decline in the aggregate inflation rate over this period.
SPPI prices for water supply, sewerage and waste management currently stands at a 5-year low, continuing a downward trend. The inflation rate has fallen from 8.3% at the beginning of 2010 to -7.7% in the most recent quarter.
One notable difference between each section is the range of inflation rates that have been experienced since 2010. Education, accommodation and food, and water supply, sewerage, and waste management have experienced a relatively wide range of inflation rates over this period. Although all sections have experienced some variance in inflation, certain industries have experienced inflation consistently higher than others. Wholesale, retail trade and repair of motor vehicles and motorcycles has not experienced inflation lower than 1.7% at any point in the past 5 years, while administrative and support services, and information and communication have not experienced inflation higher than 1.5%.
Back to table of contents5. Quarterly inflation
Prices received for the services included in the aggregate Services Producer Price Index (SPPI) rose 0.1% between quarters 2 and 3 of 2015, compared to an increase of 0.3% between quarters 1 and 2 of 2015. Of the 10 sections that make up the aggregate SPPI, 7 sections showed increases in prices between quarters 2 and 3 of 2015.
The largest increases in the quarterly rate came from education and real estate activities, which increased by 1.1% and 1.0%, respectively between quarters 2 and 3 of 2015. The remaining increases were small, ranging from 0.1% to 0.3%. (Table C and Figure F).
Table C: Quarterly growth in SPPI (percentage change, latest quarter on previous quarter)
| Quarter 3 (Jul to Sep) 2015, United Kingdom | |
| Section | Quarterly percentage change |
| Water Supply, Sewerage & Waste Management | -2.1 |
| Repair & Maintenance of Motor Vehicles | 0.3 |
| Transportation & Storage | 0.2 |
| Accommodation & Food | 0.2 |
| Information & Communication | 0.1 |
| Real Estate Activities | 1.0 |
| Professional, Scientific & Technical Activities | -0.1 |
| Administrative & Support Services | -0.1 |
| Education | 1.1 |
| Other Services | 0.1 |
| Aggregate SPPI | 0.1 |
| Source: Office for National Statistics | |
| Notes: | |
| 1. The section level SPPIs are an aggregate of individual industry level SPPIs (excluding Financial Intermediation) published in the SPPI Statistical Bulletin. They do not provide full coverage of the service sector | |
| 2. Not all of the industry level SPPIs used to construct the section level SPPIs are National Statistics | |
Download this table Table C: Quarterly growth in SPPI (percentage change, latest quarter on previous quarter)
.xls (31.7 kB)
Figure F: Contribution to quarterly growth rate (0.1%)
Quarter 3 (July to Sept) 2011 to Quarter 3 (July to Sept) 2015, United Kingdom
Source: Office for National Statistics
Notes:
- The section-level SPPIs are an aggregate of the individual industry-level SPPIs (excluding financial intermediation) published in the SPPI Statistical Bulletin. They do not provide full coverage of the section listed
- Not all of the industry-level SPPIs used to construct the section-level SPPIs are National Statistics
Download this chart Figure F: Contribution to quarterly growth rate (0.1%)
Image .csv .xlsReal estate activities showed the largest contribution to the SPPI aggregate rate between quarters 2 and 3 of 2015 with prices rising by 1.0%, compared with an increase of 0.7% between quarters 1 and 2 of 2015. The main contribution to this increase was from estate agent prices, which increased by 2.1% between quarters 2 and 3 of 2015. This is compared with an increase of 1.7% between quarters 1 and 2 of 2015. This increase has been driven by letting of properties outside of London.
In quarter 2 of 2015 we produced a short story on the SPPI estate agents index, our findings showed that the percentage fees that estate agents received have remained stable; however as the value of commercial properties have increase significantly the estate agents revenue has increased. Between quarters 2 and 3 of 2015 this trend has continued. (Figure G).
Figure G: Service Producer Price Index for estate agent activities
Quarter 3 (July to Sept) 2010 to Quarter 3 (July to Sept) 2015, United Kingdom
Source: Office for National Statistics
Notes:
- Q1 refers to Quarter 1 (January to March), Q2 refers to Quarter 2 (April to June), Q3 refers to Quarter 3 (July to September) and Q4 refers to Quarter 4 (October to December)
Download this chart Figure G: Service Producer Price Index for estate agent activities
Image .csv .xls6. Economic context
Comparison with Average Weekly Earnings
The aggregate Services Producer Price Index (SPPI) captures changes in the prices received by UK business for the provision of a selection of services to other UK businesses and the public sector. For many services, the cost of manpower is the largest component of the price charged by businesses for providing the service, rather than the cost of goods or fuels. As a result, it is expected that the price charged for services should move in a similar way to the wages received by the UK workforce. Figure H shows a comparison of the annual percentage change of the fees received by UK businesses for the provision of services, as estimated by the aggregate SPPI, with an indicator of salaries received by the UK workforce who are employed in the service sector, as estimated by the Average Weekly Earnings (AWE) ‘services’ pay index excluding bonuses.
Figure H: Services Producer Price Index and 'services' Average Weekly Earnings Index
Quarter 3 (July to Sept) 2002 to Quarter 3 (July to Sept) 2015, United Kingdom
Source: Office for National Statistics
Notes:
- The aggregate SPPI includes the water supply; sewerage and waste management sector not included in the AWE
- The AWE index includes financial and insurance activities, public administration and defence: compulsory social security, human health and social work activities and arts, entertainment & recreation sectors not included in the SPPI
- Q1 refers to Quarter 1 (January to March), Q2 refers to Quarter 2 (April to June), Q3 refers to Quarter 3 (July to September) and Q4 refers to Quarter 4 (October to December)
Download this chart Figure H: Services Producer Price Index and 'services' Average Weekly Earnings Index
Image .csv .xlsAs would be expected, the annual percentage change for AWE services follows a broadly similar pattern to the SPPI. From 2001 to late 2008, both the AWE for services and the aggregate SPPI show similar trends, although AWE growth was significantly stronger. During the economic downturn in 2008 to 2009, the rate of growth in both wages and service prices slowed dramatically. However, while prices received for services started to fall in 2009, wages continued to grow compared with a year earlier, albeit at a much lower rate. Since quarter 4 of 2010 both AWE and the aggregate SPPI have shown lower growth than before the economic downturn. In the last 2 years the AWE services and SPPI indices have both shown growth of around 1%. However, in the last 3 quarters the AWE services index has shown stronger growth than SPPI. The rises in the AWE services index have been driven by a large increase in the retail and repair sector, which is not measured in the SPPI.
Comparison with Consumer Price Index
While the SPPI measures the amount received by a company for services they’ve provided to other businesses, the prices paid by households is estimated by the Consumer Prices Index (CPI). While the costs associated with providing services to both businesses and households will be broadly similar, there may be different costs associated with providing services to different customers. Figure I shows a comparison with the ‘all services’ sector of the Consumer Prices Index (CPI) which measures the prices paid for services by households.
Figure I: Comparison of Services Producer Price Index and 'all services' Consumer Prices Index aggregate
Quarter 3 (July to Sept) 2002 to Quarter 3 (July to Sept) 2015, United Kingdom
Source: Office for National Statistics
Notes:
- SPPI measures changes in the price received by a company, CPI measures changes in the price paid by a consumer. Therefore CPI figures may include taxes and fees that are not retained by the service provider
- SPPI measures the price received for services provided by UK based suppliers only, excluding imports from non-UK suppliers. CPI aims to measure the price paid by consumers in the UK, who may use non-UK based suppliers
- SPPI uses Standard Industrial Classification 2007 (SIC 07) to produce its aggregate, CPI uses Classification of Individual Consumption according to Purpose (COICOP), This means that the structure of each index may not always correlate at more detailed levels
- Q1 refers to Quarter 1 (January to March), Q2 refers to Quarter 2 (April to June), Q3 refers to Quarter 3 (July to September) and Q4 refers to Quarter 4 (October to December)
Download this chart Figure I: Comparison of Services Producer Price Index and 'all services' Consumer Prices Index aggregate
Image .csv .xlsGenerally inflation in the CPI ‘all services’ index runs at a higher rate than the SPPI. Between late 2005 and 2008 the gap between the SPPI and CPI all services annual rate of inflation narrowed before widening again from 2009 to present. During the economic downturn in 2008 to 2009, the annual rate of inflation for both indices decreased, with prices falling by as much as 1.6% for services sold by UK businesses, while the prices paid by households continued to grow, although at a much lower rate, reaching a low of 2.4% in quarter 4 of 2009. Since quarter 4 of 2010 both indices have shown growth however the SPPI has shown significantly lower growth than CPI.
Other measures of service sector inflation
There are other measures of service sector inflation available, such as the Chartered Institute of Procurement and Supply (CIPS) purchasing managers’ index and the Confederation of British Industry (CBI) service sector survey. There are significant methodological differences between these surveys and SPPI, therefore direct comparisons cannot be made.
International comparison
All countries within the European Union are required to produce a measure of producer price inflation for the services sector under the Short Term Statistics Regulation. Figure J shows the growth rates of service producer prices for a selection of EU countries since quarter 2 of 2010. The United Kingdom and Sweden recorded largely stable service producer price indices, growing by 2.1% and 4.6% respectively over the total period, whereas Austrian prices increased more rapidly. These experiences contrast with France and Spain, where SPPI inflation has been negative since quarter 1 of 2013 for France and quarter 3 of 2011 in the case of Spain, although SPPI inflation for Spain has returned to a positive level in quarter 2 of 2015.
Figure J: Services Producer Price Indices international comparison
Quarter 2 (Apr to June) 2010 to Quarter 2 (Apr to June) 2015, United Kingdom
Source: Office for National Statistics
Notes:
- The UK growth in this chart does not match that published as the Aggregate Gross Sector SPPI. This is because the indices shown in this comparison only include sections G to N, as per the Standard Industrial Classification 2007 (SIC 07). The aggregate Gross Sector SPPI also includes industries classified to Sections E and G of SIC 07. A full list of all SIC codes included can be found in the SPPI Coverage document
- Q1 refers to Quarter 1 (January to March), Q2 refers to Quarter 2 (April to June), Q3 refers to Quarter 3 (July to September) and Q4 refers to Quarter 4 (October to December)
Download this chart Figure J: Services Producer Price Indices international comparison
Image .csv .xlsHowever, in recent quarters the range of inflation rates experienced by these countries has narrowed, as the countries with the lowest inflation rates (France and Spain) saw an increase, and the country with the highest rate (Austria) saw a decrease in inflation. Austria’s inflation rate was the lowest since 2011 in the latest available data, and Spain’s was the highest since 2012.
Back to table of contents7. Net sector aggregate
At the aggregate level, both a net and gross sector Services Producer Price Index (SPPI) is produced. The prices used to construct both of these indices are the same, but different weights are used to construct the net sector index compared with the gross sector.
Summary of net sector movements
In quarter 3 of 2015, movements in the net sector aggregate SPPI were:
annual inflation rose 0.5%, down from 0.7% in quarter 2 of 2015
between quarter 2 and quarter 3 of 2015, quarterly inflation stood at 0.0%, down from an increase of 0.4% between quarters 1 and 2 of 2015
Generally, the movements of the net sector aggregate SPPI are similar to those of the gross sector indices with the net sector aggregate tending to inflate at a slightly higher rate than the gross sector indices (Figure K).
Figure K: Aggregate net sector and gross sector SPPI
Quarter 3 (July to Sept) 2010 to Quarter 3 (July to Sept) 2015, United Kingdom
Source: Office for National Statistics
Notes:
- The aggregate SPPIs is an aggregate of the individual industry-level SPPIs (excluding financial intermediation) published in the SPPI Statistical Bulletin. It does not provide full coverage of the service sector
- Not all of the industry level SPPIs used to construct the aggregate SPPI are National Statistics
- Q1 refers to Quarter 1 (January to March), Q2 refers to Quarter 2 (April to June), Q3 refers to Quarter 3 (July to September) and Q4 refers to Quarter 4 (October to December)