Table of contents
- Main points
- Introduction
- Background
- The “oldest old” population in the UK
- 90 and over population in the UK by age group
- 90 and over population by sex
- The 90 and over population by single year of age in the UK
- UK country comparisons
- International comparisons
- Who uses estimates of the very old?
- Methodological information
- Quality
- Methodological review
- Background notes
- Methodology
1. Main points
There were over half a million people aged 90 and over living in the United Kingdom (UK) in 2014
For every 100 men aged 90 and over in 2014 there were 249 women
The number of centenarians (people aged 100 and over) living in the UK has risen by 72% over the last decade to 14,450 in 2014
780 of the 14,450 centenarians living in the UK in 2014 were estimated to be aged 105 or more, double the number in 2004
England and Wales had more centenarians per 100,000 population in 2014 than Scotland or Northern Ireland
2. Introduction
We have today (30 September 2015) released Estimates of the Very Old (including Centenarians) 2002 to 2014 for England and Wales, and the United Kingdom (UK). These are annual mid-year estimates by sex and single year of age for people aged 90 to 104 and for the 105 and over age group. Figures for 2014 are published for the first time today. Figures for 2002 to 2013 update the figures previously published in September 2014 for England and Wales and for the UK.
Corresponding estimates for Scotland and for Northern Ireland for 2002 to 2014 are also published today by National Records of Scotland (NRS) and the Northern Ireland Statistics and Research Agency (NISRA) respectively.
We publish annual Mid-Year Estimates (MYE) of the population for England and Wales and the UK by single year of age up to age 89 and for the 90 and over age group. To provide users with a consistent set of estimates by single year of age up to age 105 and over, the “Estimates of the Very Old (including Centenarians)” series is constrained to the 90 and over totals in the MYE. The analysis here focuses on the UK but includes comparisons between England and Wales, Scotland and Northern Ireland.
Back to table of contents3. Background
Interest in population estimates at the oldest ages by single year of age has increased as life expectancy has risen and the number of those aged 90 and over has grown.
Until 2006, the Government Actuary’s Department calculated population estimates for single years of age beyond 90 for each of the UK countries. Although these estimates were made available for research purposes1, they were not officially published. Since 2006, these estimates have been produced by the Office for National Statistics (ONS).
In 2007, in recognition of increased user demand for population estimates at the oldest ages by single year of age, we began to publish estimates of the 90 and over age group by single year of age for people aged 90 to 104 and for the 105 and over age group for England and Wales as experimental statistics. Since 2010, we have also published these estimates for the UK. Estimates of the Very Old for England and Wales, and for the UK were formerly named Estimates of the Very Elderly. The name was changed in 2011 to reflect concerns that the term “elderly” has negative connotations.
In 2011, the estimates were assessed by the UK Statistics Authority and have since been published as National Statistics. The estimates were re-assessed in 2015 and their National Statistics status is subject to confirmation, once all the requirements in the assessment report have been met.
Notes for background
- Estimates of the 90 and over population by single year of age have been produced since 1981 for internal purposes on a consistent basis.
4. The “oldest old” population in the UK
The population of the UK is ageing. Over the last 30 years the percentage of the population aged 65 and over increased from 15% in 1984 to 18% in 2014, an increase of over 3 million people in this age group over the period.
Not only is the population ageing, but there has been progressive ageing of the older population itself. Most striking has been the increase in the number and proportion of the “oldest old”. In 1984, 19% of the population aged 65 and over were in their 80s and 2% were aged 90 and over. By 2014, 22% of those aged 65 and over were in their 80s and 5% were aged 90 or over (Figure 1).
Figure 1: UK population aged 65 and over by age group
1984 and 2014
Source: Office for National Statistics, National Records of Scotland, Northern Ireland Statistics and Research Agency
Download this chart Figure 1: UK population aged 65 and over by age group
Image .csv .xlsIn 2014, there were estimated to be over half a million people (550,810) aged 90 and over living in the UK, up from 187,250 people in 1984 (Figure 2).
Figure 2: UK population aged 90 and over
1984 and 2014
Source: Office for National Statistics, National Records of Scotland, Northern Ireland Statistics and Research Agency
Download this chart Figure 2: UK population aged 90 and over
Image .csv .xlsThe chance of surviving to older ages has increased over recent decades, contributing to the rising number of those aged 90 and over in the population. Improvements in mortality rates at older ages are due to a combination of factors such as improved medical treatments, housing and living standards, nutrition and changes in the population’s smoking habits.
Although the 90 and over group account for only a very small proportion of the overall UK population (0.9% in 2014), the size of this age group relative to the rest of the population has increased over time. In 1984, there were 332 people aged 90 and over per 100,000 population; by 1994 this had increased to 503; by 2004 it had reached 675 and the latest figures for 2014 show there were 853 people aged 90 and over per 100,000 population in the UK (Figure 3).
Figure 3: People aged 90 and over per 100,000 population, UK
1984 to 2014
Source: Office for National Statistics, National Records of Scotland, Northern Ireland Statistics and Research Agency
Download this chart Figure 3: People aged 90 and over per 100,000 population, UK
Image .csv .xls5. 90 and over population in the UK by age group
4 out of 5 people aged 90 and over in the UK in 2014 were aged below 95.
The age profile of the 90 and over population however is becoming older. Over the period 1984 to 2014, the proportion of the 90 and over population aged 90 to 94 decreased from 82% to 80% while the proportion aged 95 to 99 increased from 16% to 17% and the proportion aged 100 and over (centenarians) increased from 2% to 3% (Figure 4).
Figure 4: UK population aged 90 and over by age group, UK
1984 and 2014
Source: Office for National Statistics, National Records of Scotland, Northern Ireland Statistics and Research Agency
Download this chart Figure 4: UK population aged 90 and over by age group, UK
Image .csv .xlsCentenarians
Although centenarians account for only 3% of the population aged 90 and over and only 0.02% of the overall UK population, their numbers are growing.
In 2014, there were estimated to be 14,450 centenarians (people aged 100 or over) living in the UK.
Over the last 30 years, the number of centenarians has more than quadrupled from the 1984 estimate of 3,250. In the last decade their numbers have gone up by 6,030, a 72% increase (Figure 5).
Figure 5: Number of centenarians in the UK
1984 to 2014
Source: Office for National Statistics, National Records of Scotland, Northern Ireland Statistics and Research Agency
Notes:
- Numbers are rounded to nearest 10..
Download this chart Figure 5: Number of centenarians in the UK
Image .csv .xlsNot only have the numbers of centenarians increased over recent decades, the numbers of centenarians reaching age 105 or older has also been increasing.
In 1984, there were estimated to be 120 centenarians aged 105 and over. 10 years later in 1994, numbers had more than doubled to 280. By 2004, the estimated number of these older centenarians reached 380 and by 2014 the estimate doubled again to reach 780 centenarians aged 105 or older (Figure 6).
Figure 6: UK centenarians aged 105 and over
1984, 1994, 2004, 2014
Source: Office for National Statistics, National Records of Scotland, Northern Ireland Statistics and Research Agency
Notes:
- Numbers are rounded to nearest 10.
Download this chart Figure 6: UK centenarians aged 105 and over
Image .csv .xls6. 90 and over population by sex
In 2014, of the half a million people aged 90 and over in the UK, the vast majority, 71%, were female. Women outnumber men at older ages because they have higher life expectancy. (According to the latest National Life Tables for 2012 to 2014, life expectancy at birth is 82.8 years for females compared with 79.1 years for males).
Within the 90 and over population in the UK, the ratio of females to males increases with age. In 2014, 78% of those aged 95 and over were female; 85% of centenarians were female and 90% of centenarians aged 105 and over were female (Figure 7).
Figure 7: UK population aged 90 and over by age groups and sex
2014
Source: Office for National Statistics, National Records of Scotland, Northern Ireland Statistics and Research Agency
Download this chart Figure 7: UK population aged 90 and over by age groups and sex
Image .csv .xlsAlthough women outnumber men at older ages, the ratio of females to males has fallen over recent decades due to greater improvements in male mortality at older ages relative to female mortality. (Over the period 1982 to1984, to 2012 to-2014, UK life expectancy at age 65 improved by 5.2 years for males compared with 3.7 years for females and at age 85 by 1.4 years for males and 1.3 years for females).
Female to male ratios at the oldest ages
Figure 8: Female to male ratios at age 90 and over
1984 to 2014
Source: Office for National Statistics, National Records of Scotland, Northern Ireland Statistics and Research Agency
Download this chart Figure 8: Female to male ratios at age 90 and over
Image .csv .xlsFigure 8 shows the number of women aged 90 and over for every 100 men of those ages, from 1984 to 2014. This ratio decreased from 416 women in 1984 to 249 women in 2014 per 100 men aged 90 and over. Although male mortality at older ages improved faster than female mortality over the whole of the period shown, the fall in the ratio of women to men at ages 90 and over is only apparent from 1990; prior to this time the ratio is rising.
The rises in the number of women aged 90 and over relative to men in the 1980s reflect 2 major past events, the First World War and the Spanish “flu” pandemic that followed. Men who would have reached age 90 at the beginning of the period shown in Figure 8 (1984 to 1986), would have been aged 18 or over at the outbreak of the First World War in 1914 and therefore eligible to enlist. Those who would have reached age 90 in the period 1987 to 1990 would have been too young to enlist when war broke out, however they would progressively have turned 18 and therefore been eligible to join-up between 1915 and 1918 when the war ended. (Also it is known that many boys younger than 18 volunteered and their age was not checked1. It is thought that as many as 250,000 “Boy Soldiers”’ were recruited and fought in the First World War). Many of these men would have died as a result of the war, reducing the size of these cohorts at older ages.
The global influenza pandemic that occurred after the War in 1918 to 1919, unlike other strains of “flu”, tended to attack young adults as well as younger and older age groups2. Young men were disproportionately susceptible compared to young women because many had already been weakened by fighting in the First World War.
Together these 2 major events contribute to the rises in women relative to men at age 90 and over in the 1980s and at age 100 and over in the 1990s (despite greater improvement in male mortality compared to female mortality at older ages over the whole period) as fewer men were alive to reach the oldest ages. After this time, the ratio of women to men at older ages starts to fall.
In the last decade, the ratio of women to men at older ages has continued to fall. In the UK in 2004, there were 292 women aged 90 to 94 and 443 women aged 95 to 99 for every 100 men of those ages; by 2014, the ratios had fallen to 230 and 342 respectively The fall in the ratio was greater for those aged 100 and over, falling from 780 female centenarians for every 100 male centenarians in 2004, to 554 in 2014 (Figure 9). These falls are due to continued greater improvements in male mortality at older ages relative to female mortality.
Figure 9: Female to male ratios by 90 and over age groups, UK
2004 to 2014
Source: Office for National Statistics, National Records of Scotland, Northern Ireland Statistics and Research Agency
Download this chart Figure 9: Female to male ratios by 90 and over age groups, UK
Image .csv .xlsNotes for 90 and over population by sex
- “Boy Soldiers”, History Learning Site
. - K. Dunnell. Ageing and Mortality in the UK: National Statistician’s Annual Article on the population (711.9 Kb Pdf) . Population Trends, Winter 2008.
7. The 90 and over population by single year of age in the UK
The number of people aged 90 and over by single year of age in the population in the UK in 2002 to 2014 is largely determined by past and current mortality rates but also reflects the number of births 90 years ago and earlier. Past migration patterns and major events like war will also affect numbers.
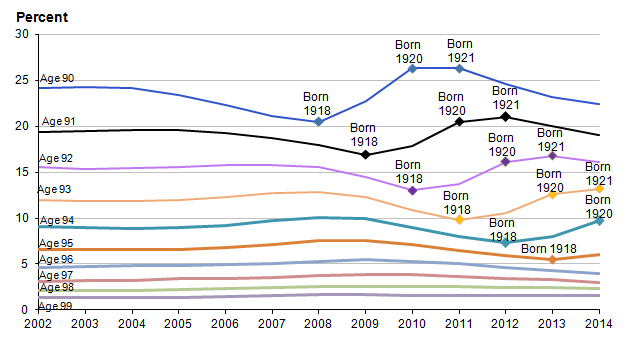
Figure 10 shows the proportions of selected ages that make up the total 90 and over population over the period 2002 to 2014. As would be expected, proportions decrease with age, in other words, in every year there are higher proportions of 90 year olds than 91 year olds than 92 year olds and so on.
Distinct birth cohort patterns are also apparent. (A birth cohort is all people born in the same year). These are echoes of birth patterns in the years leading up to, during and just after the First World War.
Looking at Figure 10, there is a steady decline in the proportion of 90 year olds over the period, 2004 to 2008. These people would have been born during the First World War years, 1914 to 19181. This reflects the steady decline in births during the war years.
The lowest number of births recorded around the First World War was in 19182. Those born at this time appear in the 2008 estimate of 90 year olds. Figure 10 shows the proportion of 90 year olds is lowest in 2008, reflecting this cohort’s low birth numbers. Following this cohort over time, we can see that the lowest proportion of 91 year olds is in 2009, the lowest proportion of 92 year olds is in 2010, the lowest proportion of 93 year olds is in 2011 and so on, with the lowest proportion of 96 year olds occurring in 2014.
The low point in births in 1918 was followed by a large increase in births post-war. Figures are not available for the UK for that period but in England and Wales there were 662,661 births in 1918 and 692,438 births in 1919. This compares with 957,782 in 1920 and 848,814 in 1921 – a large difference.
Figure 10: People aged 90 to 99 as a percentage of all people aged 90 and over, UK, 2002 to 2014
Source: Office for National Statistics, National Records of Scotland, Northern Ireland Statistics and Research Agency
Notes:
- Ages 100 to 105 are not shown on the chart because the percentages are so small.
Download this image Figure 10: People aged 90 to 99 as a percentage of all people aged 90 and over, UK, 2002 to 2014
.png (23.3 kB) .xls (29.2 kB)
Figure 10 shows the largest proportions of 90 year olds in 2010 and 2011, those born in the high birth years of 1920 and 1921. Again following these cohorts over time, we can see the highest proportions of 91 year olds are in 2011 and 2012, the highest proportions of 92 year olds are in 2012 and 2013 and the highest proportions of 93 year olds in 2013 and 2014.
The pattern of changes in the proportions of single year ages over the period 2002 to 2014 for men and women aged 90 and over separately follow the same pattern over time as for all people, however the proportions of women in the oldest ages are higher than for men, reflecting their higher life expectancy.
Notes for the 90 and over population by single year of age in the UK
- The years of birth are approximate. For instance a person aged 90 in 2010 could have been born in 1919 or 1920; for simplicity however such persons are regarded as belonging to the 1920 birth cohort.
- Population estimates are mid-year; total births are for calendar years.
8. UK country comparisons
We use combined deaths data for England and Wales to produce estimates of the population aged 90 and over for England and Wales as a whole. We would be interested to know if there is any user requirement for separate estimates for the 2 countries and how these would be used. Please contact us using the statistical contact details at the end of this bulletin.
In 2014, in England and Wales as a whole, there were 870 people aged 90 and over per 100,000 population, the highest proportion across the UK countries. In Scotland, there were 739 people aged 90 and over per 100,000 population and in Northern Ireland, there were 654 (Figure 11). These differences reflect higher life expectancy at older ages in England and Wales compared with Scotland and Northern Ireland. For example, in the latest National Life Tables, 2012 to 2014, at age 85, life expectancy in England and Wales was 5.9 years for males and 6.8 years for females, compared with 5.7 and 6.6 years in Northern Ireland and 5.5 and 6.4 years in Scotland.
Figure 11: People aged 90 and over per 100,000 population, UK countries
2014
Source: Source: Office for National Statistics, National Records of Scotland, Northern Ireland Statistics and Research Agency
Download this chart Figure 11: People aged 90 and over per 100,000 population, UK countries
Image .csv .xlsOver the last 30 years, the numbers of those aged 90 and over per 100,000 population increased in all UK countries. The largest increase occurred in England and Wales, with an increase of 531 people per 100,000 over the period, compared with increases of 456 in Scotland and 379 in Northern Ireland (Figure 12).
Figure 12: Increase in number of people aged 90 and over per 100,000 population, between 1984 and 2014
UK countries
Source: Office for National Statistics, National Records of Scotland, Northern Ireland Statistics and Research Agency
Download this chart Figure 12: Increase in number of people aged 90 and over per 100,000 population, between 1984 and 2014
Image .csv .xlsThe overall age distribution of the 90 and over population is very similar for all UK countries with the vast majority of the 90 and over population aged under 95. However, the age profile is slightly older in England and Wales. In 2014, 20% of the 90 and over population in England and Wales were aged 95 or over, compared with 19% in Northern Ireland and 18% in Scotland.
The ratio of women to men at age 90 and over is higher in Scotland and Northern Ireland than in England and Wales, reflecting higher male mortality rates in these countries. In 2014, in England and Wales there were 248 women aged 90 and over for every 100 men of that age; in Scotland and Northern Ireland the equivalent figures were 260 and 268 respectively (Figure 13).
Figure 13: Number of women per 100 men at ages 90 and over, UK countries
20014
Source: Office for National Statistics, National Records of Scotland, Northern Ireland Statistics and Research Agency
Download this chart Figure 13: Number of women per 100 men at ages 90 and over, UK countries
Image .csv .xlsOver the last 30 years, the ratio of women to men at older ages has fallen in all UK countries. The largest fall has been in England and Wales, where the number of women per 100 men at age 90 and over decreased by 172 over the period compared with a decrease of 151 in Scotland and a decrease of 59 in Northern Ireland. Over the last 10 years, the decrease in the number of women per 100 men at ages 90 and over has been greatest in Scotland, dropping by 101. The falls in the number of women per 100 men at ages 90 and over were very similar for England and Wales and Northern Ireland over the last decade, at 67 and 65 respectively (Figure 14).
Figure 14: Number of women per 100 men at ages 90 and over, UK countries
2004 to 2014
Source: Office for National Statistics, National Records of Scotland, Northern Ireland Statistics and Research Agency
Download this chart Figure 14: Number of women per 100 men at ages 90 and over, UK countries
Image .csv .xlsIn 2014, comparing UK countries, England and Wales had the highest proportion of centenarians in the population, with 23 centenarians per 100,000 population. In Scotland there were 17 centenarians per 100,000 population and in Northern Ireland 14 (Figure 15).
Figure 15: Centenarians per 100,000 population, UK countries
2014
Source: Office for National Statistics, National Records of Scotland, Northern Ireland Statistics and Research Agency
Download this chart Figure 15: Centenarians per 100,000 population, UK countries
Image .csv .xlsAlthough centenarians account for a very small proportion of population, over the last 30 years their numbers have increased in all UK countries. In England and Wales, numbers more than quadrupled from 2,950 in 1984 to 13,290 in 2014. In Scotland, the number of centenarians quadrupled over the 30 year period, from 230 in 1984 to 920 in 2014 and in Northern Ireland numbers of centenarians tripled from 70 in 1984 to 250 in 2014 (Figure 16).
Figure 16: Centenarians by UK country
1984 to 2014
Source: Office for National Statistics, National Records of Scotland, Northern Ireland Statistics and Research Agency
Notes:
- Numbers are rounded to nearest 10.
Download this chart Figure 16: Centenarians by UK country
Image .csv .xlsIn all UK countries the fastest increases in the numbers of centenarians have been in the last decade, with a 71% increase in numbers in England and Wales, a 77% increase in Scotland and an 80% increase in Northern Ireland.
The vast majority of centenarians are female. In 2014, there were 550 female centenarians per 100 male centenarians in England and Wales and in both Scotland and Northern Ireland there were 590 female centenarians per 100 male centenarians (Figure 17).
Figure 17: Number of female centenarians per 100 male centenarians, UK
2014
Source: Office for National Statistics, National Records of Scotland, Northern Ireland Statistics and Research Agency
Notes:
- Numbers are rounded to nearest 10.
Download this chart Figure 17: Number of female centenarians per 100 male centenarians, UK
Image .csv .xls9. International comparisons
Even in countries with the oldest age profiles, the population aged 90 and over represents a very small proportion of the overall population. Given these very small proportions, comparing the number of those aged 90 and over per 100,000 in the population enables international comparison more readily (Figure 18).
Figure 18: International comparison of the number of people aged 90 and over per 100,000 population
2014
Source: Statistics Bureau of Japan, Statistics Sweden, National Institute of Statistics and Economic Studies - France, The National Institute of Statistics Italy, Statistics Norway, National Statistics Institute of Spain, Federal Statistics Office Germany, Statistics Finland, Statistics Denmark, Statistics Canada, US Census Bureau, Australian Bureau of Statistics, Statistics New Zealand, Statistics Iceland, Statistical Office of the Republic of Slovenia, Central Statistics Office Ireland, Czech Statistical Office, National Statistics Institute of Bulgaria, Office for National Statistics and the United Nations
Notes:
- Countries have been selected on the availability of data.
- The data are for 2014 with the exception of China (2013) and Germany (2013).
Download this chart Figure 18: International comparison of the number of people aged 90 and over per 100,000 population
Image .csv .xlsIn 2014, in the UK, there were 853 people aged 90 and over per 100,000 population.
Japan had by far the highest number of persons aged 90 and over per 100,000 population in 2014, at 1,350. After Japan, European countries, with the exception of former communist countries, had the highest numbers of persons aged 90 and over per 100,000 population compared to other regions of the world. Among European countries, in 2014, Italy and France had relatively high numbers of persons aged 90 and over per 100,000 population, 1,096 and 1,097 respectively. The Republic of Ireland had a relatively low number, 481 per 100,000.
Former communist countries in Europe tend to have lower proportions of people aged 90 and over than other European countries, for example, in the Czech Republic and Bulgaria there were 463 and 404 per 100,000 population respectively. Among these countries, Russia had the lowest proportion at 245 persons aged 90 and over per 100,000. These figures reflect lower life expectancy at older ages in Eastern European countries compared to the rest of Europe.
Canada, the United States of America, Australia and New Zealand have lower numbers of persons aged 90 and over per 100,000 population than many countries in Europe: 747, 732, 645 and 581 respectively. Australia has one of the world’s highest life expectancies at older ages and New Zealand, Canada and the United States also have relatively high life expectancies at older ages. However, all 4 countries have younger age profiles (lower median ages) than many European countries meaning older people make up a smaller proportion of the population than in European countries with older profiles. This is because these countries have relatively higher fertility rates and higher historical migration rates.
Countries with more recently emerging economies such as China, Brazil and India have relatively low numbers of persons aged 90 and over per 100,000: 166, 166 and 91 respectively. They have younger age profiles and also have lower life expectancies than nations that have been developed for a longer period of time.
Africa is the least aged region of the world owing both to higher fertility and much lower life expectancy than other world regions. The average number of persons aged 90 and over for the continent as a whole was 36 per 100,000 (2014).
Centenarians
According to the UN there were 450,000 centenarians (people aged 100 years or more) in the world in 2014; of these 89,000 were men and 335,000 were women.
The prevalence of centenarians internationally largely mirrors that of the 90 and over population shown in Figure 18. In 2014, Japan had the highest number of centenarians per 100,000 population in the world at 47 while, within Europe, France had the highest number at 34. Eastern European countries have the lowest proportions of centenarians within Europe. In more recently developed economies, numbers of centenarians are very small, for example, in 2014 in India and Brazil there were 2 centenarians per 100,000 population in both countries (Figure 19).
Figure 19: International comparison of the number of centenarians per 100,000 population
2014
Source: Statistics Bureau of Japan, Statistics Sweden, National Institute of Statistics and Economic Studies - France, The National Institute of Statistics Italy, Statistics Norway, National Statistics Institute of Spain, Statistics Finland, Statistics Denmark, Statistics Canada, Federal Statistical Office of Germany, US Census Bureau, Australian Bureau of Statistics, Statistics New Zealand, Statistics Iceland, Statistical Office of the Republic of Slovenia, Czech Statistical Office, National Statistics Institute of Bulgaria, Office for National Statistics and the United Nations
Notes:
- Countries have been selected on the availability of data.
- The data are for 2014 with the exception of Germany (2013).
Download this chart Figure 19: International comparison of the number of centenarians per 100,000 population
Image .csv .xlsNotes for international comparisons
Back to table of contents10. Who uses estimates of the very old?
We primarily use Estimates of the Very Old in the production of National Life Tables and National Population Projections. Other uses include answering parliamentary questions, responding to media interest and responding to customer enquiries.
Outside ONS, estimates of the very old are used for resource allocation and planning for older people. They are of policy interest because of implications for pensions, health and social care. They are used by:
the Department for Work and Pensions and the Department of Health in formulating or assessing policy on pensions and health care
demographers, health and medical professionals and other researchers interested in longevity
life insurance companies and the actuarial profession for the calculation of mortality rates at the oldest ages
11. Methodological information
Estimates of the Very Old for England and Wales (and for Scotland and Northern Ireland) are produced using the Kannisto-Thatcher (KT) method.
The KT method produces estimates of population at older ages using “age at death” data. These data are used to build up distribution profiles of the numbers of older people in England and Wales. For example, if someone dies in 2012 aged 105, this means that they were alive and aged 104 in 2011 and 103 in 2010, etc. By collating “age at death” data for a series of years, it becomes possible to make an estimate of the number of people of a given age alive in any particular year and so create age distribution profiles, assuming that migration at these oldest ages is minimal.
To make estimates for the latest year, it is not possible to use deaths data, as we are interested in the population who are currently or very recently alive. So for each cohort the KT method uses an average of the last 5 years of “age at death” information to produce an estimate of the number of survivors for the current year.
Each year as more recent deaths data become available to inform the age distribution profiles, estimates for the back years are recalculated and become more accurate. For this reason Estimates of the Very Old (including Centenarians) are always published as “provisional”.
The estimates for the current year and the recalculated back years are constrained to sum to the 90 and over totals in the Mid-Year Estimates (MYE) for males and females separately for the current year and the previous years.
Estimates of the very old (including centenarians) for the UK are produced by aggregating the 90 and over single year estimates by sex for England and Wales, Scotland and Northern Ireland.
A Quality and Methodology Information document is available for the Estimates of the Very Old. This includes information on the strengths and weaknesses of the estimates and the consequent limitations on their use.
Back to table of contents12. Quality
Estimates of the very old are calculated from deaths data using a form of survivor ratio methodology, the Kannisto-Thatcher (KT) method. Each year as more recent deaths data become available to inform the age distribution profiles, estimates for the back years are recalculated and become more accurate (see Methodology section).
The KT method typically produces lower estimates of the total population aged 90 and over than the official mid-year estimate. The gap between the KT 90 and over totals and the official 90 and over mid-year estimate (MYE) totals will always be largest for the most recent years. (This is because there will be higher proportions of the people still alive at ages 90 and over in recent years, meaning the deaths data for these years are less complete). Looking at the 2002 to 2014 series, the KT 90 and over totals were around 98% of the MYE 90 and over totals for the years 2002 to 2008, but after this point they start to decrease, falling to 88% by 2014 (Figure 20).
Figure 20: Unconstrained KT 90 and over estimates as a percentage of MYE 90 and over totals
United Kingdom
Source: Office for National Statistics, National Records of Scotland, Northern Ireland Statistics and Research Agency
Download this chart Figure 20: Unconstrained KT 90 and over estimates as a percentage of MYE 90 and over totals
Image .csv .xlsThe KT method clearly results in an underestimation of the 90 and over population for the most recent years. Estimates produced by the method for the current year and the back years are therefore constrained to sum to the 90 and over totals in the mid-year estimates.
The MYE are produced by rolling forward the census population estimates allowing for ageing, births, deaths and migration (the cohort component method). Any error in the 90 and over census estimate is thereby carried forward to the inter-censal mid-year population estimates and will be reflected in the Estimates of the Very Old. In addition to non-response, other possible sources of error in the census estimate for people aged 90 and over include inaccuracies in reporting of dates of birth (for example proxy reporting by carers). Such inaccuracies have been documented in previous censuses1,2.
Constraining the KT estimates to sum to the 90 and over totals in the MYE provide users with a consistent set of single year estimates beyond age 89 and produces a smooth join between the population estimates produced by the two methods, Cohort Component and KT) at the age 89 to 90 boundary (Figure 21).
Figure 21: UK population estimates ages 80 to 105 and over
2014
Source: Office for National Statistics, National Records of Scotland, Northern Ireland Statistics and Research Agency
Download this chart Figure 21: UK population estimates ages 80 to 105 and over
Image .csv .xlsNotes for quality
- Thatcher, R. (Summer 1999). “The demography of centenarians in England and Wales”, Population Trends, No. 96 pp 5–12.
- Census 2001 Quality report for England and Wales; 2011 Census Quality Survey report.
13. Methodological review
We have an ongoing project reviewing the methods used to produce estimates for the population aged 90 and over and their accuracy.
This review includes testing the assumptions inherent in the Kannisto-Thatcher (KT) method used to produce 90 and over population estimates (namely the accuracy and completeness of the deaths data; the stability of mortality improvement; and no migration at older ages).
Population estimates of the very old are also being compared with census estimates and counts in administrative data sources.
Initial results from the review indicate that the 2014 official 90 and over totals that the KT estimates are constrained to are broadly in line with comparable data for this age group available from administrative sources held by the Department of Work and Pensions (DWP) and Department of Health (DH).
Estimates of the Very Old for the UK are aggregates of the single year estimates of the 90 and over population produced for England and Wales, Scotland and Northern Ireland (see Methodology section). It would be possible to produce these estimates for the UK by applying the KT methodology to an aggregation of population and deaths data for England and Wales, Scotland and Northern Ireland. The review will include an assessment of this alternative method.
Results from the review will be published on our website in December 2015. If there are any recommendations for changes to the methodology on the basis of the research findings, users will be consulted on these in 2016.
Back to table of contents