Table of contents
- Main points
- Introduction
- Background
- Uses and users of Estimates of the very old (including centenarians)
- Methodological information
- Older people in England and Wales
- Centenarians
- The 90 and over population by single year of age
- International comparisons
- Quality of estimates
- Differences between the 2002-2011 and the 2002-2012 estimates of the very old (including centenarians)
- Background notes
- Methodology
1. Main points
In 2012 there were estimated to be 465,500 people aged 90 and over living in England and Wales, just under 1% of the total population
Between 2002 and 2012 there has been a 33% increase in the number of those aged 90 and over
In 2012 in England and Wales, the number of centenarians (those aged 100 and over) was estimated to be 12,320
There were estimated to be 2.6 women per man aged 90 and over and 5.9 women per man aged 100 and over in England and Wales in 2012
2. Introduction
2002–2012 Estimates of the Very Old (including Centenarians) for England and Wales are published today. These estimates provide annual mid year estimates by sex and single year of age for persons aged 90 to 104 and for the 105 and over age-group for England and Wales as a whole.
2012 estimates are published for the first time today, while estimates for 2002 to 2011 are revised.
Corresponding 90 and over estimates for Northern Ireland for 2002-2012 are also published today by the Northern Ireland Statistics and Research Agency (NISRA). National Records of Scotland (NRS) will publish 90 and over estimates for 2011 and 2012 on 1st October 2013.
This release does not include 2002–2012 Estimates of the Very Old for the United Kingdom. These estimates will be published in early 2014 following the publication of the revised 2002-2010 Mid Year Estimate (MYE) back series for Scotland in October/November 2013.
ONS publishes MYEs of the population for England and Wales and for the UK by single year of age up to age 89 and for the 90 and over age group. To provide users with a consistent set of age estimates by single year of age up to age 105 and over, the Estimates of the Very Old (including Centenarians) series is constrained to the 90 and over totals in the MYE.
Back to table of contents3. Background
Interest in population estimates at the oldest ages by single year of age has increased as life expectancy increases and the number of those aged 90 and over has grown.
Until 2006 the Government Actuary’s Department calculated population estimates for single years of age beyond 90 for each of the UK countries. Although these estimates were made available for research purposes1, they were not officially published. Since 2006 these estimates have been produced by the Office for National Statistics (ONS).
In 2007, in recognition of increased user demand for population estimates at the oldest ages by single year of age, ONS began to publish estimates of the 90 and over age group by single year of age for persons aged 90 to 104 and for the 105 and over age group for England and Wales as experimental statistics. Since 2010 ONS has also published these estimates at a UK level.
In 2011 the estimates were assessed by the UK Statistics Authority and have since been published as National Statistics.
Notes for background
- Estimates of the 90 and over population by single year of age have been produced since 1981 on a consistent basis.
4. Uses and users of Estimates of the very old (including centenarians)
Within ONS, Estimates of the Very Old are primarily used in the production of national interim life tables and National Population Projections. Other uses include:
- answering parliamentary questions
- responding to media interest
- responding to customer queries
External uses include:
formulating or assessing future policy on pensions and health care (including work by the Department for Work and Pensions, the Department of Health, and HM Treasury)
research by demographers, actuaries, medical researchers and others interested in population estimates at the highest ages
5. Methodological information
Estimates of the Very Old are produced using the Kannisto-Thatcher (KT) method.
The KT method produces estimates of population at older ages using 'age at death'1 data. These data are used to build up distribution profiles of the numbers of older people in England and Wales. For example, if someone dies in 2006 aged 105, this means that they were alive and aged 104 in 2005 and 103 in 2004 etc. By collating ‘age at death’ data for a series of years, it becomes possible to make an estimate of the number of people of a given age alive in any particular year and so create age distribution profiles, assuming that migration at these oldest ages is minimal.
To make estimates for the latest year, it is not possible to use deaths data, as we are interested in the population who are currently or very recently alive. So for each cohort the KT method uses an average of the last 5 years of ‘age at death’ information to produce an estimate of the number of survivors for the current year.
Each year as more recent deaths data become available to inform the age distribution profiles, estimates for the back years are recalculated and become more accurate. For this reason Estimates of the Very Old (including Centenarians) are always published as ‘provisional’.
The estimates for the current year and the recalculated back years are constrained to sum to the 90 and over totals in the MYE for males and females separately for the current year and the previous years.
The 2002–2012 Estimates of the Very Old (including Centenarians) published in this release take account of the revisions made to the 2002–2010 MYE as a result of the 2011 Census.
Notes for methodology
- Death figures are based on deaths occurring in a calendar year for all years, with the exception of the latest year where deaths are deaths registered in that calendar year. This is because death registration data are available sooner than death occurrences data each year. Each time estimates of the very old are produced for the latest year, the previous year’s deaths registration data are replaced by occurrence deaths data for that year in the calculations.
6. Older people in England and Wales
Life expectancy continues to increase for both males and females in England and Wales, with improvements in the recent decades mainly due to improvements in mortality at older ages. This has resulted in increasing numbers of people aged 90 and over in the population.
Growth in the numbers of the ‘oldest old’ is of policy interest because of implications for pensions, health and social care.
In 2012 there were estimated to be 465,500 people aged 90 and over living in England and Wales, 0.8% of the total population (Figure 1).
Although they still account for only a very small proportion of the population, over the last 30 years the number of those aged 90 and over has almost tripled. In the last decade, between 2002 and 2012, there has been a 33% increase.
The dip in the 90 and over population in 2008 reflects low birth numbers 90 years previously, towards the end of World War I. For more details, see ‘The 90 and over population by single year of age’ section.
Figure 1: Population aged 90 and over, 1981-2012, England and Wales
Source: Office for National Statistics
Download this chart Figure 1: Population aged 90 and over, 1981-2012, England and Wales
Image .csv .xlsThere are more women aged 90 and over than men. This is because females have longer life expectancy than males. (According to the latest figures for 2009-2011, life expectancy at birth for females is 82.6 years compared to 78.7 for males). However over the last 30 years the percentage increase in the number of men of this age has been greater than for women, reducing the ratio of women to men aged 90 and over. This is mainly due to relatively greater improvements in male mortality compared to female mortality at older ages in recent decades. Figure 2 shows that in 1981 there were 4.0 women per man aged 90 and over. By 2002 this had reduced to 3.3 and by 2012 the ratio was 2.6 women per man aged 90 and over.
Figure 2: Women aged 90 and over per man aged 90 and over, 1981-2012, England and Wales
Source: Office for National Statistics
Download this chart Figure 2: Women aged 90 and over per man aged 90 and over, 1981-2012, England and Wales
Image .csv .xlsNot only has the number of those aged 90 and over increased, the size of the 90 and over age group as a proportion of the older population itself has also increased from 2002 to 2012. In 2002, 6% of the population aged 70 and over in England and Wales was aged 90 and over; by 2012 this had increased to 7%.
This progressive ageing of the older population is evident in the relative percentage increases in different age groups over the period. Between 2002 and 2012 in England and Wales, there was a 5% increase in those aged 70-79; a 15% increase in those aged 80-89 and a 33% increase in those aged 90 and over (Figure 3).
Figure 3: Population in older age groups, 2002 and 2012, England and Wales
Source: Office for National Statistics
Download this chart Figure 3: Population in older age groups, 2002 and 2012, England and Wales
Image .csv .xls7. Centenarians
In 2012 in England and Wales, the number of centenarians (those aged 100 and over) was estimated to be 12,320 (Figure 4). Of these, 610 were estimated to be aged 105 or more.
Over the last 30 years, there has been a five fold increase in the number of centenarians in England and Wales and a 74% increase from the 2002 figure of 7,090 centenarians.
Figure 4: Number of centenarians by sex, 1981-2012, England and Wales

Source: Office for National Statistics
Download this image Figure 4: Number of centenarians by sex, 1981-2012, England and Wales
.png (12.9 kB) .xls (27.6 kB)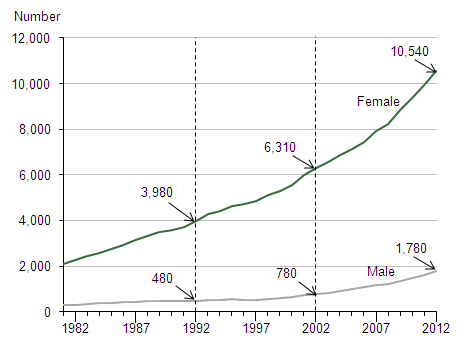
In 1981 there were estimated to be only 2,420 persons aged 100 and over, of which 310 were men and 2,110 were women. By 1992 numbers had risen to an estimated 480 male centenarians and 3,980 female centenarians.
Since 2002 the estimated number of male centenarians in England and Wales has more than doubled, from 780 in 2002 to 1,780 in 2012, while the estimated number of female centenarians has increased by two thirds, from 6,310 in 2002 to 10,540 in 2012.
Female centenarians continue to outnumber males due to women’s higher life expectancy; however the ratio of male to female centenarians is changing.
In 2002 there were eight women aged 100 and over for every man aged 100 and over. By 2005 this had reduced to seven and by 2012 there were estimated to be six female centenarians for every male centenarian in England and Wales.
These recent falls in the ratios of women to men at older ages are mainly due to relatively greater improvements in male mortality than female mortality at older ages in recent years.
Back to table of contents8. The 90 and over population by single year of age
The number of people aged 90 and over by single year of age in the population in England and Wales in 2002-2012 is largely determined by past and current mortality rates but also reflects the number of births 90 years ago and earlier. Past migration patterns and major events like war will also affect numbers.
Figure 5 shows the proportions of selected ages that make up the total 90 and over population over the period 2002-2012. As would be expected, proportions decrease with age, in other words in every year there are higher proportions of 90 year olds than 91 year olds than 92 years olds and so on.
Distinct birth cohort patterns are also apparent. (A birth cohort is all people born in the same year). These are echos of birth patterns in the years leading up to, during and just after the First World War.
Looking at Figure 5 there is a steady decline in the proportion of 90 year olds over the period, 2004 to 2008. These people would have been born during the First World War years, 1914 to 19181. This reflects the steady decline in births in England and Wales during the war years.
The lowest number of births recorded around World War I was in 19182. Those born at this time appear in the 2008 estimate of 90 year olds. Figure 5 shows the proportion of 90 year olds is lowest in 2008, reflecting this cohort’s low birth numbers. Following this cohort over time we can see that the lowest proportion of 91 year olds is in 2009, the lowest proportion of 92 year olds is in 2010, the lowest proportion of 93 year olds is in 2011 and the lowest proportion of 94 year olds in 2012.
The low point in births in 1918 was followed by a large increase in births post war. In total in 1920 in England and Wales there were 957,782 births and in 2021 848,814 births. This compares with 662,661 in 1918 and 692,438 in 1919 – a large difference.
Figure 5 shows the largest proportions of 90 year olds in 2010 and 2011, those born in the high birth years of 1920 and 1921. Again following these cohorts over time we can see the highest proportions of 91 year olds is in 2011 and 2012.
The pattern of changes in the proportions of single year ages over the period 2002-2012 for males and females aged 90 and over separately follow the same pattern over time as for all persons, however the proportions of females in the oldest ages are higher than for males, reflecting their higher life expectancy.
Figure 5: Persons age 90-99 and 100+ as a percentage of total persons aged 90 and over, England and Wales, 2002-2012

Source: Office for National Statistics
Download this image Figure 5: Persons age 90-99 and 100+ as a percentage of total persons aged 90 and over, England and Wales, 2002-2012
.png (24.3 kB) .xls (27.1 kB)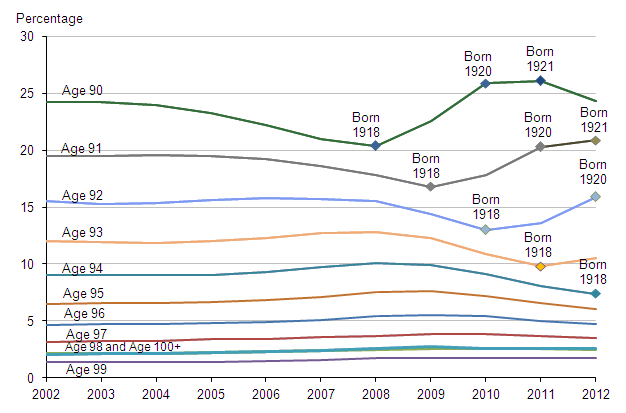
Notes for the 90 and over population by single year of age
- The years of birth are approximate. For instance a person aged 90 in 2010 could have been born in 1919 or 1920; for simplicity however such persons are regarded as belonging to the 1920 birth cohort.
- Population estimates are mid year; total births are for calendar years.
9. International comparisons
Figure 6: International comparison of the number of persons aged 90 and over per 100,000 of the population, 2012
Source: Statistics Denmark; Australian Bureau of Statistics; The National Institute of Statistics Italy; Statistics Sweden; Statistics Norway; National Statistical Institute of Bulgaria; Czech Statistical Office; Statistics Finland; Statistical Office of the Republic of Slovenia; Croatian Bureau of Statistics; Statistics Iceland; Statistics Bureau of Japan; Statistics New Zealand; National Statistics Institute of Spain; US Census Bureau; National Institute of Statistics and Economic Studies-France; ONS and the United Nations
Notes:
- Countries have been selected based on the availability of data for 2012.
Download this chart Figure 6: International comparison of the number of persons aged 90 and over per 100,000 of the population, 2012
Image .csv .xlsThe number of older people in a country’s population is largely a result of past and current mortality rates together with past fertility patterns. Recent fertility patterns will influence the relative proportions of younger and older people in the population. Past major events such as war will also affect numbers and proportions.
Median age (the age at which half the population is younger and half is older) is an indicator of the age profile of a country. Developing countries have much younger profiles, as indicated by their median ages, than developed countries.
Even in the most aged countries, the population aged 90 and over represents a very small proportion of the overall population. In 2012, at 45.4 years Japan had the highest median age of all countries in the world; however only 1.2% of the population was aged 90 and over in 2012.
Given these very small proportions, comparing the number of those aged 90 and over per 100,000 in the population more readily enables international comparison (Figure 6).
In 2012 in England and Wales there were 823 persons aged 90 and over per 100,000 of the population.
Japan had by far the highest number of persons aged 90 and over per 100,000 population in 2012 at 1,197. With the exception of Japan and Eastern European countries, Europe tends to have the highest numbers of persons aged 90 and over per 100,000 population compared to other regions of the world. Among European countries, in 2012, Sweden and Italy had relatively high numbers, 995 and 908 persons aged 90 and over per 100,000 population respectively. Germany and Iceland had relatively low numbers of persons aged 90 and over; 592 per 100,000 in Germany (2010) and 499 per 100,000 in Iceland.
Eastern European countries tend to have lower numbers of people aged 90 and over per 100,000 than other European countries, for example in the Czech Republic and Bulgaria the figures were 377 and 351 respectively. In Croatia there were 302 persons aged 90 and over per 100,000 (2011).This is because life expectancy at older ages in Eastern European countries is noticeably lower than in other European countries.
United States, Australia and New Zealand have lower numbers of persons aged 90 and over per 100,000 population than many countries in Europe, 666, 633 and 573 respectively. Australia has one of the world’s highest life expectancies at older ages and New Zealand and the United States also have relatively high life expectancies at older ages. However, all three countries have younger age profiles (lower median ages) than many European countries meaning older people make up a smaller proportion of the population than in European countries with older profiles. This is because these countries have relatively higher fertility rates and higher historic migration rates.
Countries with more recently emerging economies such as China and India have relatively low numbers of persons aged 90 and over per 100,000 population. They have younger age profiles and also have lower life expectancies than nations that have been developed for a longer period of time.
Africa is the least aged region of the world owing both to higher fertility and much lower life expectancy than other world regions. The average number of persons aged 90 and over for the continent as a whole is 26 per 100,000 (2010).
Back to table of contents10. Quality of estimates
Estimates of the Very Old are calculated from deaths data. The methodology results in a lower estimate of the total population aged 90 and over for England and Wales in 2012 than the 90 and over estimate in the 2012 mid-year estimates (MYE). However in order to provide users with a consistent set of single year estimates beyond age 89, once produced the Estimates of the Very Old for ages 90 and over constrained to sum to the 90 and over totals in the MYE for males and females separately (see Methodology section).
The MYE are produced by rolling forward the census population estimates allowing for ageing, births, deaths and migration. Any error in the 90 and over census estimate is thereby carried forward to the inter-censal mid-year population estimates and will be reflected in the Estimates of the Very Old.
There is some degree of uncertainty around all population estimates. In addition to non-response, other possible sources of error in the census estimate for people aged 90 and over include inaccuracies in reporting of dates of birth (for example proxy reporting by carers). Such inaccuracies have been documented in previous censuses1 ,2.
The methodology used to produce the Estimates of the Very Old (including Centenarians) includes assumptions (namely no migration at older ages and accuracy of the deaths registration data). Recording of date of birth at death registration may be more accurate than reporting of date of birth in the census, however as date of birth on death certificates is not validated there are also likely to be some inaccuracies in this data source.
ONS is currently reviewing the methods used to produce estimates for the 90 and over population. A paper presenting preliminary findings will be published in November 2013.
Notes for quality of estimates
- Thatcher, R. (Summer 1999). ‘The demography of centenarians in England and Wales’, Population Trends, No. 96 pp 5-12.
- Census Quality Report.
- Quality and Methodology Information for Estimates of the Very Old (335.5 Kb Pdf).
11. Differences between the 2002-2011 and the 2002-2012 estimates of the very old (including centenarians)
2002–2012 Estimates of the Very Old (including Centenarians) for England and Wales are published today, 27th September 2013.
Estimates for 2012 for England and Wales are published for the first time; estimates published for 2002 to 2011 update those published in March 2013.
There are some differences between the previously published estimates for the years 2002-2011 and the updated estimates for 2002-2011 published today together with the 2012 estimates. This is because the method used to produce the estimates updates the back years so figures for previous years are revised each time estimates are produced for the latest year. However any differences will be in the age distribution of the 90 and over population for a given year not in the 90 and over total as the Estimates of the Very Old are constrained to the ONS MYE 90 and over total (see Methodology section).
Differences are larger for later years with the largest differences occurring in the year preceding the current data year as a result of death registration data being replaced by death occurrence data for that year and the impact of the addition of the latest year of deaths data (see Methodology section).
Back to table of contents