1. Key figures
- Net long-term migration to the UK was estimated to be 260,000 in the year ending June 2014, a statistically significant increase from 182,000 in the previous 12 months
- While net migration has increased since the most recent low of 154,000 in the year ending September 2012, it remains below the peak of 320,000 in the year ending June 2005
- 583,000 people immigrated to the UK in the year ending June 2014, a statistically significant increase from 502,000 in the previous 12 months. There were statistically significant increases in immigration of EU (up 45,000) and non-EU (up 30,000) citizens
- An estimated 323,000 people emigrated from the UK in the year ending June 2014. Long-term emigration has been relatively stable since 2010
- There was a statistically significant increase in immigration for work (up 45,000 to 247,000), driven by increases for non-EU citizens (up 14,000), EU2 (Romanian and Bulgarian) citizens (up 11,000) and EU15 (up 10,000). Estimated employment of EU nationals (excluding British) resident in the UK was 16% higher in July to September 2014 compared to the same quarter in 2013
- National Insurance Number (NINo) registrations to adult overseas nationals increased by 12% to 668,000 in the year ending September 2014 from the previous year. Romanian citizens had the highest number of registrations (104,000), followed by Polish citizens (98,000)
- 32,000 EU2 citizens immigrated to the UK in the year ending June 2014, a statistically significant increase from 18,000 in the previous 12 months
- Immigration for formal study remained stable (176,000) in the year ending June 2014
- The statistically significant increase of 30,000 in immigration of non-EU citizens to 272,000 was in part driven by an increase in immigration to accompany/join others up 19,000 to 54,000. This follows a steady decline in non-EU immigration since the recent peak of 334,000 in the year ending September 2011
- Work and study visas grants continued to rise in the year ending September 2014, by 6% (+9,500) and 3% (+6,100) respectively. These trends reflected higher levels of both skilled work visas granted and university sponsored applications
- There were 24,300 asylum applications in the year ending September 2014, an increase of 2% compared with the previous 12 months (23,800), but low relative to the 2002 peak (84,100)
2. Overview
The Migration Statistics Quarterly Report (MSQR) is a summary of the quarterly releases of official international migration statistics. This edition covers those released on 27 November 2014 and it also includes links to other migration products released on that date. The majority of figures presented are for the year ending June 2014, but where available, figures are provided for the year ending September 2014.
Long-term migration estimates relate to people who move from their country of previous residence for a period of at least a year. Figures relating to visas include long-term and short-term migrants and their dependants; similarly National Insurance Number allocations to adult overseas nationals also include long-term and short-term migrants.
Back to table of contents3. Introduction
This edition of the Migration Statistics Quarterly Report (MSQR) includes provisional estimates of Long-Term International Migration (LTIM) for the year ending June 2014 and final estimates of LTIM for 2013.
The MSQR series brings together statistics on migration published by the Office for National Statistics (ONS), the Home Office and the Department for Work and Pensions (DWP). Migration statistics are a fundamental component of ONS’s mid-year population estimates. These are used by central and local government and the health sector for planning and monitoring service delivery, resource allocation and managing the economy. There is considerable interest in migration statistics both nationally and internationally, particularly in relation to the impact of migration on society and on the economy. Additionally, migration statistics are used to monitor the impact of immigration policy, and performance against a stated target to reduce annual net migration to the UK to the tens of thousands by 2015.
For further information on how ONS migration statistics are used, along with information on their fitness for purpose, please see the Quality and Methodology Information for Long-Term International Migration (LTIM) (245.4 Kb Pdf) Releases. For information on the accuracy of these statistics, the difference between provisional and final figures and guidance on comparing different data sources, please see the MSQR Information for Users (364.6 Kb Pdf). If you are new to migration statistics, you might find it helpful to read our ‘International Migration Statistics First Time User Guide’ (205 Kb Pdf) .
New for this release:
ONS has published a short article on the potential for using international migration estimates from other countries to validate UK international migration estimates.
ONS has published a new interactive world map which shows the top countries of last and next residence for migrants immigrating to, and emigration from, the UK since 1975. Additionally the interactive Migration Timeline has been updated to include 2013 data.
Final LTIM estimates for 2013 (and all subsequent estimates) include a small adjustment for non-asylum enforced removals of long-term migrants. For more information see the LTIM Methodology document (1.28 Mb Pdf) .
A new chart has been added to the Provisional Estimates of Long-Term International Migration spreadsheet showing the changing composition of net migration over time by citizenship.
2-Series (annual LTIM) tables now show the confidence interval surrounding the IPS component of all estimates and identify statistically significant changes occurring over the last year.
New charts have been added to the 2-Series tables showing the changing composition of net migration over time by the relevant migrant characteristic (Citizenship, Country of Birth, Country of Last or Next Residence, Usual Occupation Prior to Migration, Area of Destination or Origin Within the UK, Age and Sex, Sex and Marital Status).
New charts have been added to the 2- and 3-Series (annual IPS) tables enabling users to create a time series of immigration, emigration and net migration by any selected value, or combination of values, of migrant characteristics.
EU2 estimates have been added to all relevant 3-Series tables.
Three new single variable IPS tables (3.24 IPS Citizenship - Current and New Country Groupings, 3.25 IPS Country of Birth - Current and New Country Groupings and 3.26 IPS Country of Last or Next Residence - Current and New Country Groupings) have been published using the new country groupings which ONS consulted on earlier in 2014.
Accuracy of migration estimates
Long-term international migration (LTIM) are mainly produced using data from the International Passenger Survey (IPS), with adjustments made for asylum seekers, visitor and migrant switchers and flows to and from Northern Ireland.
Surveys gather information from a sample of people from a population. In the case of the IPS, the population is passengers travelling through the main entry and exit points from the UK including airports, seaports and the Channel Tunnel. The estimates produced are based on only one of a number of possible samples that could have been drawn at a given point in time. Each of these possible samples would produce an estimated number of migrants which may be different to the true value that would have been obtained if it were possible to ask everyone passing through about their migration intentions. This is known as sampling variability.
The published estimate is based upon the single sample that was taken and is the best estimate of the true value based on the data collected. However, to account for sampling variability, the estimates are published alongside a 95% confidence interval.
The confidence interval can be interpreted as the range within which there is a high probability (95%) that the true value for the population lies because, if we were to repeat the sampling process, we would expect the true value to lie outside the confidence interval only 1 in 20 times.
The confidence interval is a measure of the uncertainty around the estimate. Confidence intervals become larger for more detailed estimates (such as citizenship by reason for migration). This is because the number of people in the sample who have these specific characteristics (e.g. EU8 citizens arriving to study in the UK) is smaller than the number of people sampled within a category at a higher level (e.g. the total number of Eurpoean Union (EU) citizens arriving to study in the UK). The larger the confidence interval, the less reliable is the estimate. Therefore users of migration statistics are advised to use the highest level breakdown of data where possible.
Estimates from the IPS may change from one period to the next simply due to sampling variability. In other words, the change may be due to which individuals were selected to answer the survey, and may not represent any real-world change in migration patterns.
Statistical tests can be used to determine whether any increases or decreases that we see in the estimates from the IPS could be due to chance, or whether they are likely to represent a real change in migration patterns. If the tests show that the changes are unlikely to have occurred through chance alone, and are likely to reflect a real change, then the change is described as being statistically significant. The usual standard is to carry out these tests at the 5% level of statistical significance. This means that we would expect only 1 out of 20 statistically significant differences to have occurred purely by chance
LTIM estimates are about 90% based on IPS data, with adjustments made for asylum seekers, non-asylum enforced removals, flows to and from Northern Ireland and migrant and visitor switchers. LTIM estimates are shown with the confidence intervals for the IPS component of the estimate in order to give users an indication of the robustness of the estimate. Similarly the uncertainty associated with the IPS component of the estimate is used to calculate statistically significant changes in the LTIM estimates. However, when interpreting these confidence intervals and statistically significant changes, users should be aware that there is no method for quantifying the error associated with the non-survey components of LTIM, which are unlikely to be random.
For more information on the uncertainty in the statistics, the difference between provisional and final estimates and guidance on comparing the different data sources presented here, please see the MSQR Information for Users (205 Kb Pdf) .
Revisions to net migration estimates in light of the 2011 Census
In April 2014, ONS published a report (1.04 Mb Pdf) examining the quality of international migration statistics between 2001 and 2011, using the results of the 2011 Census. A key finding of the report was that over the ten year period annual net migration estimates were a total of 346,000 lower than total net migration implied by the 2011 Census. However, the report also showed that the quality of international migration estimates improved following changes made to the International Passenger Survey (IPS) in 2009.
Within the report, ONS published a revised series of net migration estimates for the UK. Published tables have been updated on the ONS website to include the revised estimates. The report (1.04 Mb Pdf), a summary and guidance (55.9 Kb Pdf) on how to use these revised figures are available on the ONS website.
Back to table of contents4. Net migration to the UK
This section describes the latest international migration statistics within the context of the historical time series of the statistics and sets out the likely drivers behind the trends observed.
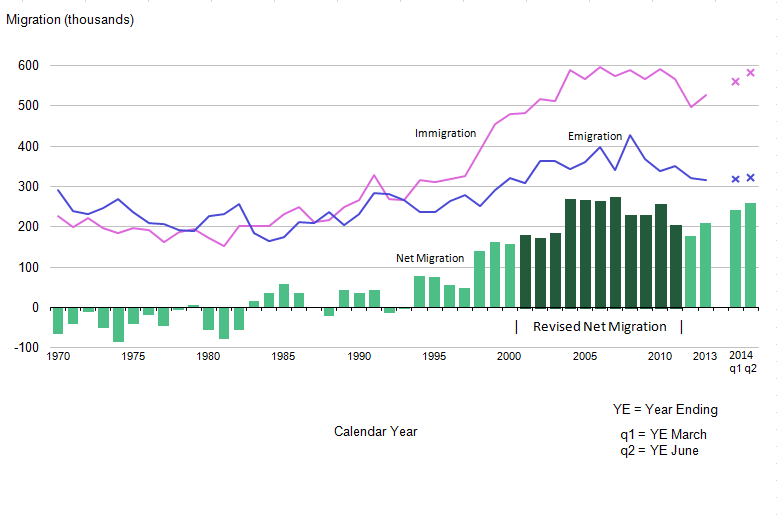
The net migration estimate for the year ending June 2014 is 260,000 and has a confidence interval of +/- 39,000. This is a statistically significant increase from the estimate of 182,000 (+/- 34,000) in the previous year. This continues the generally increasing trend in net migration over the last two years since the recent low of 154,000 in the year ending September 2012. However, net migration remains lower than the peak in 2004/2005 (Figure 1.1).
Figure 1.1: Long-Term International Migration, 1970-2014 (Year Ending June 2014)
Source: Long-term International Migration - Office for National Statistics
Notes:
- Figures for 2014 are provisional. All other figures are final calendar year estimates of LTIM. Provisional rolling quarterly estimates are denoted by a cross..
- Net migration estimates for the period 2001 to 2011 have been revised in light of the 2011 Census. Therefore they will not be consistent with the separate immigration and emigration figures shown.
Download this image Figure 1.1: Long-Term International Migration, 1970-2014 (Year Ending June 2014)
.png (24.6 kB) .xls (31.7 kB)
During the 1960s and 1970s, there were more people emigrating from the UK than arriving to live in the UK. During the 1980s and early 1990s, net migration remained at a relatively low level. Since 1994, it has been positive every year and rose sharply after 1997. During the 2000s, net migration increased, in part as a result of immigration of citizens from the countries that joined the EU in 2004. Since the mid-2000s, annual net migration has fluctuated between around 150,000 and 300,000.
Net migration is the difference between immigration and emigration. Recent increases in net migration have been driven by higher levels of immigration coupled with stable levels of emigration. Table 1 shows that there was a statistically significant increase in immigration to 583,000 (+/-32,000) in the year ending June 2014 from 502,000 (+/- 29,000) in the year ending June 2013. Emigration was estimated to be 323,000 (+/- 22,000) in the year ending June 2014.
Table 1 shows the key figures for the year ending June 2014 and the previous year with their corresponding confidence intervals. The annual differences are also presented with the confidence interval for these differences.
Table 1: Latest changes in migration
| United Kingdom | ||||||
| Thousands | ||||||
| YE June 2014 (p) | 95% CI | YE June 2013 | 95% CI | Difference | 95% CI | |
| Net Migration | 260 | +/-39 | 182 | +/-34 | 78 | +/- 52 |
| Immigration | 583 | +/-32 | 502 | +/-29 | 81 | +/- 43 |
| Emigration | 323 | +/-22 | 320 | +/-19 | 3 | +/- 29 |
| Notes: | ||||||
| 1. Figures are rounded to the nearest thousand. | ||||||
| 2. Further information on confidence intervals can be found in the MSQR Information for Users. | ||||||
| 3. The difference has been calculated by subtracting the 2013 estimate from the 2014 estimate. Where the confidence interval for the difference does not contain zero, we can say that the difference is statistically significant. This means that the difference is likely to reflect a real change in migration flows. There are statistically significant differences for immigration and net migration but not for emigration. | ||||||
| 4. YE = Year Ending. | ||||||
Download this table Table 1: Latest changes in migration
.xls (27.6 kB)In December 2013, ONS published a report on the history of immigration to the UK based on the 2011 Census, which provides further evidence of the drivers behind historical migration to the UK.
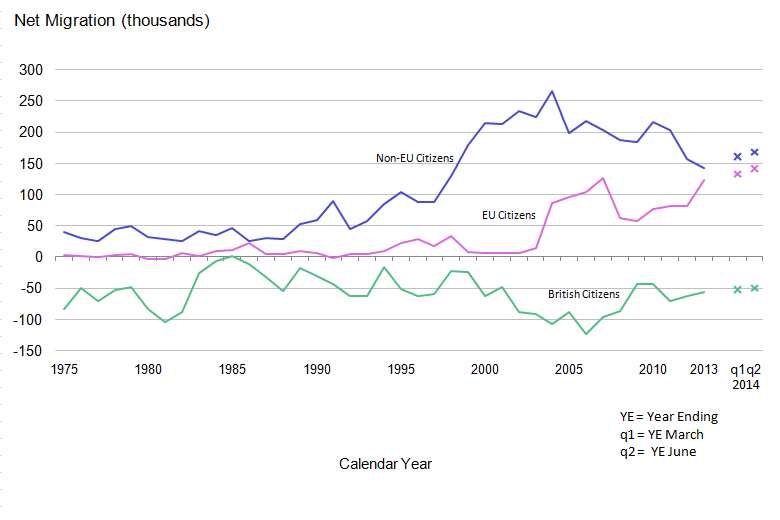
Figure 1.2 shows trends in net migration for EU, non-EU and British citizens. Over the last 10 years, increases in net migration have been driven mainly by increases in net migration of EU citizens. By contrast, net migration of non-EU citizens has been generally falling over the last 10 years and has decreased sharply over the last three years. The latest estimates show that this rising trend has continued for EU citizens, with an increase in net migration to 142,000 in the year ending June 2014 from 106,000 in the previous year.
Conversely, the decline in net migration of non-EU citizens has ended, and indeed there has been a statistically significant increase in net migration of non-EU citizens to 168,000 in the year ending June 2014 from 139,000 in the previous year. This was driven by a statistically significant increase in net migration for Other Foreign citizens from 81,000 to 105,000 in the year ending June 2014, while net migration of New Commonwealth citizens remains at a relatively low level. Overall, non-EU net migration remains at a lower level relative to the peaks seen in the mid to late 2000s (Figure 1.2).
Net migration of British citizens is negative, reflecting higher emigration than immigration for this group. This has remained relatively stable over the last few years, and was estimated to be (-50,000) in the year ending June 2014. This is smaller in magnitude than the largest value of net emigration of (-124,000) in 2006.
Figure 1.2: Long-Term International Net Migration by Citizenship, 1975-2014 (Year Ending June 2014)
Source: Net migration (thousands)
Notes:
- Figures for 2014 are provisional. All other figures are final calendar year estimates of LTIM. Provisional rolling quarterly estimates are denoted by a cross
- This chart is not consistent with the total revised net migration estimates as shown in Figure 1.1. Please see guidance note for further information.
Download this image Figure 1.2: Long-Term International Net Migration by Citizenship, 1975-2014 (Year Ending June 2014)
.png (28.1 kB) .xls (39.4 kB)
5. Immigration to the UK
In section 1, we looked at net migration as the difference between immigration and emigration. In this section, we look at the immigration component in more detail.
The latest immigration estimate for the year ending June 2014 is 583,000 with a confidence interval of +/-32,000. There has been a statistically significant increase in immigration from 502,000 (+/- 29,000) in the previous year.
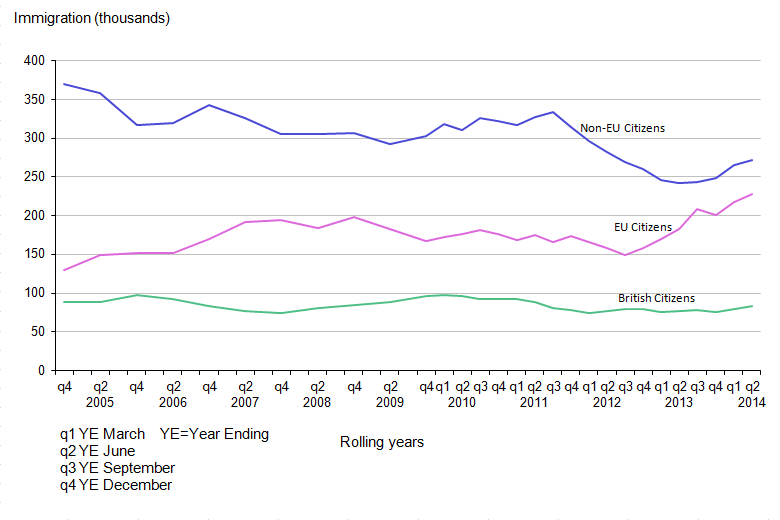
There has been a statistically significant increase in immigration amongst both EU and non-EU citizens. Immigration of EU citizens has increased to 228,000 in the year ending June 2014 from 183,000 in the year ending June 2013. Non-EU immigration increased to 272,000 in the year ending June 2014 from 242,000 in the previous 12 months. While the increase in EU immigration continues a recent trend, non-EU immigration had been in decline in the 3 years prior to the recent increase (Figure 2.1).
The varying trends in migration patterns among EU and non-EU citizens reflect their different rights to immigrate to the UK and the impact of government policy. The majority of people subject to immigration control are nationals of non-EU countries.
Figure 2.1: Immigration to the UK by Citizenship, 2004-2014 (Year Ending June 2014)
Source: Long-term International Migration - Office for National Statistics
Notes:
- Figures for 2014 are provisional.
- This chart is not consistent with the total revised net migration estimates as shown in Figure 1.1. Please see guidance note for further information.
Download this image Figure 2.1: Immigration to the UK by Citizenship, 2004-2014 (Year Ending June 2014)
.png (23.1 kB) .xls (30.2 kB)
British citizens
Provisional long-term international migration estimates by citizenship show that in the year ending June 2014 the estimated number of British citizens immigrating to the UK was 83,000. This figure is similar to the 77,000 British citizens estimated to have immigrated to the UK in the previous year. IPS estimates (which do not include the adjustments within LTIM estimates, and therefore will not match these estimates) show that the majority of British citizens are immigrating for work-related reasons (39,000). The next most common reason is ‘going home to live’ (19,000), followed by accompanying/joining others (11,000) and formal study (9,000). Generally, immigration of British citizens remains relatively stable over time, both in terms of the overall level and the main reasons for immigrating.
EU citizens
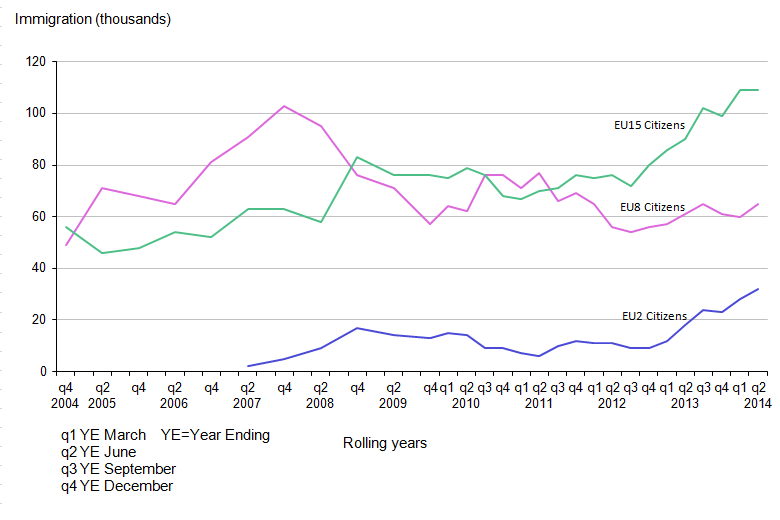
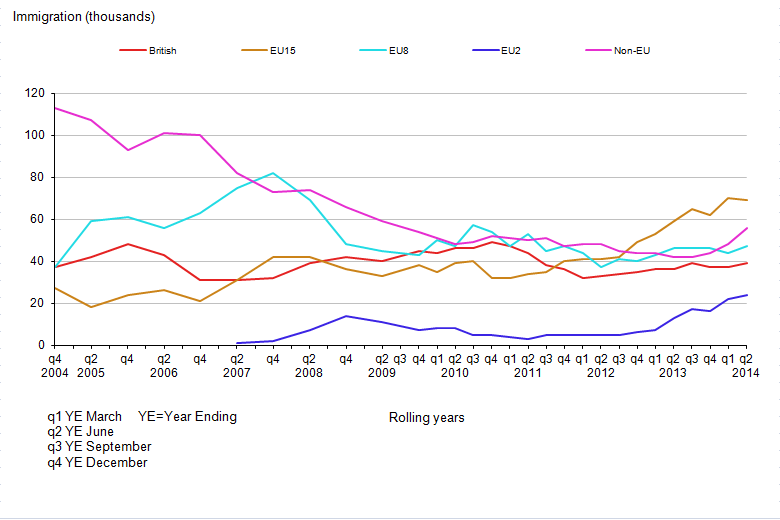
Immigration of EU citizens (excluding British) was estimated to be 228,000 in the year ending June 2014, a statistically significant increase from 183,000 in the previous year, and the highest recorded level for this group (Figure 2.2). Estimates are shown for specific groups of EU countries, namely the first 15 EU member states (EU15), the 8 Central and Eastern European countries that joined in 2004 (EU8) and Bulgaria and Romania which joined in 2007 (EU2). IPS estimates show that 52%, 31% and 15% of total EU immigration in the year ending June 2014 was accounted for by citizens of the EU15, EU8 and EU2 respectively.
EU15 citizens
The recent increase in EU immigration has been partly driven by an increase, albeit not statistically significant, in the number of EU15 citizens (excluding British) arriving in the UK to 117,000 in the year ending June 2014 from 96,000 in the year ending June 2013. IPS estimates (which do not include all of the adjustments included in LTIM estimates, and therefore may not sum to LTIM estimates – see glossary) show that the most common reason for immigration amongst EU15 citizens is work, with 69,000 (63%) arriving for this reason in the year ending June 2014, a slight but not a statistically significant increase, from 59,000 in the previous year.
EU8 citizens
Over the last two years immigration of EU8 citizens has been relatively stable. An estimated 74,000 EU8 citizens immigrated to the UK in the year ending June 2014 compared to 66,000 in the previous year. These levels are much lower than the peak of immigration from the EU8 in 2007. In the year ending June 2014, the majority (72%) of EU8 citizens arrived for work-related reasons (47,000).
It should be noted that from May 2011 transitional controls that applied to EU8 citizens seeking work in other EU countries expired (these were never applied in the Irish Republic, Sweden and the UK). This may have had the effect of diverting some EU8 migration flows to other EU countries, such as Germany, which in 2013 experienced its highest level of net migration since 1993. ONS has published an article on the potential for using international migration estimates from other countries to validate UK international migration estimates.
EU2 citizens
The latest IPS estimates for the year ending June 2014 shows that an estimated 32,000 Bulgarian and Romanian (EU2) citizens arrived in the UK. This was a statistically significant increase from 18,000 in the previous year. An estimated 75% of EU2 citizens arrived for work-related reasons (24,000).
Bulgaria and Romania joined the EU on 1 January 2007. Since then, migrants from these countries coming to the UK were subject to transitional employment restrictions, which placed limits on the kind of employment they could undertake. These restrictions ended on 1 January 2014.
Figure 2.2: EU Immigration to the UK, 2004–2014 (Year Ending June 2014)
Source: International Passenger Survey (IPS) - Office for National Statistics
Notes:
- Figures for 2014 are provisional.
Download this image Figure 2.2: EU Immigration to the UK, 2004–2014 (Year Ending June 2014)
.png (27.0 kB) .xls (30.7 kB)
Non-EU citizens
Immigration of non-EU citizens increased to 272,000 in the year ending June 2014 from 242,000 in the previous year. This ends a recent decline since the year ending September 2011 when an estimated 334,000 non-EU citizens immigrated to the UK (Figure 2.1).
In the year ending June 2014 there was a statistically significant increase in immigration for the Other Foreign citizens group, to 159,000 from 133,000. IPS estimates show that the majority of these Other Foreign citizens arrive for formal study (86,000) and the numbers arriving for study have been stable for some time. The increase in immigration among this citizenship group appears to be driven by a statistically significant rise in Other Foreign citizens accompanying/joining others (29,000 compared to 13,000 in the previous year).
The longer term decline in immigration of non-EU citizens has been largely due to lower immigration of New Commonwealth citizens, in particular for study. An estimated 34,000 New Commonwealth citizens arrived for study in the year ending June 2014, which is a decrease, albeit not statistically significant, from the estimate of 41,000 who arrived in the previous year. Inflows of New Commonwealth citizens for formal study remain around their lowest levels seen since 2002 and well below the peak of 108,000 in the year ending June 2011. These changes are likely to be related to changes seen in the visa statistics, reflecting the sharp decline in sponsored study applications in the Further Education sector (see Section 2.3).
Administrative data on entry clearance visas provide information on the nationality of those who are coming to the UK, though they relate to those nationals subject to immigration control. The majority of people subject to immigration control are nationals of non-EU countries.
Figure 2.3: Entry Clearance Visas Granted (Excluding Visitor and Transit Visas), by World Area, UK, 2005–2014
Notes:
- A small number (one to two thousand per year excluding visitor and transit visas) of Home Office visas cannot be ascribed to a world area and are categorised as ‘Other’. This category does not appear in the above chart.
- The majority of the total for ‘Rest of Asia’ is accounted for by East Asia.
- European Economic Area (EEA) nationals do not require a visa to enter the UK. However some EEA nationals do apply for, and are granted, visas.
- See the Glossary for a discussion of world regions and differences between Home Office and Department for Work and Pensions (DWP) definitions.
Download this chart Figure 2.3: Entry Clearance Visas Granted (Excluding Visitor and Transit Visas), by World Area, UK, 2005–2014
Image .csv .xlsFigure 2.3 shows trends in visas granted (excluding visitor and transit visas) by world area since 2005. From the year ending September 2009 onwards those with an Asian nationality have accounted for the majority of visas and have driven the recent fluctuations in visa numbers. Asian nationals accounted for 290,343 (53%) of the 543,586 visas granted in the year ending September 2014, with China and India each accounting for 15% of the total.
The number of visas granted in the year ending September 2014, excluding visitor and transit visas, was 17,207 higher than in the year ending September 2013 (526,379). This included increases for India (up 6,021 or +8%), China (up 4,312 or +5%) and Libya (up 3,878 or +70%).
Although the above figures exclude visitor and transit visas, they will include some individuals who do not plan to move to the UK for a year or more as well as dependants. There is evidence that recent increases in visas granted have reflected higher numbers of short-term visas. The Home Office short story Entry Clearance Visas by Length, indicated that the increase from 2012 to 2013 in total visas granted, excluding visit and transit visas, was accounted for by higher numbers of short-term (less than 1 year) visas. Generally, trends in visas granted for work and study can provide an indicator for trends in long-term non-EU immigration, however, for a variety of reasons the series do not always move in line with each other, for example the visas granted data also include short-term migrants.
For more information see the Home Office Immigration Statistics July to September 2014 bulletin.
2.1 Immigration to the UK by main reason
The next sections of the MSQR describe the main reason for migration for long-term immigrants to the UK. Three quarters of immigration to the UK is accounted for by people migrating to work or for formal study (Figure 2.4). Changes in flows of people migrating for these reasons are affected by the differing rights of EU and non-EU citizens to migrate to the UK and by the impact of government policy.
Home Office visa statistics show that most of the 543,586 visas granted (excluding visitors and transit visas) to non-EEA nationals in the year ending September 2014 were for study (222,941, excluding student visitors) or for work (161,585). In addition, 75,525 student visitor and 34,747 family–related visas were granted.
IPS long-term immigration estimates for work and formal study broadly follow the same trends as visas granted for work and study. However, IPS estimates tend to be lower than the visa figures. A key reason for this is that IPS estimates exclude those individuals who intend to stay for less than 1 year. There has been analysis showing that in recent years the number of visas for less than 12 months duration has increased while longer-term visas have fallen.
Furthermore, the dependants of those granted a visa to work or study are included in the work and study visas figures, whereas the reason for migration for such individuals would be recorded as accompanying or joining others on the IPS.
Figure 2.4: Long-Term International Migration Estimates of Immigration to the UK, by Main Reason for Migration, 2004–2014 (Year Ending June 2014)

Source: Long-term International Migration - Office for National Statistics
Notes:
- Figures for 2014 are provisional.
- Up to YE Dec 09, estimates are only available annually.
- Acc/Join means accompanying or joining.
Download this image Figure 2.4: Long-Term International Migration Estimates of Immigration to the UK, by Main Reason for Migration, 2004–2014 (Year Ending June 2014)
.png (25.3 kB) .xls (33.3 kB)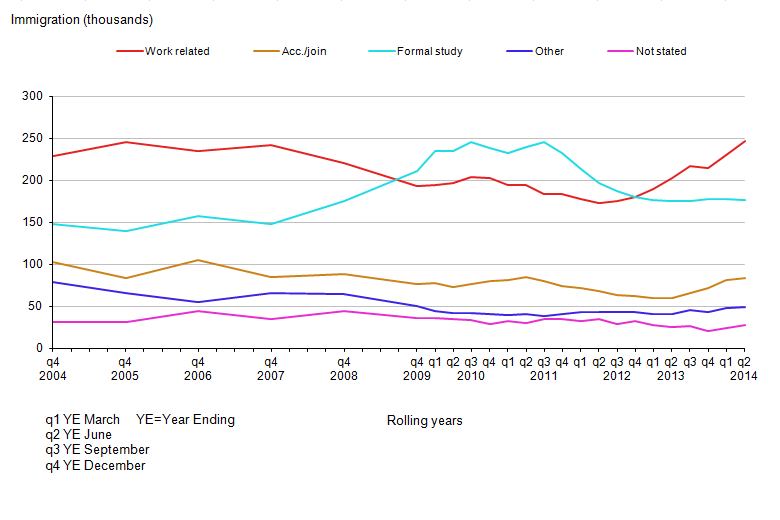
2.2 Immigration for work
The most commonly stated reason for immigration to the UK is work (Figure 2.4). This has been the case historically, with the exception of 2009 to 2012 when formal study was the most common main reason for immigration. LTIM estimates show that immigration for work peaked at around 240,000 per year in the years 2005 to 2007, the last year prior to the recent economic downturn, but then declined, reaching a low of 173,000 in the year ending June 2012.
All sources show that immigration for work has increased over the last year:
LTIM estimates show that in the year ending June 2014, 247,000 people migrated to the UK for work-related reasons. This is a statistically significant increase from 202,000 in the previous year, and is now higher than the previous peak in 2005. This increase has been driven by increases in immigration of EU15, EU2 and non-EU citizens for work, the latter two being statistically significant increases.
Labour market statistics from the Labour Force Survey (LFS) show that the number of non-UK nationals in employment increased by 230,000 (9%) to 2.9 million in July to September 2014 compared to the same quarter in the previous year (2.7 million). Employment of EU nationals increased by 16% to 1.7 million, while employment of non-EU nationals decreased by just under 1% to 1.2 million. The growth in overall employment over the last year was 692,000, and of this, 66% can be accounted for by a growth in employment for UK nationals.
The number of work visas granted to individuals applying from outside the UK continued to rise. There were 161,585 work visas granted, including dependants, in the year ending September 2014, an increase of 6% or 9,535, compared with the previous 12 months. The 9,535 increase in work-related visas was largely accounted for by higher numbers for skilled workers (Tier 2, +9,912 or +13%), and for Youth mobility and temporary workers (Tier 5, +2,207), together with 2,730 fewer grants in Tier 1 high value workers as a result of the Tier 1 Post-Study (-2,432) and Tier 1 General (-1,653) categories being closed to new entrants.
The 13% increase in skilled worker (Tier 2) visas granted coincided with a 13% increase in skilled work visa applications (52,214 in the year ending September 2014, main applicants). Most of these applications were for the Information and Communication (22,275), Professional, Scientific and Technical Activities (9,824), and Financial and Insurance Activities (6,255) sectors.
In the year ending September 2014, the number of new National Insurance Numbers (NINos) allocated to non-UK nationals was 668,000 (Fig 2.6), an increase of 70,000 (12%) on the previous 12 months. Allocations to EU nationals were 505,000, an increase of 83,000 (20%) compared to the previous 12 months, whilst allocations to non-EU nationals were 161,000, a decrease of 14,000 (8%) compared to the previous 12 months.
These data sources are not directly comparable with each other. Labour market statistics measure the stock of people working in the UK and do not necessarily align well with measures of migration flows such as IPS estimates and counts of NINo allocations and Visas granted. Furthermore there may be a lag of weeks, months or years between arrival in the UK and registration for a NINo. For more information on comparing data sources, see the MSQR Information for Users (364.6 Kb Pdf).
The latest IPS estimates (which exclude the adjustments made to derive LTIM estimates and therefore will not match LTIM estimates, show that around 59% of immigrants arriving for work were EU citizens, with around 24% non-EU citizens and a further 16% were British citizens. Non-EU citizens accounted for a much greater proportion of immigration for work, prior to the Accession of 10 countries to the EU in 2004 (including the EU8 countries). This reflects the increase in the numbers of EU citizens migrating to the UK for work since 2004, combined with a steady decrease in the numbers of non-EU citizens arriving for work over the same period (Figure 2.5). There has however been a recent increase in non-EU immigration for work, returning to a similar level to 2009.
Figure 2.5: Immigration to the UK for Work-Related Reasons by Citizenship, 2004-2014 (Year Ending June 2014).
Source: International Passenger Survey (IPS) - Office for National Statistics
Notes:
- Figures for 2014 are provisional.
Download this image Figure 2.5: Immigration to the UK for Work-Related Reasons by Citizenship, 2004-2014 (Year Ending June 2014).
.png (29.2 kB) .xls (32.8 kB)
EU immigration for work began to increase following the first recent EU Accession, from 65,000 in 2004, to 125,000 in 2007. There was a decline in EU immigration for work during 2008, particularly amongst EU8 citizens, following which it remained steady at around 90,000 until 2012. In the last year, EU immigration for work has begun to increase again. IPS estimates show that 141,000 EU citizens arrived to work in the year ending June 2014 – an increase, albeit not statistically significant, from 118,000 in the previous year, comprised of:
EU15 citizens – an increase to 69,000 from 59,000
EU8 citizens – remaining steady at 47,000
EU2 citizens – a statistically significant increase to 24,000 from 13,000
Approximately 58% of all EU immigrants arriving for work-related reasons have a definite job to go to. In 2004, 113,000 non-EU citizens arrived for work with an intention to remain more than 12 months. Since then this figure had steadily declined. However, the latest estimates show that there has been a statistically significant increase in non-EU immigration for work to 56,000 in the year ending June 2014 from 42,000 in the previous year (Figure 2.5).
National Insurance Number (NINo) allocations to overseas nationals
The number of NINos registered to non-UK nationals shows a peak of 797,000 in 2007 following a steady increase since 2004. Since then they have fluctuated around 600,000, falling to a low of 519,000 in 2012. Latest data shows there were 668,000 registrations in the year ending September 2014 (Fig 2.6). It should be noted that these patterns will also include short-term migrants and are not a direct measure of when a person immigrated to the UK, as those registering may have arrived to live in the UK weeks, months or years before registering.
Figure 2.6: National Insurance Number Allocations to Adult Overseas Nationals by World Area of Origin, UK, 2004–2014
Source: Department for Work and Pensions
Notes:
- Due to a change in the process of recording NINos during 2014 Q2, the volume of NINOs recorded in that quarter (and Year Ending total) were lower than would otherwise be the case.
- EU Accession countries here refers to the EU8, the EU2, Cyprus, Malta and Croatia (see Glossary). This definition applies to the full time series.
- The figures are based on recorded registration date on the National Insurance Recording and Pay as you Earn System, i.e. after the NINo application process has been completed. This may be a number of weeks or months (and in some cases years) after arriving in the UK.
Download this chart Figure 2.6: National Insurance Number Allocations to Adult Overseas Nationals by World Area of Origin, UK, 2004–2014
Image .csv .xlsTable 2 shows the top 15 nationalities for National Insurance number (NINo) allocations to adult overseas nationals for the year ending September 2014.
Table 2: New National Insurance number registrations to adult overseas nationals entering the UK - year ending September 2014
| Year to Sept 2014 total (thousands) | Year to Sept 2013 total (thousands) | Difference (thousands) | % Change to previous year | |
| Total | 667.5 | 597.7 | 69.8 | 12% |
| European Union | 504.9 | 421.5 | 83.4 | 20% |
| Non European Union | 161.4 | 175.7 | -14.3 | -8% |
| EU15 | 196.7 | 196.6 | 0.1 | 0% |
| EU8 | 169.6 | 193.5 | -23.9 | -12% |
| EU2 | 135.4 | 28.6 | 106.8 | 373% |
| Romania | 103.9 | 18.3 | 85.6 | 468% |
| Poland | 97.6 | 105.0 | -7.4 | -7% |
| Spain | 45.6 | 49.9 | -4.3 | -9% |
| Italy | 45.5 | 39.4 | 6.1 | 16% |
| Bulgaria | 31.5 | 10.3 | 21.2 | 205% |
| India | 29.5 | 30.7 | -1.2 | -4% |
| Portugal | 28.0 | 28.3 | -0.2 | -1% |
| France | 22.7 | 23.3 | -0.6 | -3% |
| Hungary | 21.3 | 26.1 | -4.8 | -18% |
| Rep of Lithuania | 19.3 | 26.2 | -6.9 | -26% |
| Rep of Ireland | 16.7 | 16.9 | -0.1 | -1% |
| Pakistan | 11.9 | 14.8 | -2.9 | -19% |
| China Peoples Rep | 11.3 | 11.9 | -0.6 | -5% |
| Slovak Rep | 11.1 | 12.2 | -1.1 | -9% |
| Germany | 10.8 | 11.4 | -0.5 | -5% |
| Source: Department for Work and Pensions | ||||
| Notes: | ||||
| 1. The figures are based on recorded registration date on the National Insurance Recording and Pay as you Earn System, i.e. after the NINo application process has been completed. This may be a number of weeks or months (and in some cases years) after arriving in the UK. | ||||
| 2. The data series include both short-term and long-term migrants. | ||||
| 3. The number of new registrations of NINos to non-UK nationals over a given period is not the same as the total number of non-UK nationals who hold a NINo. | ||||
| 4. The total number of non-UK nationals who have been allocated a NINo is not the same as the number of non-UK nationals working in the UK. This is because people who have been allocated NINos may subsequently have left the UK, or they may still be in the UK but have ceased to be in employment. | ||||
| 5. Some people arriving into the UK may already hold a NINo from a previous stay in the UK. Once a person has been allocated a NINo, they do not need to reapply in order to work in the UK. | ||||
Download this table Table 2: New National Insurance number registrations to adult overseas nationals entering the UK - year ending September 2014
.xls (29.2 kB)Increases in immigration for work among EU2 citizens are reflected in data on NINo registrations to adult overseas nationals from within the EU (Fig 2.6). NINos allocated to EU citizens show an increase of 20% to 505,000 in the year ending September 2014 from 422,000 in the year ending September 2013.
When immigration of EU8 citizens reached its peak of 112,000 in 2007, four out of every five arrived for work-related reasons. Nationals of the EU accession countries accounted for 46% of all new NINo allocations to non-UK nationals during the peak of 797,000 in 2007. Since 2008, immigration of EU8 citizens for work-related reasons has remained steady, usually between 40,000 and 50,000 per year.
The numbers of NINos allocated to EU Accession nationals has increased by 37% to 308,000 in the year ending September 2014 compared to 225,000 in the year to September 2013. Over the same period, the number of registrations to Romanian nationals increased from 18,000 to over 100,000 (a five-fold increase). Registrations to Bulgarian nationals increased from 10,000 to over 30,000 (a three-fold increase). It should be noted that these patterns will also include short-term migrants and are not a direct measure of when a person immigrated to the UK, as those registering may have arrived to live in the UK weeks, months or years before registering. For example, 50% of EU2 nationals registering for a NINo between January and September 2014, had arrived in the UK before 1 January 2014 i.e. before transitional controls were lifted.
Italian nationals increased 6,000 (16%) to 46,000. Registrations to Polish and Spanish nationals fell by 7% and 9% respectively.
The number of NINos allocated to nationals of countries in Asia and the Middle East continues to fall, standing at 84,000 in the year ending September 2014. This figure is less than half the peak of 218,000 NINos allocated to nationals of countries in Asia and the Middle East in the year ending December 2010.
Labour Market Statistics
The latest labour market statistics from the Labour Force Survey (LFS) show that the number of non-UK nationals in employment increased by 230,000 (9%) to 2.9 million in July to September 2014 compared to the same quarter in the previous year (2.7 million). Employment of EU nationals increased by 16% to 1.7 million, while employment of non-EU nationals decreased by just under 1% to 1.2 million. The growth in overall employment over the last year was 692,000, and of this, 66% can be accounted for by a growth in employment for UK nationals.
An estimated 167,000 EU2 citizens were employed in the UK in July to September 2014, an increase of 33% from the same quarter in the previous year. This compares to an increase of 4% to 683,000 for EU15 (excluding British) citizens and an increase of 25% to 839,000 for EU8 citizens. Labour market statistics are a measure of the stock of people working in the UK, rather than a measure of migration flows. Therefore, the increase in employment among EU8 citizens may be partially accounted for by those who were already resident in the UK taking up employment, or by short-term migrants taking up employment.
Overall the IPS and LFS estimates and NINo allocations data all provide evidence that there has been increased immigration for work amongst EU citizens. IPS estimates suggest that this increase has been predominantly among EU15 and EU2 citizens. Labour market statistics are showing increased levels of employment across all EU groupings, with the greatest increases among EU2 and EU8 citizens.
The full picture of EU2 migration following the lifting of labour market restrictions on 1 January 2014 will become clearer over the next 6 months. However, the current evidence suggests that there has been an increase in immigration of EU2 citizens, mainly for work. This increase began in 2013 prior to the lifting of restrictions, and has continued into 2014.
Work-related visas (Non-EEA nationals)
The steady decline in IPS estimated numbers of non-EU citizens immigrating for at least 12 months to work from 113,000 in 2004 to a low of 42,000 in the year ending June 2013, and has since increased by a third to 56,000 in the year ending June 2014. A similar pattern has been seen in the numbers of work-related visas granted to non-EEA nationals (which fell from 249,634 in 2006 to a low of 141,752 in the year ending March 2014, and have since risen reaching 161,585 in the year ending September 2014).
There was a 9,535 increase in work-related visas in the year ending September 2014 compared with the previous 12 months. This increase was largely accounted for by higher numbers for skilled workers (Tier 2, +9,912 or +13%), and for Youth mobility and temporary workers (Tier 5, +2,207), together with 3,730 fewer grants in Tier 1 high value workers as a result of the Tier 1 Post-Study (-2,432) and Tier 1 General (-1,653) categories being closed to new entrants.
There is evidence that recent increases in visas granted have reflected higher numbers of short-term visas, which would not be reflected in long-term international migration estimates (see the Home Office short story Entry Clearance Visas by Length. Further information on migration for work can be found in the Home Office topic report on Work.
2.3 Immigration for study
LTIM estimates show that over the last decade, there have been changes in the number of people migrating to the UK for formal study. Around 140,000 to 150,000 long-term migrants arrived in the UK annually to study during the early 2000s. This started to increase from 2008 to a two-year plateau of around 240,000 in 2010 and 2011. Since then the overall number has steadily declined and recently levelled to 176,000 in the year ending June 2014. IPS estimates show that over 70% of long-term immigrants to the UK for study are non-EU citizens.
The number of study visas (excluding student visitors) granted to individuals applying from outside the UK continued to rise. There were 222,941 study visas granted, including dependants, in the year ending September 2014, an increase of 3% or 6,140, compared with the previous 12 months. The 6,140 increase included higher numbers of study visas granted for Chinese (+2,286 or +4%), Brazilian (+2,323 or +70%), Saudi Arabian (+1,140 or +12%) and Libyan (+1,061 or +39%) nationals. There were also falls for Indian (-828 or -6%) and Nigerian (-782 or -12%) and Pakistani (-506 or -10%) nationals.
Over the same period, there was a corresponding 2% increase in university-sponsored study visa applications (main applicants only) to 171,081 in the year ending September 2014, and falls for the numbers sponsored by other education sectors. The number of applications sponsored by the further education sector continued to fall, by 13% (see Figure 2.7).
IPS estimates show that the number of New Commonwealth citizens, which includes the Indian sub-continent, coming to the UK to study in the year ending June 2014 was 34,000. This is around its lowest level since 2002 and less than one-third of the peak of 108,000 in the year ending June 2011. Immigration for formal study from the Other Foreign citizenship group, which includes China, has been relatively stable over the last four years and was estimated to be 86,000 in the year ending June 2014. EU15 immigration for formal study increased to 27,000 in the year ending June 2014, a statistically significant increase from 17,000 in the previous year. This is a return to the level seen in the year ending June 2012.
Figure 2.7: Study-related sponsored visa applications by sector, 2010-2014
Source: Home Office
Notes:
- Universities are 'recognised bodies' (meaning that it has its own UK degree-awarding powers), or bodies in receipt of public funding as a Higher Education Institute (HEI). Institutions (including Further Education colleges) which receive some public funding to deliver higher education courses do not fall within this definition of an HEI. They are UK-based. Further Education contains the remainder of sponsors who described themselves as ‘University and tertiary’, plus those who described themselves as ‘Private Institution of Further or Higher Education’ or whose self-description included ‘Further Education’ or ‘Higher Education’. This includes a small number of foreign-based universities but these account for very small numbers of CAS used.
- The chart excludes sponsored visa applications from a small number of other sponsors.
Download this chart Figure 2.7: Study-related sponsored visa applications by sector, 2010-2014
Image .csv .xlsFor more information on immigration to the UK for study, see the Home Office topic report on Study.
2.4 Immigration for other reasons
Reasons for migrating other than work or study include accompanying or joining family or friends, asylum and returning home to live.
LTIM estimates show that the third most common reason for migrating to the UK is to accompany/join others. In the year ending June 2014, 84,000 long-term migrants arrived in the UK to accompany or join others, a statistically significant increase from 60,000 in the previous year (Figure 2.4). LTIM estimates show that immigration to accompany/join others peaked at 105,000 in 2006, prior to the recent economic downturn, but then declined reaching a low of 59,000 in the year ending March 2013. Recent increases represent a return to levels similar to those in 2011. There was a statistically significant increase in immigration of Other Foreign citizens to accompany/join others to 29,000 in the year ending June 2014 from 13,000 in the previous year.
As would be expected, the vast majority (19,000) of the 20,000 immigrants who stated ‘Going home to live’ as their reason for immigrating were British.
Family visas (Non-EEA nationals)
In the year ending September 2014, 34,747 family-related visas were granted. This is an increase of 5% compared with the year ending September 2013 (33,240). There was a 2% increase in the number of visas granted to all other dependants (excluding visitor visas) joining or accompanying migrants in the UK (76,658) compared with the previous 12 months (75,172). So in all there was an increase of just under 3,000 in visas for family reasons or for dependants.
The increase in IPS estimates of Other Foreign citizens arriving in the UK to accompany/join others noted above is much more pronounced than the increase in family route visas granted. There are a number of possible explanations for this, notably that the visa figures also include people staying in the UK for less than 12 months. Additionally, dependants of those granted work or study visas will be included in the figures for work and study visas, rather than in the family visa figures. By contrast, a person arriving to accompany or join someone who themselves is in the UK to work or study, is included in the accompany/join estimates in the IPS. Furthermore, as explained in the accuracy section, IPS estimates for groups with very specific characteristics (e.g. Other Foreign citizens arriving to accompany/join others) are based on a relatively small sample and therefore will have comparatively large confidence intervals associated with them.
Further information on visas granted for family reasons has been published by the Home Office.
Asylum applications
There were 24,257 asylum applications in the year ending September 2014, an increase of 2% compared with the previous 12 months (23,805). The largest number of applications for asylum were from nationals of Eritrea (2,932), followed by Pakistan (2,891), Iran (1,999) and Syria (1,802).
Applications for asylum peaked in the year ending December 2002 (84,132) but now typically account for only 5% of long-term inflows.
Grants rates for asylum, a form of temporary protection or other type of grant vary between nationalities. For example, 83% of the total decisions made for nationals of Eritrea were grants, compared with 20% for Pakistani nationals, 54% for Iranian nationals and 84% for Syrian nationals.
Further information on asylum has been published by the Home Office.
Back to table of contents6. Emigration from the UK
The latest emigration estimate for the year ending June 2014 was 323,000 with a confidence interval of +/- 22,000. Recently levels of emigration have remained very stable, and well below the most recent peak of 427,000 in 2008.
British citizens accounted for just over 40% of emigrants in the year ending June 2014 (133,000). Emigration of British citizens has remained at around the same level since 2010, having fallen from the peak of 207,000 in 2006 (Figure 3.1).
The estimated number of non-EU citizens emigrating from the UK in the year ending June 2014 was 105,000, a figure very similar to the previous year (103,000).
The estimated number of EU citizens (excluding British) emigrating from the UK was 86,000 in the year ending June 2014, which is similar to the estimated 77,000 EU citizens who emigrated in the previous year. IPS estimates (which do not include all of the adjustments in LTIM estimates, and therefore may not sum to LTIM totals) show that emigration amongst the various EU citizenship groups has been stable over the last few years with 59% (48,000), 33% (27,000) and 5% (4,000) of EU emigration accounted for by EU15, EU8 and EU2 citizens respectively in the year ending June 2014.
Figure 3.1: Emigration from the UK by Citizenship, 2004-2014 (Year Ending June 2014)

Source: Long-term International Migration - Office for National Statistics
Notes:
- Figures for 2014 are provisional.
- This chart is not consistent with the total revised net migration estimates as shown in Figure 1.1. Please see guidance note for further information.
Download this image Figure 3.1: Emigration from the UK by Citizenship, 2004-2014 (Year Ending June 2014)
.png (22.4 kB) .xls (31.2 kB)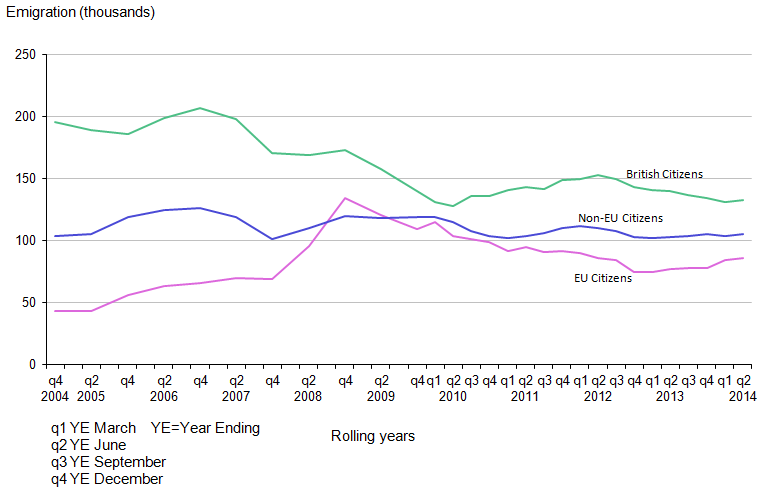
In the latest available provisional LTIM estimates for the year ending June 2014, work-related reasons continue to be the main reason given for emigration and account for 56% of emigrants. An estimated 182,000 people emigrated from the UK for work-related reasons in the year ending June 2014, a similar figure to the previous year (187,000) (Figure 3.2).
Of the 33,000 emigrants who stated their main reason for migration as ‘going home to live’, 22,000 were EU citizens and 11,000 were citizens of non-EU countries. The peak of people leaving the UK to return home was in 2008 when 62,000 emigrated for this reason. This peak coincides with the start of the economic downturn.
Figure 3.2: Long-Term International Migration Estimates of Emigration from the UK, by Main Reason, 2004–2014 (Year Ending June 2014)

Source: Long-term International Migration - Office for National Statistics
Notes:
- Figures for YE March 14 and YE June 14 are provisional.
- Up to YE Dec 09, estimates are only available annually.
- It should be noted that reasons for emigration will not necessarily match reasons for intended immigration. For example, someone arriving for study may then leave the UK after their course for work-related reasons.
- Acc/Join means accompanying or joining.
Download this image Figure 3.2: Long-Term International Migration Estimates of Emigration from the UK, by Main Reason, 2004–2014 (Year Ending June 2014)
.png (24.8 kB) .xls (32.3 kB)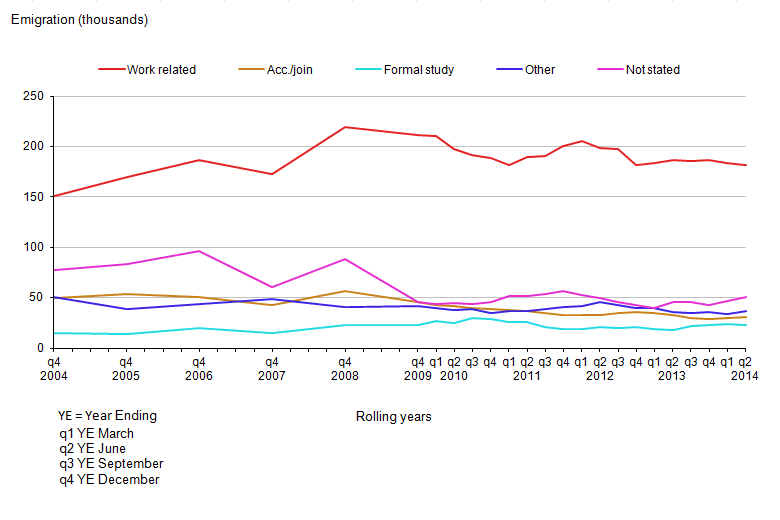
Home Office Research Report 68, published in November 2012, presents information from academic research and surveys drawn together to present key aspects of long-term emigration from the United Kingdom. This includes recent outward migration and some trends over the last 20 years, separately for British, European Union (EU) and non-EU citizens.
The report considers where emigrants go, how long for, and their motivations. The evidence suggests emigration is mainly for work, and that key destinations for British citizens are Australia, Spain, the United States, and France. Reasons and drivers for emigration from the UK appear to vary across citizenship groups. While many factors influence emigration, the report says that British and EU citizen emigration appears to be associated with changes in unemployment and exchange rates. This is less apparent for non-EU citizens.
3.1 People emigrating from the UK by previous main reason for immigration
In 2012 a new question was added to the IPS asking current emigrants, who had previously immigrated to the UK, about their main reason for migration at the time that they immigrated.
In the year ending June 2014, IPS data (which exclude the adjustments made to derive LTIM estimates and therefore will not match LTIM estimates) show that 303,000 individuals emigrated from the UK. These comprised 101,000 ‘new’ long-term emigrants (individuals who had not previously lived away from the UK for 12 months or more), and 202,000 long-term emigrants who had formerly immigrated to the UK.
Figure 3.3: Outflow of migrants, who are former immigrants to the UK, by citizenship and previous main reason for immigration (year ending June 2014)
Source: International Passenger Survey (IPS) - Office for National Statistics
Notes:
- Figures are provisional.
- Work-related reasons is the sum of definite job and looking for work.
Download this chart Figure 3.3: Outflow of migrants, who are former immigrants to the UK, by citizenship and previous main reason for immigration (year ending June 2014)
Image .csv .xlsWork-related reasons and formal study were the two most common previous main reasons for immigrating to the UK, reported by those former immigrants who emigrated in the year ending June 2014, at 82,000 (41%) and 73,000 (36%) respectively. It should be noted that these emigration flows reflect inward flows in previous years and not the current year.
An estimated 14,000 (7%) had previously immigrated to the UK to accompany or join another person, whilst 34,000 (17%) had previously immigrated for other reasons or did not state their previous reason for immigration.
Of those who had previously immigrated to the UK for work-related reasons, 45,000 (55%) were EU citizens, 14,000 (17%) were citizens of the Old or New Commonwealth, and 11,000 (13%) were citizens of other foreign countries.
Of the 73,000 emigrants who had previously immigrated to the UK for formal study, 18,000 (25%) were EU citizens, 21,000 (29%) were citizens of the Old or New Commonwealth and 30,000 (41%) were Other Foreign citizens.
Back to table of contents7. Where are people migrating to or migrating from?
This section (for November’s publication only) contains information on where people are migrating to and where they have migrated from. It includes final LTIM data on migration by UK area, country of origin for immigrants and country of destination for emigrants.
4.1 Migration by UK Area
The Annual Population Survey and data from the Northern Ireland Statistical Research Agency are used with International Passenger Survey data to provide estimates of Long-Term International Migration into and out of areas within the UK. Of the constituent countries of the UK, the vast majority of immigrants arrive to live in England. In 2013, 462,000 immigrants arrived to live in England, which is 88% of the total 526,000 immigrants to the UK. The relative proportions of immigrants arriving in Wales, Scotland and Northern Ireland are 4%, 6% and 2% respectively.
Within England, 140,000 people immigrated to London, a slight but not a statistically significant increase, compared to 2012. Immigration to London remains at a relatively low level compared to other years since the late 1990s. In 2013 the South East (62,000) received the largest numbers of immigrants outside London. In total, London and the South East received 38% of all immigrants to the UK in 2013. This is similar to previous years.
The East and North West regions received the highest number of immigrants outside London and the South East with 56,000 and 51,000 respectively.
England also had the largest number of emigrants in 2013. 272,000 people emigrated from England to countries outside the UK, which is 86% of all emigrants from the UK. Wales, Scotland and Northern Ireland had 3%, 8% and 3% of emigrants from the UK respectively.
In 2013 England had a net international migration of 189,000, an increase from 158,000 in the previous year. Wales also saw an increase in net migration to 14,000 from 8,000; this is the highest ever estimate of net migration to Wales. By contrast, Scotland saw a decrease in net migration to 4,000 in 2013 compared to 14,000 in 2012. Northern Ireland had net migration of 2,000 in 2013, compared to -2,000 in 2012. None of the noted changes in net migration for the four constituent countries of the UK were statistically significant.
4.2 Where did migrants to the UK previously live?
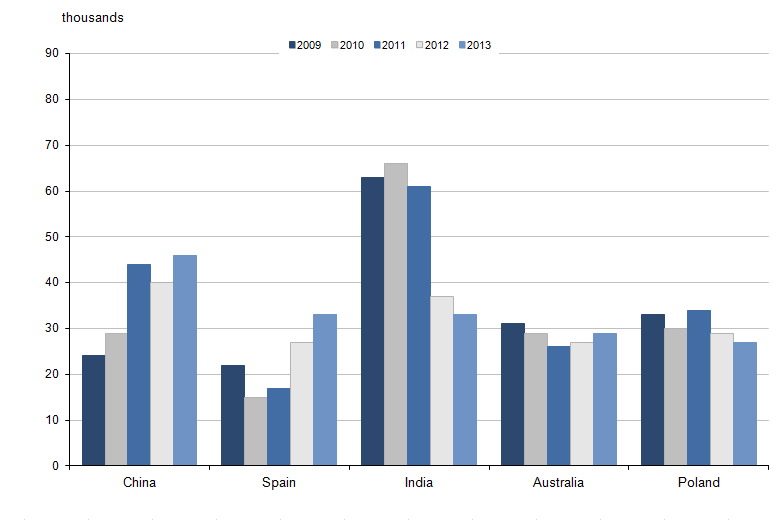
International Passenger Survey estimates show that immigrants came to the UK from many different countries. The top five countries of origin for 2013 are China (46,000 or 9% of all immigrants), Spain (33,000 or 7% of all immigrants), India (33,000 or 7% of all immigrants), Australia (29,000 or 6% of all immigrants) and Poland (27,000 or 6% of all immigrants).
China continues to be the top country of last residence for immigrants to the UK for the second year running. Spain has moved up into second place from sixth place in 2012. India is now the third most popular country of last residence, having been top in 2011 with an inflow of 61,000 (Figure 4.2). Australia has been in the top 5 most common countries of last residence every year since 1975, whilst Poland has been in the top 5 every year since 2005.
Figure 4.2 Immigration from most common countries of last residence in 2013, 2009-2013
Source: International Passenger Survey (IPS) - Office for National Statistics
Download this image Figure 4.2 Immigration from most common countries of last residence in 2013, 2009-2013
.png (15.2 kB) .xls (37.4 kB)
Country of last residence will not necessarily reflect nationality. For example, around 27% of immigrants arriving from Spain and 62% of those arriving from Australia were British citizens in 2013, while the proportions of those arriving from China (2%), India (3%) and Poland (0%) who were British citizens were very small.
4.3 Where do emigrants from the UK intend to live?
Australia remains the most popular country of destination for emigrants from the UK. In 2013, International Passenger Survey estimates show that 43,000 emigrants from the UK intended to live in Australia. This accounts for 15% of all emigrants. The remaining top countries of next residence are USA (23,000 or 8% of all emigrants), Spain (16,000 or 5% of all emigrants), China (16,000 or 5% of all emigrants), and France (15,000 or 5% of all emigrants).
There has been a slight, but not a statistically significant, increase in emigration to Spain to 16,000 in 2013 from 12,000 in 2012, making Spain the third most common country of next residence. China and France remain the fourth and fifth most common countries of next residence with an unchanged number of emigrants leaving the UK to these countries in 2013 compared to 2012. There was a slight, but not a statistically significant, decrease in emigration to India to 13,000 in 2013 from 17,000 in 2012, making it the seventh most common country of next residence (Figure 4.3).
Figure 4.3: Emigration to most common destinations of next residence in 2013, 2009-2013

Source: International Passenger Survey (IPS) - Office for National Statistics
Download this image Figure 4.3: Emigration to most common destinations of next residence in 2013, 2009-2013
.png (13.7 kB) .xls (30.7 kB)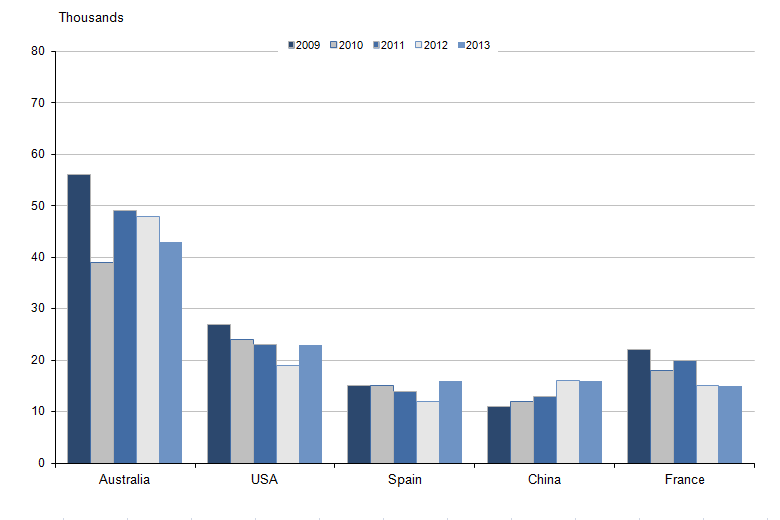
Of those who emigrated to Australia in 2013, around 79% were British citizens. Similarly British citizens comprised around half of those who emigrated to the USA (52%), Spain (56%) and France (47%). An estimated 13% of those emigrating to China were British citizens.
Back to table of contents8. List of products
The following are URL links to the products underlying this report, or otherwise associated with the co-ordinated migration release of 27 November 2014. The department releasing each product is indicated.
The MSQR User Information (ONS) (364.6 Kb Pdf) - guidance on interpreting confidence intervals, the difference between provisional and final estimates, and the comparability and quality of input data sources.
International Migration Statistics First Time User Guide (ONS) (205 Kb Pdf) – an introduction to the key concepts underpinning migration statistics including basic information on definitions, methodology, use of confidence intervals and information on the range of available statistics related to migration.
Guidance on revised net migration statistics (ONS) (55.9 Kb Pdf) – information for users on how to interpret the revised net migration estimates alongside published LTIM estimates.
Long-term international migration – frequently asked questions and background notes (ONS) (269.9 Kb Pdf) – information on recent trends in migration, methods and coverage, comparisons to international migration estimates, a complete list of definitions and terms and a guide to the published tables.
Quality and Methodology Information for International Migration (ONS) (245.4 Kb Pdf) – information on the usability and fitness for purpose of long-term international migration estimates.
Long-term international migration estimates methodology (ONS) (1.28 Mb Pdf) – a detailed methodology document for LTIM estimates, including information on current methodology and assumptions, data sources including the International Passenger Survey and changes to the methodology since 1991.
International Passenger Survey: Quality Information in Relation to Migration Flows (ONS) (324.8 Kb Pdf) – an overview of the quality and reliability of the International Passenger Survey (IPS) in relation to producing long-term international migration estimates.
Local Area Migration Indicators Suite (ONS) – This is an interactive product bringing together different migration-related data sources to allow users to compare indicators of migration at local authority level. This product is updated annually in August.
Population by country of birth and nationality (ONS) – This short report focuses on annual and regional changes in the UK resident population by nationality and country of birth for the year ending December 2013. The product is published annually in August.
Short-term International Migration annual report (ONS) – A report and tables detailing estimates of short-term migration to and from the UK for England and Wales for the year ending Mid-2012. The product is published annually in May.
Quarterly releases on 27 November 2014:
Provisional Long-Term International Migration, year ending June 2014 (ONS)
Immigration Statistics July – September 2014 (Home Office)
National Insurance Number (NINo) Allocations to Adult Overseas Nationals to September 2014 (DWP)
Annual releases on 27 November 2014:
Additional useful links:
Labour Market Statistics - November 2014 (ONS). This includes estimates of the number of people in employment in the UK by country of birth and nationality.
Quality of Long-Term International Migration estimates from 2001-2011 (ONS) (1.04 Mb Pdf)
International Migration Timeline (ONS)
Final Long-Term International migration (2013) (ONS)
Migrant Journey report 4 (Home Office)
Back to table of contents9. Future releases
The quarterly migration release dates in 2015 are:
Thursday 26 February
Thursday 21 May
Thursday 27 August
Thursday 26 November
The November 2015 release will contain the final long-term international migration estimates for the calendar year 2014.
Back to table of contents