1. Key points
A newborn baby boy could expect to live 78.9 years and a newborn baby girl 82.7 years if mortality rates remain the same as they were in the United Kingdom (UK) in 2011-2013 throughout their lives
Life expectancy at birth has increased by 6.3 hours per day since 1980-1982 for males, and by 4.6 hours per day for females in the UK
The most common age at death was 86 for men and 89 for women in 2011-2013
In 2011-2013 a man in the UK aged 65 had an average further 18.3 years of life remaining and a woman 20.8 years
2. Summary
ONS has released today the 2011-2013 national life tables for the United Kingdom (UK) and each of the constituent countries. These tables provide period life expectancy for males and females by single year of age (0 to 100), for three-year rolling periods. Also available in this release are the life tables for the years 1980-1982 to 2010-2012; this provides a continuous time series in a single publication. These were last published on 21st March 2014.
Back to table of contents3. Introduction
ONS produces national life tables which are for the UK and constituent countries and give statistics on period life expectancy by age and sex. National life tables are produced annually and are based on three consecutive years’ worth of data to reduce the effect of annual fluctuations in the number of deaths caused by seasonal events such as flu. Fully graduated (smoothed) life tables have been prepared every ten years (decennial life tables), based on the three years of data around a census year.
National life tables are ‘period’ life tables and therefore all figures referred to in this bulletin are ‘period’ life expectancies. Period life expectancy is the average number of additional years a person would live if he or she experienced the age-specific mortality rates of the given area and time period for the rest of their life. Therefore it is not the number of years someone in the area in that time period is actually likely to live, because the death rates of the area are likely to change over time.
The national life tables provide annual figures allowing up-to-date analysis of mortality and life expectancy. Key uses for these data can be found in the section 'Uses of life tables'.
This statistical bulletin will focus on the UK as a whole and the constituent countries. The figures in this release have been calculated using the latest available mid-year estimates.
Back to table of contents4. Methods
The life table is a purely hypothetical calculation. The basic assumption is that the given number of births, an arbitrary number called the radix (ONS uses 100,000), are subject as survivors pass through each year of age, to the mortality rates prevailing for each age.
The national life tables are produced annually for the UK and its constituent countries. The tables in this release were previously known as the Interim Life Tables, but no changes have been made to the way the tables are calculated. Each table is based on the population estimates and birth and death registration data for a period of three consecutive years. Period life tables are calculated using age-specific mortality rates for a given period, with no allowance for any actual or projected future changes in mortality. The notation required to calculate life tables is available in the guide to calculating national life tables.
Life expectancy is the average number of years a person has before death. This is conventionally calculated from birth, but can also be calculated from any specified age. This gives the remaining further number of years a person on average can expect to live given the age they have attained. This means that period life expectancy at birth for a given time period and area is an estimate of the average number of years a newborn baby would survive if he/she experienced the particular area’s age-specific mortality rates for that time period throughout his/her life.
Life expectancies that allow for actual or projected changes in mortality during a person’s lifetime are known as ‘cohort’ life expectancies. ONS also produces historic and projected period and cohort life expectancy tables that are consistent with the national population projections.
This release relates to the 1980-82 to 2011-13 national life tables for the UK and constituent countries.
Back to table of contents5. Life expectancy at birth
United Kingdom
A newborn baby boy in the UK could expect to live 78.9 years and a newborn baby girl 82.7 years if mortality rates remain the same as they were in 2011-2013 throughout their lives.
Figure 1: Life expectancy at birth, United Kingdom, 1980-1982 to 2011-2013
Source: Office for National Statistics
Download this chart Figure 1: Life expectancy at birth, United Kingdom, 1980-1982 to 2011-2013
Image .csv .xlsFigure 1 shows how life expectancy at birth in the UK has changed over time. It has consistently increased, from 70.8 years for males and 76.8 years for females in 1980-1982 to 78.9 years for males and to 82.7 years in 2011-2013. These are increases of about 6.3 hours per day for males and 4.6 hours per day for females.
Women continue to live longer than men, but the gap has been closing. Although both sexes have shown annual improvements in life expectancy at birth, over the past 31 years the gap has narrowed from 6.0 years to 3.8 years, with males demonstrating faster improvements in mortality compared to females.
Comparing the UK constituent countries
Life expectancy in all four countries has risen since 1980-1982. In England life expectancy at birth has risen to 79.2 years for males and 83.0 years for females, the highest of all constituent countries in 2011-2013. Life expectancy for 2011-2013 in Wales has reached 78.2 years for males and 82.2 years for females while in Northern Ireland it has reached 78.0 years for males and 82.3 years for females. Males in Scotland have a life expectancy at birth of 76.8 years and for females it is 80.9 years, the lowest of all constituent countries in 2011-2013.
In Scotland and in Wales the increases in life expectancy at birth since 1980-1982 have just under eight years for males and six years for females. In England there has been a gain of eight years for males and six years for females. The greatest gains have been seen in Northern Ireland where male life expectancy has increased by 8.8 years and female life expectancy by 6.8 years since 1980-1982. The gains in life expectancy at birth over the 31 year period since 1980-1982 have been higher for males than females in all four countries.
Figure 2: Life expectancy at birth, England, Wales, Scotland and Northern Ireland 1980-1982 to 2011-2013
Source: Office for National Statistics
Download this chart Figure 2: Life expectancy at birth, England, Wales, Scotland and Northern Ireland 1980-1982 to 2011-2013
Image .csv .xlsFigure 2 shows that life expectancy at birth in England has been consistently higher than life expectancy at birth in Wales, Scotland and Northern Ireland for both males and females throughout the time period 1980-1982 to 2011-2013. For both males and females life expectancy at birth in Northern Ireland was lower than in Wales until the mid 1990s, after which they have converged with each other. Both countries have seen some divergence from England in recent years.
For females, those in Scotland have experienced the lowest life expectancy at birth throughout the time period, with increasing divergence from the other constituent countries. Throughout the 1980s and 1990s the difference between life expectancy at birth in England and Scotland was less than two years, but since 2006-2008 it has been more than two years.
For males the story is broadly similar. Scottish males had the lowest life expectancy at birth of all the constituent countries throughout the 31 year period, while England had the highest. Male life expectancy at birth in Northern Ireland converged with Welsh life expectancy at birth in 1995-1997; they remain broadly similar in 2011-2013. The largest difference between male life expectancy in Scotland and England was observed in 2006-2008 at just under three years. In 2011-2013 male life expectancy at birth was 2.4 years lower for Scotland than for England.
The continued increases in life expectancy seen since the 1980s for both males and females in all of the UK constituent countries are due to the improvements in mortality at older ages. As mortality improves at older ages, larger numbers of people survive to the oldest ages and this contributes to the ageing populations of England, Wales, Scotland and Northern Ireland.
Scotland continues to have the lowest life expectancy at birth of all the constituent countries for both males and females. This could be associated with higher levels of alcohol consumption, a greater smoking prevalence and higher levels of cardio-vascular diseases in Scotland compared to the other constituent countries of the UK1.
Notes for life expectancy at birth
- Scottish health survey - UK comparisons: The Scottish Government, 2010.
6. Life expectancy at older ages
Life expectancy at age 65
Life expectancy at age 65 for men in the UK has reached 18.3 years and for women it has reached 20.8 years in 2011-2013.
Table 1 shows how life expectancy at age 65 in the UK has improved over time. For men it has risen by 5.4 years since 1980-1982 when it was 13.0 years. Women have seen a smaller increase of 3.9 years since 1980-1982 when it was 16.9 years.
The difference between male and female life expectancy at age 65 has decreased over the last 31 years from 4.0 years in 1980-1982 to 2.5 years in 2011-2013. Male life expectancy at age 65 has improved at a faster rate compared to females, but males have not yet reached the life expectancy we observe for females at age 65. Male life expectancy at age 65 in 2011-2013 is similar to female life expectancy at age 65 in 1996-1998.
Table 1: Life expectancy at age 65, United Kingdom and constituent countries, 1980-82, 1996-1998 and 2011-2013
| 1980-1982 | 1996-1998 | 2011-2013 | ||||
| Males | Females | Males | Females | Males | Females | |
| United Kingdom | 13 | 16.9 | 15 | 18.4 | 18.3 | 20.8 |
| United Kingdom | 13.1 | 17 | 15.1 | 18.5 | 18.5 | 21 |
| Wales | 12.5 | 16.6 | 14.8 | 18.2 | 18 | 20.5 |
| Scotland | 12.3 | 16 | 14.1 | 17.4 | 17.1 | 19.5 |
| Northern Ireland | 12.5 | 16.3 | 14.7 | 18.3 | 17.9 | 20.5 |
| Source: Office for National Statistics | ||||||
Download this table Table 1: Life expectancy at age 65, United Kingdom and constituent countries, 1980-82, 1996-1998 and 2011-2013
.xls (29.2 kB)In 2011-2013 life expectancy at age 65 in England reached 18.5 years for men and 21.0 years for women, the highest of all the constituent countries. England has had the highest life expectancy at age 65 throughout the time period 1980-1982 to 2011-2013. Men and women in Wales and Northern Ireland have experienced similar life expectancy at age 65 to each other throughout the time period.
Table 1 shows that Scotland has the lowest life expectancy at age 65 for both men and women in 2011-2013 at 17.1 years and 19.5 years respectively. Scottish life expectancy has been consistently lower throughout the time period and has diverged away from the other constituent countries. In 1980-1982 female life expectancy at age 65 in Scotland was 0.3 years lower than the next lowest country (Northern Ireland). In 2011-2013, this gap increased to one year lower than the next lowest countries of female life expectancy (Northern Ireland and Wales). Life expectancy at age 85
A man in the UK aged 85 had a life expectancy of 5.8 years in 2011-2013. For women the equivalent figure was 6.8 years.
Figure 3: Life expectancy at age 85, United Kingdom and constituent countries, 1980-1982 to 2011-2013
Source: Office for National Statistics
Download this chart Figure 3: Life expectancy at age 85, United Kingdom and constituent countries, 1980-1982 to 2011-2013
Image .csv .xlsFigure 3 shows life expectancy at age 85 for the UK and for each of the constituent countries. Life expectancy at age 85 has improved for both men and women in the UK and in each of the constituent countries. From 1980-1982 to 2011-2013 it has increased in the UK by 1.5 years for males and 1.4 years for females. Northern Ireland has seen the smallest increase, of just one year in life expectancy at this age over the 31 year period. The trend for Northern Ireland is the most erratic of the UK constituent countries; this is due to the low numbers of deaths and population at these ages.
The gap between life expectancy in the UK at age 85 for men and women has remained fairly consistent; in 1980-1982 the difference was one year, this increased to 1.2 years for most of the 1990s and has fallen to one year again in 2011-2013. A similar pattern is observed in each of the constituent countries.
Back to table of contents7. Surviving to older ages
Table 2 gives the percentage increases in life expectancy at birth, at age 65 and at age 85, between 1980-1982 and 2011-2013 in the UK. It shows that the percentage change in life expectancy between 1980-1982 and 2011-2013 was greater at ages 65 and 85 than for life expectancy at birth for both males and females and in each of the countries. For women the percentage increase in life expectancy at age 85 was greater than or similar to age 65 and at birth in all but Northern Ireland, where the larger increase is at age 65 (26%). For men the greatest percentage increase in life expectancy was at age 65 (around 41% for the UK) with Wales showing the largest increase at 44%. Although life expectancy is lower for males than females, males have experienced larger improvements at all ages. The greater increases at older ages add to evidence that increasing life expectancy over the last few decades is mostly due to the improving mortality rates at older ages.
Table 2: Percentage increase in life expectancy, United Kingdom and constituent countries, 1980-1982 to 2011-2013
| Life expectancy at birth | Life expectancy at age 65 | Life expectancy at age 85 | ||||
| Males | Females | Males | Females | Males | Females | |
| United Kingdom | 11% | 8% | 41% | 23% | 34% | 26% |
| England | 11% | 8% | 41% | 24% | 34% | 27% |
| Wales | 11% | 8% | 44% | 23% | 32% | 25% |
| Scotland | 11% | 7% | 39% | 22% | 31% | 22% |
| Northern Ireland | 13% | 9% | 43% | 26% | 22% | 19% |
| Source: Office for National Statistics | ||||||
Download this table Table 2: Percentage increase in life expectancy, United Kingdom and constituent countries, 1980-1982 to 2011-2013
.xls (28.7 kB)As life expectancy improvements are happening at older ages, the proportion of deaths occurring at older ages is also increasing and we see increases in the age where the most deaths occur. In 1980-1982 the most common age at death (in the life table) was at age 77 for men and 84 for women, while in 2011-2013 this had increased to 86 and 89. The gap between the most common age at death for men and women has therefore decreased from seven years to just three years over the 31 year period.
In 2011-2013 more than a third (39%) of male deaths occurred at ages 85 and above. In 1980-1982 this was just 14%, demonstrating that males in the UK are surviving to and dying at older ages in more recent years. In 2011-2013 female deaths at age 85 and above accounted for 52% of all female deaths; up from 31% in 1980-1982 demonstrating a similar trend.
Figure 4 shows the survival curves for males and females in the UK for 1980-1982 and 2011-2013. The proportions surviving to older ages (in the life table) have improved for both males and females. For example, the age at which the proportion of the life table population falls below 90% has risen by eight years for males, from age 54 in 1980-1982 to 62 in 2011-2013; females have experienced a similar increase from age 60 in 1980-1982 to 67 in 2011-2013. The male survival curve for 2011-2013 is very similar to the female curve for 1980-1982, showing that males still have the possibility of further improvements in the future.
Figure 4: Number of survivors in the life table (lx) by age and sex, UK, 1980-1982 and 2011-2013

Source: Office for National Statistics
Download this image Figure 4: Number of survivors in the life table (lx) by age and sex, UK, 1980-1982 and 2011-2013
.png (24.6 kB) .xls (35.8 kB)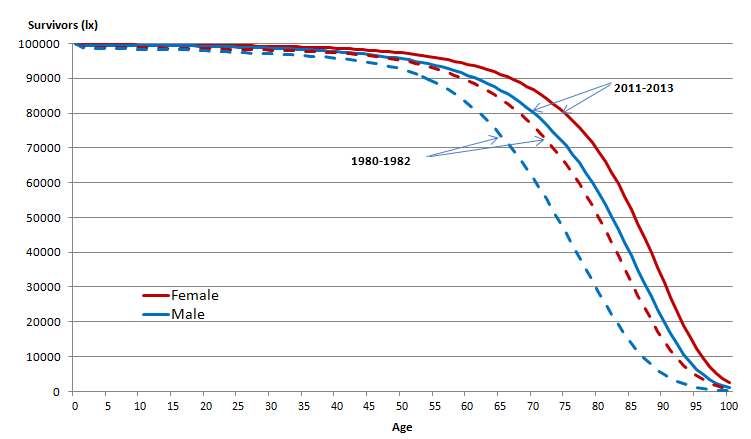
Mortality rates at older ages are thought to be improving because of a combination of factors. These include the improvements in mortality from circulatory diseases, such as heart disease and stroke, partly driven by changing smoking habits1 and medical and technological advances.
People born between 1926 and 1935, now aged in their late 70s and 80s, and in particular those born around 1930 are often referred to as the Golden Cohort. This group have experienced improvements in mortality throughout most of their lifetimes that no cohorts previously or since have experienced. The effect of their greater rates of improvement in mortality has contributed to the overall improvements in life expectancy at older ages in the UK.
As the chance of surviving to older ages has improved over time, this has led to increases in the population aged 90 and over. See ONS estimates of the very old (including centenarians) which are also published today.
Notes for surviving to older ages
- Murphy M, Di Cesare M, (2012) Use of an age-period-cohort model to reveal the impact of cigarette smoking in trends in twentieth century adult cohort mortality in England and Wales, Population Studies, Vol 66, issue 3.
8. International comparison
Comparison of life expectancy in the United Kingdom’s constituent countries with other selected countries
Tables 3 and 4 show period life expectancy at birth, at age 65 and at age 85 for males and females respectively, for a selection of countries, selected by the availability of the relevant data. The countries are ordered by life expectancy at birth.
Table 3: Life expectancy in selected countries, Males, 2011-2013
| Life expectancy at birth | Life expectancy at age 65 | Life expectancy at age 85 | |
| Iceland (2013) | 80.8 | 19.1 | 5.9 |
| Switzerland (2012) | 80.5 | 19.1 | .. |
| Sweden (2013) | 80.1 | 18.7 | 5.6 |
| Japan (2012) | 79.9 | 18.9 | 6.0 |
| Australia (2010-2012) | 79.9 | 19.1 | 6.1 |
| Norway (2013) | 79.7 | 18.4 | 5.7 |
| Italy (2012) | 79.6 | 18.3 | 5.6 |
| Spain (2012) | 79.4 | 18.5 | 5.9 |
| Canada (2009-2011) | 79.3 | 18.8 | 6.5 |
| New Zealand (2010-2012) | 79.3 | 18.8 | 5.9 |
| England (2011-2013) | 79.2 | 18.5 | 5.8 |
| Netherlands (2012) | 79.1 | 17.9 | .. |
| France (2012) | 78.4 | 18.1 | .. |
| Wales (2011-2013) | 78.2 | 18.0 | 5.6 |
| Denmark (2012-2013) | 78.0 | 17.4 | 5.3 |
| Northern Ireland (2011-2013) | 78.0 | 17.9 | 5.6 |
| Germany (2009-2011) | 77.7 | 17.5 | 5.5 |
| Scotland (2011-2013) | 76.8 | 17.1 | 5.5 |
| Poland (2013) | 73.1 | 15.5 | 5.6 |
| Estonia (2012) | 71.1 | 14.4 | 5.2 |
| Brazil (2011) | 70.6 | 16.1 | .. |
| Latvia (2013) | 69.5 | 13.8 | 4.7 |
| Source: Swiss Federal Statistical Office, Statistics Iceland, Australian Bureau of Statistics, Statistics Bureau of Japan, The National Institute of Statistics Italy, Statistics Netherlands, National Statistics Institute of Spain, Statistics New Zealand, Statistics Norway, ONS, Federal Statistical Office of Germany, Statistics Denmark, Central Statistical Office of Poland, Brazilian Institute of Statistics and Geography, Statistical Office of Estonia, Central Statistical Bureau of Latvia, Statistics Sweden, National Institute of Statistics and Economic Studies- France, and Statistics Canada | |||
| Notes: | |||
| 1. Countries have been selected based on the availability of data for the selected years and are ordered by life expectancy at birth. | |||
| 2. Life expectancy figures by age are period life expectancies. | |||
| 3. ∙∙ Indicates that the figure was not available at the time of publication of this report. | |||
Download this table Table 3: Life expectancy in selected countries, Males, 2011-2013
.xls (29.2 kB)From the selected countries in Table 3, Iceland had the highest male life expectancy at birth of 80.8 years in 2013, while Latvia had the lowest at 69.5 years. Life expectancy at birth for males in England was 79.2 years in 2011-2013, higher than the Netherlands at 79.1 and France at 78.4 years. Male life expectancy at birth in Wales was just below France at 78.2 years. Males in Northern Ireland and Scotland had life expectancies at birth of 78.0 years and 76.8 years respectively, which were considerably above Poland, Estonia, Brazil and Latvia.
Although men living in England had lower life expectancy at birth than 10 of the countries shown in Table 3, the difference between theirs and Iceland’s is less than two years and shows the potential for further increases in future male life expectancy.
The highest life expectancy at age 65 for the countries shown in Table 3 was 19.1 years in Iceland, Switzerland and Australia. Again Latvia was the lowest at 13.8 years. Men in England have on average 18.5 years of life remaining at age 65, which is above Norway and Italy at 18.4 and 18.3 years respectively, despite these countries having a higher life expectancy at birth. Men in Wales have a life expectancy at age 65 of 18.0 years which is higher than in the Netherlands. For males in Northern Ireland, life expectancy at age 65 is higher at 17.9 years than in Denmark and Germany. Life expectancy at age 65 in Scotland is around one year higher than Brazil at 17.1 years, although Scotland has a much higher life expectancy at birth compared to males in Brazil. The figure for England at age 65 has a difference of less than one year from the highest shown in Table 3.
At age 85 men in Canada had the highest life expectancy of 6.5 years. Men in England having reached aged 85 could expect, on average, to live a further 5.8 years. The remaining UK constituent countries all have similar male life expectancy at age 85 to Germany and Poland.
Table 4: Life expectancy in selected countries, females, 2011-2013
| Life expectancy at birth | Life expectancy at age 65 | Life expectancy at age 85 | |
| Japan (2012) | 86.4 | 23.8 | 8.1 |
| Spain (2012) | 85.1 | 22.5 | 7.0 |
| France (2012) | 84.8 | 22.6 | .. |
| Switzerland (2012) | 84.7 | 22.1 | .. |
| Italy (2012) | 84.4 | 21.8 | 6.8 |
| Australia (2010-2012) | 84.3 | 22.0 | 7.2 |
| Sweden (2013) | 83.7 | 21.2 | 6.7 |
| Iceland (2013) | 83.7 | 21.0 | 6.7 |
| Norway (2013) | 83.6 | 21.2 | 6.7 |
| Canada (2009-2011) | 83.6 | 21.7 | 7.7 |
| New Zealand (2010-2012) | 83.0 | 21.2 | 6.8 |
| England (2011-2013) | 83.0 | 21.0 | 6.8 |
| Netherlands (2012) | 82.8 | 19.8 | .. |
| Germany (2009-2011) | 82.7 | 20.7 | 6.3 |
| Northern Ireland (2011-2013) | 82.3 | 20.5 | 6.6 |
| Wales (2011-2013) | 82.2 | 20.5 | 6.7 |
| Denmark (2012-2013) | 81.9 | 20.1 | 6.6 |
| Poland (2013) | 81.1 | 19.8 | 6.6 |
| Estonia (2012) | 81.1 | 19.8 | 6.2 |
| Scotland (2011-2013) | 80.9 | 19.5 | 6.4 |
| Latvia (2013) | 79.0 | 18.5 | 5.4 |
| Brazil (2011) | 77.7 | 18.9 | .. |
| Source: Swiss Federal Statistical Office, Statistics Iceland, Australian Bureau of Statistics, Statistics Bureau of Japan, The National Institute of Statistics Italy, Statistics Netherlands, National Statistics Institute of Spain, Statistics New Zealand, Statistics Norway, ONS, Federal Statistical Office of Germany, Statistics Denmark, Central Statistical Office of Poland, Brazilian Institute of Statistics and Geography, Statistical Office of Estonia, Central Statistical Bureau of Latvia, Statistics Sweden, National Institute of Statistics and Economic Studies- France, and Statistics Canada | |||
| Notes: | |||
| 1. Countries have been selected based on the availability of data for the selected years and are ordered by life expectancy at birth. | |||
| 2. Life expectancy figures by age are period life expectancies. | |||
| 3. ∙∙ Indicates that the figure was not available at the time of publication of this report. | |||
Download this table Table 4: Life expectancy in selected countries, females, 2011-2013
.xls (22.0 kB)Table 4 shows that out of the 22 selected countries Japanese females still had the highest life expectancy at birth of 86.4 years in 2012 (even when other countries had figures available for 2013). Females in Brazil had the lowest life expectancy at 77.7 years. Life expectancy at birth for females in England was 83.0 years, 3.4 years lower than Japan’s. This shows the potential for further increases in female life expectancy. Life expectancy at birth for females in England is higher than in the Netherlands or Germany. Females in France appear to be doing better than their male counterparts when being compared with the other countries shown in Tables 3 and 4. Females in France had the third highest life expectancy at birth and males had the 13th highest compared with the other countries shown in Tables 3 and 4. For Wales and Northern Ireland the pattern for females is similar to males; females in Northern Ireland and Wales have a life expectancy at birth below that of the Netherlands and Germany but above Denmark. Females in Scotland had a life expectancy of 80.9 years, more than five years below Japan and ranking lower in Table 4 than their male counterparts in Table 3.
Japan had the highest life expectancy for women at age 65, at 23.8 years. Of the 22 selected countries, women in Latvia had the lowest life expectancy at age 65 at 18.5 years. In 2011-2013, women in Scotland had a life expectancy at age 65 one year longer than women in Latvia. Women in England having celebrated their 65th birthday had on average a further 21.0 years of life, more than women in Germany (20.7 years) or Denmark (20.1 years).
Life expectancy at age 85 was the highest for women in Japan at 8.1 years. Canada had the second highest life expectancy at age 85 at 7.7 years. Next were Australia with 7.2 years and Spain with 7.0 years of life expectancy at age 85, while all the other countries shown in Table 4 are below seven years. In England women aged 85 in 2011-2013 would expect to live on average a further 6.8 years. Women in Northern Ireland had the same life expectancy at age 85 as women in Poland and Denmark, at 6.6 years. Life expectancy at age 85 was higher for women in Scotland than in Germany at 6.4 years and 6.3 years respectively. The lowest life expectancy at age 85 for females was in Latvia at 5.4 years in 2013.
Back to table of contents9. Uses of life tables
The national life tables provide annual figures allowing up-to-date analysis of mortality and life expectancy.
Key uses:
- to study the course of mortality throughout the life cycle
- as an indicator of the health of the nation
- to inform policy regarding state pension age
- to assess risk for life assurance and pension liability
Within ONS, national life tables are used in the methodologies used to calculate 'health expectancies' and ‘duration of working life’. They are also used to inform the assumptions of future mortality for the National Population Projections.
Other organisations that use life tables include:
Other government departments:
- Government Actuary’s Department
- Department of Work and Pensions
- Department of Health and Health Authorities
- National Records of Scotland, Northern Ireland Statistics and Research Agency, and Welsh Assembly
- HM Treasury
Non-government organisations:
- universities – academics and students
- news media
- financial advisors/consultants
- insurance companies and actuarial professions
- the general public