
Table of contents
- Main points
- Overview
- User engagement
- Total international trade in services
- Total international trade in services, by continents and countries
- Trade in services products: geographical analysis
- Trade in services products: industry analysis
- Film and television industries (FTV) excluding other services analysed by continents and countries, 2011 (Tables D1 and D2)
- Background notes
- Methodology
1. Main points
- Total UK exports of services continued to increase from £89,523 million in 2010 to £97,311 million in 2011, an increase of 9% (compared with a 6% increase between 2009 and 2010).
- Total UK imports of services increased by 4% from £42,074 million in 2010 to £43,564 million in 2011 (compared with relatively no change between 2009 and 2010).
- The UK continues to be a net exporter of services. The total UK service balance increased by 13% from a surplus of £47,449 million in 2010 to £53,746 million in 2011.
- Wholesale and retail trade continued to show strong growth in 2011 where UK exports rose by 65% from £8,609 million in 2010 to £14,176 million in 2011 (compared with a 26% increase in 2010).
- Total UK exports of merchanting, other trade-related and services between affiliated enterprises increased by 30% in 2011 rising from £17,254 million in 2010 to £22,356 million in 2011 (compared with relatively small growth of 11% in 2010). This may indicate a shift in UK exports patterns favouring merchanting, other trade related and services between affiliated enterprises.
- Growth in Asian markets continued to increase with UK exports to Asia rising by 9%, from £14,137 million in 2010 to £15,445 million in 2011 and UK imports from Asia rising by 25%, from £6,589 million in 2010 to £8,250 in 2011.
2. Overview
The 2011 International Trade in Services publication provides a detailed breakdown of annual trade in services estimates, analysing data by product, industry and country. The data are sourced from the Office for National Statistics comprehensive surveys into international trade.
The International Trade in Services survey is a key source of UK trade data. It is important to note that the survey does not contain data for transportation, travel and banking industries. This data is obtained from other sources such as the International Passenger Survey and the Bank of England. As a result, these industries are excluded from the figures reported in this publication. Estimates for the overall level of trade in services, including these industries, are published in the Office for National Statistics Pink Book publication.
The International Trade in Services figures are used for a variety of purposes, further information can be found in the background notes under relevance to users.
Back to table of contents3. User engagement
The structure of this release has been modified in response to some feedback received from its users. We are constantly aiming to improve this release and its associated commentary. We would welcome any feedback you might have and would be particularly interested in knowing how you make use of these data to inform our work. Please contact us via email: itis@ons.gov.uk or telephone Ciara Williams-Fletcher on +44 (0)1633 456455
Back to table of contents4. Total international trade in services
Figure 1: Total international trade in services
Source: Office for National Statistics
Download this chart Figure 1: Total international trade in services
Image .csv .xlsTotal exports of services from the UK increased from £89,523 million in 2010 to £97,311 million in 2011. The 2011 value is now the highest reported figure in the exports time series having more than doubled between 2001 and 2011.
Total imports of services to the UK rose from £42,074 million in 2010 to £43,564 million in 2011. Although, the 2011 value is now the highest figure reported in the imports time series, the rate at which it has grown has slowed since 2009 which may indicate a plateau effect in UK demand due to fragility within the UK economy.
The UK is relatively specialised in the provision of services and historically exported more services than it imported. The 2011 results in this publication show that this trend has continued with the exports of services increasing by 9% from 2010 and imports increasing by 4% for the same period.
Over the last decade, the balance between the exports of goods and services has continued to shift in favour of services. In 2001, the proportion of UK trade in goods and services balance stood at 70% and 30% respectively. In 2011, the make up of these proportions altered with the percentage of goods standing at 57% in relation to 43% for services.
Figure 2: Balance figures of trade in goods and services
Source: Office for National Statistics
Download this chart Figure 2: Balance figures of trade in goods and services
Image .csv .xls5. Total international trade in services, by continents and countries
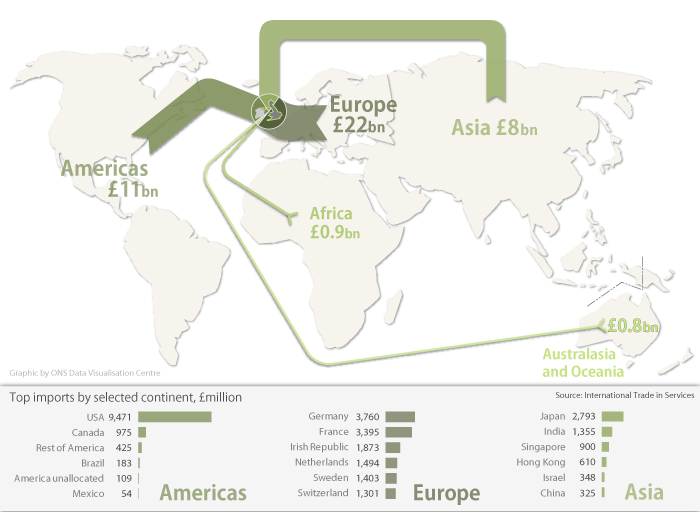
This section shows key geographical findings for the total UK international trade in services (excluding travel, transport and banking). The size of the arrows in figures 3 and 4 are proportionate to the size of the continental exports and imports markets for the UK.
Figure 3: UK International trade in services exports by continent, 2011

Source: Office for National Statistics
Download this image Figure 3: UK International trade in services exports by continent, 2011
.png (131.0 kB) .xls (18.4 kB)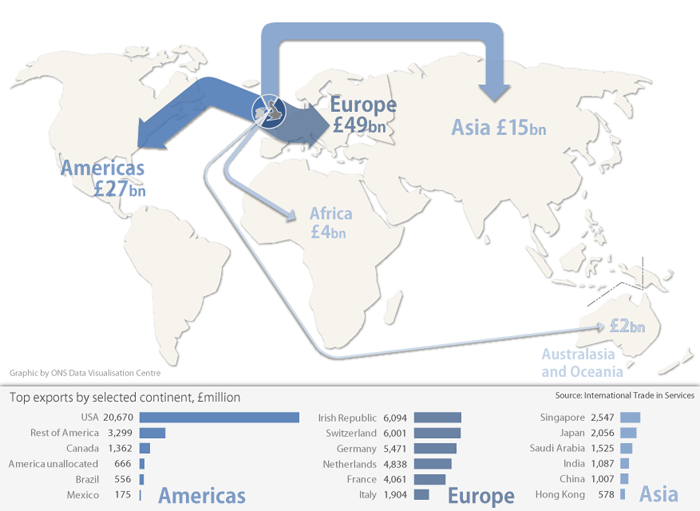
European dominance continues
Europe continued to be the dominant customer for UK exports of services in 2011 and accounted for 50% of the total. International trade in services from the UK to Europe increased from £45,262 million in 2010 to £48,909 million in 2011 (8%).
Europe continued to be the main source for imports accounting for 51% of total UK imports services, although this is a slight decrease compared with 2010. UK imports of services from Europe fell from £22,395 million in 2010 to £22,325 million in 2011.
Total exports to Europe in 2011 were led by UK exports to the Irish republic (£6,094 million). Switzerland had previously led exports in 2010 with £5,979 million, however despite these figures increasing to £6,001 million in 2011, Switzerland has dropped to second place. In late 2010, the Irish Republic received financial aid from the EU, however in 2011 they experienced economic growth, predominantly led by services (which encompasses the largest component of the Irish economy).
An interactive map can be found on the ONS website detailing the UK's European imports and exports of services.
The Americas
The Americas continued to be the second largest customer for UK exports of services in 2011 and accounted for 27% of the total. UK exports to The Americas increased from £24,732 million in 2010 to £26,729 million in 2011 (8%). A similar positioning was seen in UK imports of services from the Americas, although figures showed relatively static year on year growth, increasing from £11,162 million in 2010 to £11,217 million in 2011.
Of the Americas countries, the USA in particular, continued to contribute the most to both UK exports and imports figures in 2011, displaying marginal year on year increases.
Growth seen in Asian markets
Asia remained the third largest customer for UK exports of trade in services, increasing from £14,137 million in 2010 to £15,445 million in 2011, an increase of 9%. Asia contributed the most to the increase in total UK imports rising from £6,589 million in 2010 to £8,250 million in 2011, an increase of 25%.
Total exports of international trade in services to India have more than doubled since 2009, having increased from £535 million in 2009 to £1,087 million in 2011. In addition, an increased Indian customer base together with growth seen in net foreign investment into India may indicate that as demand increased, global companies were investing in the Indian market, contributing to the growing Asian market in 2011. Total imports of services from India also increased (39%) from £976 million in 2009 to £1,355 million in 2011. India was projected by the IMF to have a GDP growth of 6% in 2013 and these latest trade figures may indicate a more prolonged global trend towards Asian investment.
China saw total exports of services from the UK rise from £620 million in 2009 to £1,007 million in 2011. This 62% increase over the same two year period further demonstrates the trend towards investment in emerging Asian markets. UK imports of services from China remained fairly static in 2011.
Total UK exports of services to Japan saw a 32% increase over the last two years, rising from £1,553 million in 2009 to £2,056 million in 2011. Similarly, total imports into the UK have continued on an upward trend, increasing substantially from £1,156 million in 2009 to £2,793 million in 2011. Before the earthquake in Japan in 2011, its economy was increasing rapidly, recovering from its previous recession. Although the earthquake did slow this recovery, the economy may be set to continue its growth in line with Asian markets.
For more detailed, geographic information relating to the total exports and imports of services, please refer to table AO – Total trade in services (excluding travel, transport and banking) analysed by continents and countries.
Figure 4: UK International trade in services imports by continent, 2011
Source: Office for National Statistics
Download this image Figure 4: UK International trade in services imports by continent, 2011
.png (82.9 kB) .xls (18.4 kB)
An interactive map can be found on the ONS website detailing the UK's European imports and exports of services.
Balances
Overall, the UK continued to remain a net exporter of services in 2011. The UK trade in services balance continued on an upward trend increasing from a surplus of £47,449 million in 2010 to a surplus of £53,746 million in 2011 (13%), where Europe made the largest contribution to this rise.
Back to table of contents6. Trade in services products: geographical analysis
This section illustrates UK trade in services exports and imports broken down by prominent product groups. Each group is analysed by continent, making comparisons between 2010 and 2011.
Technical, trade related, operational leasing and other business services
Exports
The total value of UK exports of technical, trade related, operational leasing and other business services increased by 7% in 2011, rising from £9,619 million in 2010 to £10,263 million in 2011.
Figure 5: Exports of technical, construction, operational leasing and other business services
Source: Office for National Statistics
Download this chart Figure 5: Exports of technical, construction, operational leasing and other business services
Image .csv .xlsThe UK's exports of technical, construction, operational leasing and other business services has remained dominated by the same three continents in 2011.
UK exports of services to Europe has continued to slow, falling from £3,315 million in 2010 to £3,026 million in 2011 equating to a decrease of 9%. The decrease within Europe can largely be attributed to Norway where exports of services from the UK has fallen from £611 million in 2010 to £329 million in 2011, a decrease of 46%.
The Americas has seen a surge in 2011 in terms of UK exports of technical, construction, operational leasing and other business services, rising from £1,953 million in 2010 to £2,651 million in 2011, an increase of 36%. This increase is predominantly driven by USA which has increased from £1,435 million in 2010 to £1,853 million in 2011, an increase of 29%.
UK exports of services to Asia remained relatively static in 2011, tracking at a similar level with the UK compared to 2010.
Imports
The total value of UK imports of technical, trade related, operational leasing and other business services decreased marginally in 2011, falling from £3,414 million in 2010 to £3,341 million in 2011.
Figure 6: Imports of technical, construction, operational leasing and other business services
Source: Office for National Statistics
Download this chart Figure 6: Imports of technical, construction, operational leasing and other business services
Image .csv .xlsThe structure of UK imports of technical, construction, operational leasing and other business services in 2011 did not change considerably in comparison to 2010. Europe, Asia and the Americas continue to be the largest continents of UK imports of technical, construction, operational leasing and other business services.
The UK imports from Europe have remained relatively constant in 2011, falling only slightly from £1,741 million in 2010 to £1,736 million in 2011. This deceleration in the rate of the decline seen in Europe within this group of products may suggest signs of recovery in terms of European markets and that the UK has opted to trade more with European partners than those within the Americas and Asia.
UK imports from Asia slowed in 2011 at a much similar rate to 2010, falling from £939 million to £842 million, a decrease of 10%. This reduction in imports is driven by the Rest of Asia which has fallen from £329 million in 2010, to £282 million in 2011, a decrease of 14%.
UK imports from the Americas also decreased in 2011, falling from £445 million in 2010 to £393 million in 2011, a decrease of 12%. This reduction was driven by Canada which fell from £87 million in 2010 to £38 million in 2011, a decrease of 56%.
Professional, management consulting and research and development services
Exports
The total value of UK exports of professional, management consulting and research and development services increased by 7% in 2011, rising from £20,634 million in 2010 to £22,146 million in 2011.
Figure 7: Exports of professional, management consulting and research and development services
Source: Office for National Statistics
Download this chart Figure 7: Exports of professional, management consulting and research and development services
Image .csv .xlsThe structure of UK exports of professional, management consulting and research and development services remained broadly the same in 2011. UK exports of services were dominated by the same three continents.
Europe has increased the value of UK exports of professional, management consulting and research and development services rising from £11,200 million in 2010 to £11,841 million in 2011, an increase of 6%. The increase in Europe is evenly distributed between the Irish Republic, increasing from £1,199 million in 2010 to £1,455 million in 2011, an increase of 21% and France, increasing from £856 million in 2010 to £1,091 million in 2011, an increase of 27%. The increase seen in UK exports to the Irish Republic may be linked to the growth seen in Irish gross domestic product (GDP) which showed positive growth in 2011.
UK exports to the Americas continued to increase in 2011, rising from £6,098 million in 2010 to £7,082 million in 2011 an increase of 16%. The increase was predominantly driven by the USA, rising from £5,210 million in 2010 to £6,079 million in 2011, an increase of 17%.
UK exports to Asia remained relatively static between 2009 and 2011, decreasing slightly in 2011.
Imports
The total value of UK imports of professional, management and consulting and research and development services decreased 3% in 2011, falling from £12,024 million in 2010 to £11,675 million in 2011.
Figure 8: Imports of professional, management consulting and research and development services
Source: Office for National Statistics
Download this chart Figure 8: Imports of professional, management consulting and research and development services
Image .csv .xlsUK imports of professional, management consulting and development services has remained fairly static in comparison to 2010, although imports from each continent has decreased slightly year on year.
Taking into consideration the types of products within professional, management consulting and development services, this may suggest that the UK has opted to reduce expenditure on what may be classed as non essential purchases such as research and development and streamlined advertising costs. This could be in reaction to the financial crisis not only in the UK but being experienced by the rest of the world. 2011 saw Standard and Poor’s downgrade credit statuses of America and Italy, Greece approved austerity measures to target the debt crisis and world stock markets fell. All these factors may have contributed to UK businesses importing less of these services from around the world.
Merchanting, other trade-related and services between affiliated enterprises
Exports
The total value of UK exports of merchanting, other trade-related and services between affiliated enterprises increased by 30 %, rising from £17,254 million in 2010 to £22,356 million in 2011. This is a substantial increase on 2010, which saw growth of 11%.
Figure 9: Exports of merchanting, other trade related and services between affiliated enterprises
Source: Office for National Statistics
Download this chart Figure 9: Exports of merchanting, other trade related and services between affiliated enterprises
Image .csv .xlsThe increase in UK exports of merchanting, other trade related and services between affiliated enterprises in 2011, although seen all over the world was predominantly driven by Europe, which surged upwards from £9,472 million in 2010 to £12,371 million in 2011, an increase of 31%. Growth in UK exports to Europe between 2009 and 2010 was recorded at 10%. The increase seen in Europe cannot be attributed to an individual country as it was distributed throughout the Europe as a whole.
This increase may be linked to factors such as businesses holding stocks of certain commodities and using this to their advantage as they would have purchased commodities at a low price and will have been able to sell them at an inflated price thus increasing profit margins. Businesses trading in such commodities may have experienced increased costs such as merchanting costs, for example, oil prices. These have been steadily increasing pushing up the production costs of day to day commodities, overall resulting in an increased cost to users.
Imports
The total value of UK imports of Merchanting, other trade related and services between affiliated enterprises increased by 19 %, rising from £7,541 million in 2010 to £8,960 million in 2011. This is a substantial increase on 2010 which saw growth of 1%.
Figure 10: Imports of merchanting, other trade-related and services between affiliated enterprises
Source: Office for National Statistics
Download this chart Figure 10: Imports of merchanting, other trade-related and services between affiliated enterprises
Image .csv .xlsSimilar to exports, The Americas and Asia became the driving continents behind the growth seen in UK imports of merchanting, other trade related and services between affiliated enterprises. Imports from Asia increased from £1,112 million in 2010 to £1,878 million in 2011 (69%) and the Americas, increasing from £1,573 million in 2010 to £2,004 million in 2011 (27%).
Back to table of contents7. Trade in services products: industry analysis
This section illustrates UK trade in services exports and imports detailed by industry and product classification.
Exports
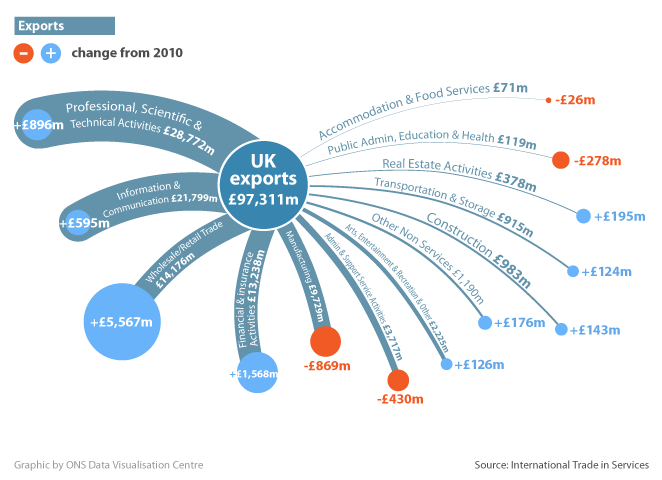
In 2011, the five largest industry sectors contributing to total UK exports of trade in services were professional, scientific and technical activities, information and communication activities, wholesale/retail trade, financial and insurance activities and manufacturing.
Figure 11: UK exports of services products by industry, 2011
Source: Office for National Statistics
Download this image Figure 11: UK exports of services products by industry, 2011
.png (33.2 kB) .xls (33.3 kB)
An interactive bar chart detailing UK exports by product can be found on the ONS website.
Wholesale and retail trade growth
The 2011 data suggests that the year on year increase was largely dominated by the wholesale/retail sector recording a growth of 65% in 2011. Growth within this sector was predominantly driven by UK exports of merchanting increasing from £3,573 million in 2010 to £7,251 million in 2011. This increase may have been as a result of wholesale retailer’s merchanting goods which saw a sharp rise in costs. For example, sugar prices reached a 30 year high in November 2010. Wholesalers holding a stock of this commodity may have been able to take advantage of increased prices by merchanting larger amounts of sugar than normal possibly at a lower rate than available direct from the source.
Financial and insurance service activities
Financial and insurance service activities were the second largest contributor to the increase in UK exports, rising from £11,670 million in 2010 to £13,238 million in 2011, an increase of 13%.
This could possibly have been due to the resumed investment in financial services particularly from the USA who invested heavily in the UK financial service industry between 2010 and 2011. Reactions from Europe were mixed due to fiscal problems in the Euro zone.
Professional, scientific and technical activities
Professional, scientific and technical service activities were the third largest contributor to the increase rising from £27,876 million in 2010 to £28,772 million in 2011, an increase of 3%. Growth was evenly spread throughout the distribution of all products suggesting that businesses within this group of services may have experienced increased costs to deliver their services and passed that onto consumers.
Imports
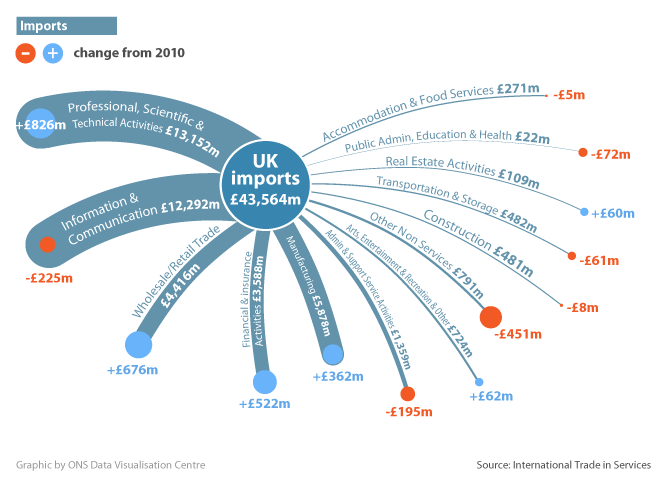
In 2011, the five largest industry sectors for total imports of services to the UK were professional, scientific and technical activities, information and communication activities, manufacturing, wholesale/retail trade and financial and insurance activities.
Figure 12: UK imports of services products by industry, 2011
Source: Office for National Statistics
Download this image Figure 12: UK imports of services products by industry, 2011
.png (33.9 kB) .xls (19.5 kB)
An interactive bar chart detailing UK imports by products can be found on the ONS website.
Professional, scientific and technical activities growth
UK imports of professional, scientific and technical activities increased from £12,326 million in 2010 to £13,152 million in 2011, an increase of 7%. Growth within this sector was driven by royalties and licence fees which increased from £892 million in 2010 to £1,970 million in 2011.
This product grouping contains numerous types of businesses which may be involved in product development whether by means of research or experimentation. Where overlaps in product design occur or enhancement of products is needed, this may have resulted in UK businesses having to make royalty or license fee payments to the products original owner. Although not directly linked to professional, scientific and technical activities, examples of where this type of payment may occur have recently been widely publicised in the media, dubbed the smartphone war.
Wholesale and retail trade growth
UK imports of Wholesale and retail trade increased from £3,739 million in 2010 to £4,416 million in 2011, an increase of 18%. This can be attributed to amounts spent on the importing of services between related enterprises which increased by 45%. This large increase also follows strong growth in 2010 of 75%. The increase could be a knock on effect from an expanding technological market with respect to smart phones and tablets. The number of devices of this nature on the market is rapidly increasing and a large proportion of these devices allow you to access the Internet whilst on the move. An increased volume of traffic on the mobile networks may result in increased payments between related enterprises outside of the UK in terms of network usage and management charges.
Financial and insurance service activities
Financial and insurance service activities were the third largest contributor to the increase in imports, rising from £3,066 million in 2010 to £3,588 million in 2011, an increase of 17%. This could be linked with the increase in investment for these services to Asia and the Middle East, and more specifically India. Growth in Asian investment within this sector may support upward trends in Asian markets.
Back to table of contents8. Film and television industries (FTV) excluding other services analysed by continents and countries, 2011 (Tables D1 and D2)
This section illustrates UK exports and imports for the film and television industries.
Total UK exports for the film industry decreased from £2,106 million in 2010 to £1,739 million in 2011, a decrease of 17%. The decrease can largely be attributed to Europe, and more specifically the European Union decreasing from £1,104 million in 2010 to £743 million in 2011, a decrease of 33%. In contrast, total UK imports for the film industry increased from £543 million in 2010 to £740 million in 2011, an increase of 36%.
Total UK exports for the television industry decreased from £1,705 million in 2010 to £1,508 million in 2011, a decrease of 12%. The USA saw the largest decrease, falling from £372 million in 2010 to £253 million in 2011, a decrease of 32%. UK imports to the television industry have also declined in 2011 falling from £1,344 million in 2010 to £1,248 million in 2011, a decrease of 7%. The decline of UK imports for the television industry was experienced worldwide, apart from Asia which saw an increase from £31 million in 2010 to £36 million in 2011.
Back to table of contents