1. Main points
Output per hour in the UK was 21 percentage points below the average for the rest of the major G7 industrialised economies in 2012, the widest productivity gap since 1992. On an output per worker basis, UK productivity was 25 percentage points below the average for the rest of the G7 in 2012
UK output per hour and output per worker fell in 2012 compared with 2011. By contrast, output per hour was unchanged in 2012 on average across the rest of the G7, and output per worker increased slightly
In 2012 UK output per hour was 3 percentage points below its level in the pre-recession year of 2007, and 16 percentage points below the counterfactual level had productivity grown at its average rate before the recession. This compares with a productivity gap in 2012 of around 5 percentage points for the rest of the G7
2. About this release
This bulletin contains annual estimates of labour productivity for the G7 developed countries (Canada, France, Germany, Italy, Japan, UK and USA) up to 2012. Labour productivity measures the amount of economic output that is produced by a unit of labour input, and is a key measure of economic performance.
Output is measured by gross domestic product (GDP). Labour input is measured in two ways – by total hours worked and by numbers of workers in employment. These two measures of labour input can yield different results, reflecting differences in working patterns across countries and compositional movements over time, such as a shift towards part-time working.
Comparability across countries is achieved by converting local currency based measures of GDP using purchasing power parity (PPP) exchange rates. PPP exchange rates (usually referred to simply as PPPs) attempt to equalise the cost of a representative basket of goods and services in countries with different national currencies. An ONS article explaining the uses and limitations of PPPs (246.1 Kb Pdf) is available on our website.
The estimates in this release update those published on 18 September 2013. This release cycle reflects the publication and revision cycles of the component data series.
Back to table of contents3. What's new?
This release includes productivity comparisons between the UK and the Netherlands, Spain, Ireland and Belgium, which were previously included in the February 2013 release. The data for these countries has been updated to 2012. Along with the G7 countries, these economies in total account for over half of the UK’s exports and imports.
Back to table of contents4. Interpreting these statistics
The labour productivity measures in this bulletin are presented in terms of current prices, suitable for cross-country comparison of levels of productivity for a single year, and constant prices, suitable for analysis of productivity performance over a number of years. The current price estimates in Tables 1, 2, 5 and 6 should be read horizontally, while the constant price estimates in Tables 3, 4, 7 and 8 should be read vertically.
Current price productivity estimates are indexed spatially to UK=100 for each year and show each country’s productivity relative to that of the UK in that year. Since productivity is a key determinant of living standards, these estimates also provide an indication of living standards relative to the UK.
In interpreting these estimates users should bear in mind that PPPs provide only an approximate conversion from national currencies and may not fully reflect national differences in the composition of a representative basket of goods and services. Additionally, care should be taken in interpreting movements in current price productivity estimates over time. For example, an increase in UK productivity relative to another country could be due to UK productivity growing faster, or falling less, or due to changes in relative prices in the two countries, or some combination of these movements.
Constant price productivity estimates are indexed to a particular year. For each single country, these estimates are almost identical to national labour productivity series (minor differences from national sources are described in the Background Notes to this bulletin). The index year is set at 2007 in order to focus on movements in labour productivity over the economic downturn.
Constant price productivity estimates show the evolution of productivity for each country and for the G7 (and G7 excluding the UK) aggregates, but should not be used to compare productivity across countries at a point in time. Productivity growth can be decomposed into growth of output minus the growth of labour input, and these components can move in different directions within and across countries. This should be borne in mind in interpreting the constant price productivity estimates in this release.
More information on methodology and interpretation is available in the Background Notes to this bulletin. Additionally, the Quality and Methodology paper for this release provides information on the quality of the estimates in this release, as well as providing a summary of methods used in compiling the estimates.
Back to table of contents5. Current price productivity
Current price productivity estimates allow for comparison of how much economic output, measured in common currency terms, is produced by each worker and hour worked across countries in a particular year, relative to the UK=100. Further information is available in Tables 1 and 2 in the reference table (165 Kb Excel sheet) component of this release and at the back of the PDF version of this statistical bulletin.
GDP per hour worked (Table 1)
On this basis, UK productivity in 2012 was:
above that of Japan by 11 percentage points
lower than that of Canada and Italy by 5 and 11 percentage points respectively
lower than that of the remaining G7 countries by over 30 percentage points
Figure 1: GDP per hour worked, G7 countries

Source: Office for National Statistics
Download this image Figure 1: GDP per hour worked, G7 countries
.png (13.7 kB) .xls (218.6 kB)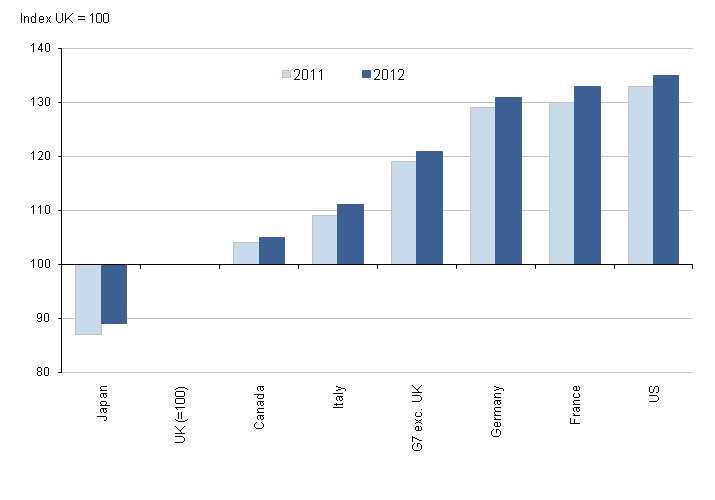
Comparing 2012 with 2011, the UK productivity shortfalls relative to Canada, France, Germany, Italy and the US all widened, and the UK productivity lead over Japan narrowed by 2 percentage points. The difference in productivity on this measure between the UK and the rest of the G7 widened to the greatest differential since 1992.
GDP per worker (Table 2)
Final estimates for 2012 show that UK output per worker was:
above that of Japan by 7 percentage points
below that of Canada and Germany by 8 and 11 percentage points respectively
below that of Italy and France by 18 percentage points
below that of the US by 46 percentage points
Figure 2: GDP per worker, G7 countries

Source: Office for National Statistics
Download this image Figure 2: GDP per worker, G7 countries
.png (14.0 kB) .xls (218.6 kB)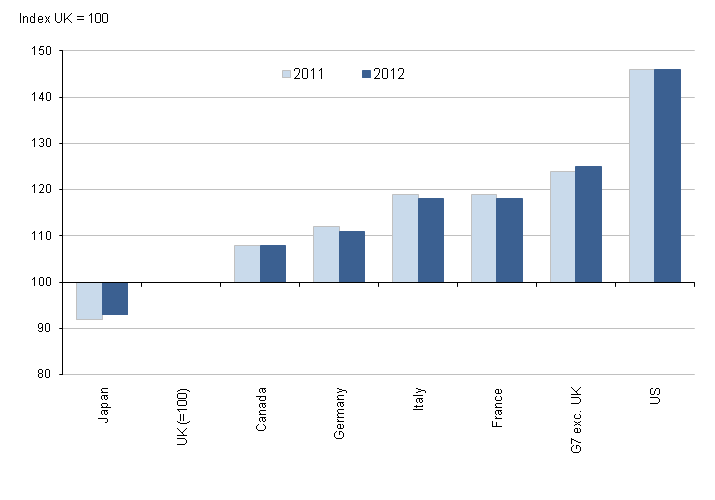
Comparing 2012 with 2011, the shortfall between output per worker in the UK and the rest of the G7 increased by 1 percentage point, while the UK’s lead over Japan on this measure narrowed to the smallest margin since 1997.
As illustrated in Figure 3, there are significant differences in average hours worked across the G7, reflecting cultural and compositional differences between economies. These differences account for differences in the patterns of productivity in Figures 1 and 2. The difference in average hours worked in 2012 between the US (where average hours are highest across the G7) and Germany (lowest) is equivalent to around 8 hours per week for the average worker.
Figure 3: Average hours per worker, G7 countries
Source: Office for National Statistics
Download this chart Figure 3: Average hours per worker, G7 countries
Image .csv .xls6. Constant price productivity
Constant price productivity estimates are indexed to 2007=100 and show the evolution of labour productivity for each country and group of countries over time. Further information is available in Tables 3 and 4 in the reference table (165 Kb Excel sheet) component of this release and at the back of the PDF version of this statistical bulletin.
GDP per hour worked (Table 3)
Figure 4: Constant price GDP per hour worked, selected G7 countries
Source: Office for National Statistics
Download this chart Figure 4: Constant price GDP per hour worked, selected G7 countries
Image .csv .xlsFigure 4 shows GDP per hour worked for the UK and an aggregated series for the rest of the G7, together with simple projections based on average productivity growth over 1997-2007, that is, before the global economic downturn. On this basis, the combination of strong UK productivity growth up to 2007 and weak productivity performance since 2007 implies a productivity gap of 16 percentage points in 2012. This has been referred to as the 'productivity conundrum', and is discussed further in articles published by ONS in August 2012 and October 2012.
Average annual productivity growth between 1997 and 2007 for the rest of the G7 was lower than in the UK (around 1.9%, compared with 2.5% for the UK), and productivity performance since 2007 has on average been somewhat stronger, implying a smaller productivity gap of around 5 percentage points on the same basis.
Figure 5 illustrates the difference in productivity trajectories over recent years between the main European economies on the one hand, and North America and Japan on the other hand. Output per hour fell sharply in most countries over the 2008-09 downturn, but then rebounded sharply in Japan, Canada and especially the US, whereas the recovery in productivity has been much more muted for the main European economies.
Figure 5: Constant price GDP per hour worked, selected G7 countries
Source: Office for National Statistics
Download this chart Figure 5: Constant price GDP per hour worked, selected G7 countries
Image .csv .xlsConverting the time series in Figure 5 into productivity gaps (calculated as in Figure 4) for 2012 would yield gaps of 3 to 5 percentage points for the US, Japan, Italy and Canada, and 8 to 9 percentage points for France and Germany, all considerably below the UK productivity gap.
Back to table of contents7. Comparisons with other countries
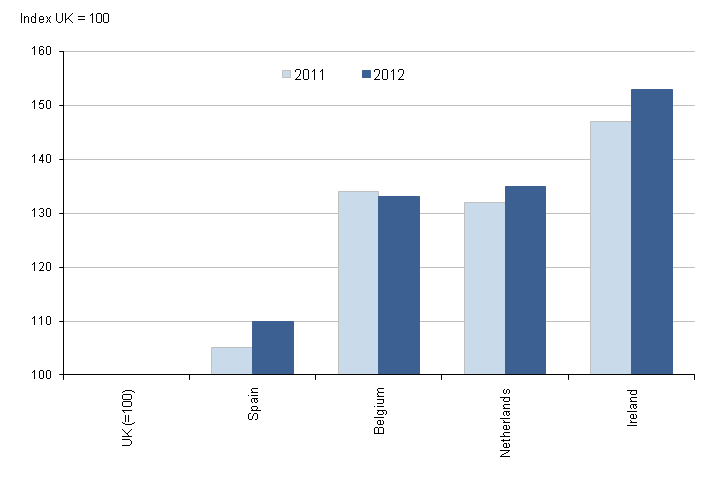
Figure 6 shows data for Spain, Belgium, the Netherlands and Ireland on a current price output per hour basis, comparable with the G7 estimates in Figure 1 and Table 1. Figure 6 shows UK output per hour slightly lower than Spain, but much larger shortfalls relative to Belgium, the Netherlands and especially Ireland, where the gap was some 53 percentage points in 2012. The productivity gap between the UK and Ireland has grown over time as the Irish economy grew very strongly from the mid 1990s up to the onset of the recession in 2008. But according to the OECD data on which these estimates are based, Irish output per hour was higher than that in the UK even in 1990.
Figure 6: GDP per hour worked, additional countries
Source: Office for National Statistics
Download this image Figure 6: GDP per hour worked, additional countries
.png (15.5 kB) .xls (218.6 kB)
Constant price growth of output per hour for these additional countries is shown in Figure 7. These series can be compared with the G7 estimates in Figure 4 and Table 3. Figure 7 shows that output per hour growth in Belgium and the Netherlands since the trough of the downturn in 2009 has been fairly weak. By contrast however, the 2008-09 economic downturn seems to have had little impact on output per hour growth in Ireland, and average growth in Spain has been around three times stronger since the downturn than over the previous decade. In both cases this reflects large-scale labour shedding as economic output fell. Between 2007 and 2012, total hours worked fell by around 20% in Ireland and 14% in Spain, compared with a fall of 1% in hours worked in the Netherlands and an increase of 4% in Belgium.
Figure 7: Constant price GDP per hour worked, additional countries
Source: Office for National Statistics
Download this chart Figure 7: Constant price GDP per hour worked, additional countries
Image .csv .xls8. Revisions
Historical data used in this publication are subject to revision between publications. Since the First Estimates for 2012 were published on 18 September 2013, the main revisions have been to PPP exchange rates. These are re-benchmarked every three years and the PPPs in this release are now benchmarked to 2011 rather than 2008 as in the previous release. Additionally historic PPPs have been revised as part of OECD’s regular revisions process.
UK PPPs have been revised down since 2010, effectively reducing the value of UK economic output in dollar terms, while PPPs for other G7 countries apart from Canada have been revised up.
Tables R1 to R4 in the reference table (165 Kb Excel sheet) component of this release and at the back of the PDF version of this statistical bulletin compare the latest estimates data with the data from the previous release on 18 September 2013. Note that because Tables 1 and 2 are indexed to UK=100, revisions to the UK are zero by definition in Tables R1 and R2. The large revisions to other countries estimates for 2010-12 in these tables reflect the combination of revisions to PPPs noted above. Revisions in the early years in these tables primarily reflect historic revisions to the US GDP deflator. There are no significant revisions to constant price productivity (Tables R3 and R4).
Back to table of contents