1. Main points
This is the first edition of a new experimental release designed to provide provisional estimates for measures of the distribution of household income significantly ahead of the main estimates produced from household surveys
The provisional estimate of median household disposable income for 2014/15 is £25,600. This is £1,500 higher than its recent low in 2012/13, after accounting for inflation and household composition, and at a similar level to its pre-downturn value (£25,400)
Median income for retired households continued to increase following the economic downturn and provisional estimates for 2014/15 suggest it is now £21,100, which is £1,800 higher in real terms than in 2007/08 (£19,300)
By contrast, the provisional 2014/15 value of median income for non-retired households is £28,100, which remains around £800 below its pre-downturn level (£28,900)
Early estimates of income inequality in 2014/15 are broadly unchanged from those for the previous financial year. Since 2007/08, there has been a slight decrease in inequality on a range of measures
2. Introduction
In order to properly understand changes in households' material living conditions, it is important to have measures which reflect the experience of the typical household, such as median household disposable income, as well as other indicators which can also provide a description of the income distribution. However, the complexities involved in collecting, processing and analysing household financial survey data mean such indicators are typically only available with a significant time lag.
In order to meet the considerable user demand for more timely data on household incomes, ONS have developed this new set of Experimental Statistics, produced using so-called "nowcasting" techniques.
What is nowcasting?
Nowcasting is an increasingly popular approach for providing initial estimates of such indicators. Unlike forecasting, which relies heavily on projections and assumptions about the future economic situation, nowcasting makes use of data that are already available for the period of study.
Although, at the time of producing these statistics, detailed survey data on household incomes are not yet available for 2014/15, a lot is known about various individual components of household income, as well as other factors that affect them. This information includes data on earnings, employment and inflation, as well as details of how changes to the tax and benefits system affect different types of households and individuals. This information is then used to adjust income survey data for recent years to reflect the current period. This technique allows the publication of estimates for measures such as median disposable income far earlier than was previously possible.
It is unrealistic to expect nowcast estimates to perfectly reflect changes in the distribution of income, particularly when examining smaller sub-groups of the population, so the estimates should be treated as providing an early indication of what the full survey-based data will show when it is available in 2016.
The methodology used in this bulletin has undergone significant testing and benefited from the experience of a range of external experts to ensure it is as robust as possible. As Experimental Statistics, the content of this bulletin and the methodology behind it will continue to be evaluated to ensure that user needs are met.
Back to table of contents3. Trends in household incomes
This section presents the provisional, "nowcast", estimates for 2014/151 in the context of longer-term trends in household income.
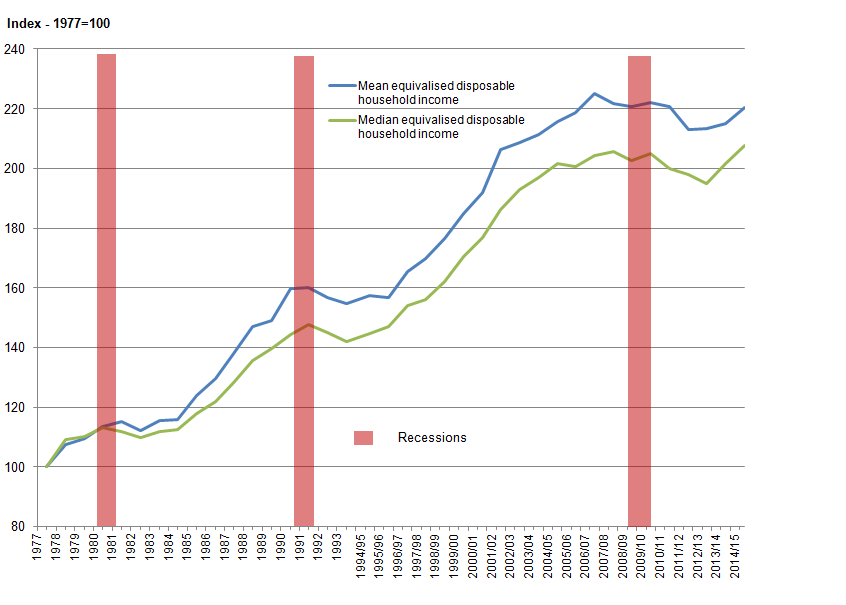
Based on these provisional estimates, the median household disposable income was £25,600 in 2014/15. After taking account of inflation2 and changes in household composition over time, this figure is broadly comparable to the pre-economic downturn level observed in 2007/08 (£25,400). Median household income declined after the start of the economic downturn, with most of that decrease occurring between 2009/10 and 2012/13, with the median income in 2012/13 being £1,200 lower in real terms than in 2009/10. However, since 2012/13 there has been a real terms increase, with the provisional 2014/15 figure indicating it is around 6.5% higher than in 2012/13 (Figure 1).
Figure 1: Change in mean and median equivalised household disposable income, 1977 to 2014/15
UK
Source: Office for National Statistics
Notes:
- Indices are calculated relative to 1977 values
- 1994/95 represents the financial year ending 1995 (April 1994 to March 1995), and similarly through to 2014/15, which represents the financial year ending 2015 (April 2014 to March 2015)
- Income figures have been deflated to 2014/15 prices using the implied deflator for the household sector
- Income is equivalised using the modified-OECD scale
Download this image Figure 1: Change in mean and median equivalised household disposable income, 1977 to 2014/15
.png (46.1 kB)
There has been a broadly similar pattern of growth in mean household income, with the provisional estimate for 2014/15 being £30,700, up from £29,700 in 2012/13. An important factor contributing to the growth in average disposable incomes has been rising income from employment. Average earnings grew in real terms in 2014/15 and the continued growth in employment rates meant that this impact was felt more strongly in household incomes.
Taking a longer-term perspective, median disposable income was over twice (2.08 times) as high in 2014/15 as in 1977, growing from £12,300 at an average rate of 2.0% per year over this period. Over the same period, mean household income increased at a faster rate than the median measure, growing at an average annual rate of 2.2% from £13,900 to £30,700. The faster growth of the mean measure was primarily due to incomes of high-income households growing at a faster rate than for households in the middle and lower parts of the income distribution between 1977 and 1990.
Figure 2 shows the growth of median household income for retired and non-retired households. For both groups of households, the provisional estimates for 2014/15 show the value of the median disposable income has increased since 2012/13, after taking account of inflation and changes in household composition over time. However, the pattern of change since the start of the economic downturn has been very different for retired and non-retired households. While incomes of non-retired households remain higher than retired households, since 2007/08, the median income for retired households has increased in most years, with the value rising to £21,100 in 2014/15, that is, £1,800 higher than in 2007/08. By contrast, the median income for non-retired households decreased, and was £2,300 lower in 2012/13 than in 2007/08. Since 2012/13, the value of the median for non-retired households has risen to £28,100, but is still around £800 below 2007/08 levels (£28,900).
Figure 2: Growth of median equivalised household disposable income by household type, 1977 to 2014/15
UK
Source: Office for National Statistics
Notes:
- Indices are calculated relative to 1977 values
- 1994/95 represents the financial year ending 1995 (April 1994 to March 1995), and similarly through to 2014/15, which represents the financial year ending 2015 (April 2014 to March 2015)
- Income figures have been deflated to 2014/15 prices using the implied deflator for the household sector
- Income is equivalised using the modified-OECD scale
Download this chart Figure 2: Growth of median equivalised household disposable income by household type, 1977 to 2014/15
Image .csv .xlsThese same patterns for retired and non-retired households are also observed in the value of mean disposable income. The growth in the incomes of retired households since 2007/08 has been driven by a number of factors. One is a rise in both the amounts received and the number of households reporting receipts from private pensions or annuities. Another is an increase in average income from the state pension, due in part to the impact of the "triple lock"3.
The fall in average disposable income for non-retired households after the economic downturn reflected largely a fall in income from employment (including self-employment). Similarly, it is earnings growth at the household level, in part due to rising employment levels, which has been the main driver of the most recent increases in average income for non-retired households.
Notes for Trends in household incomes
Throughout this release, 2014/15 refers to the financial year ending 2015 (April 2014 to March 2015). Similarly for other split years, for example, 2013/14 , it refers to the financial year ending 2014
All income measures given in this article for the UK have been deflated to 2014/15 prices using an implied deflator for the household sector in order to give a better comparison of households’ standards of living
The triple lock is a government policy which guarantees to increase the basic state pension by the higher of CPI inflation, average earnings or a minimum of 2.5% every year
4. Trends in income inequality
There are a number of different ways in which inequality of household income can be presented and summarised. Amongst them, the Gini coefficient is perhaps the most commonly used internationally. It ranges between 0 and 100, and the lower the value, the more equally household income is distributed.
Looking at the results for all households, the 1980s were characterised by a large increase in inequality of disposable income, particularly during the second half of that decade. Following that rise, inequality of disposable income reduced slowly from 1990 until the mid-1990s, although it did not fully reverse the rise seen in the previous decade. In the late 1990s, income inequality rose slightly before falling once again in the early 2000s.
Figure 3: Gini coefficients, 1977 to 2014/15
Source: Office for National Statistics
Notes:
- On this figure 1994/95 represents the financial year ending 1995 (April 1994 to March 1995), and similarly through to 2014/15, which represents the financial year ending 2015 (April 2014 to March 2015)
Download this chart Figure 3: Gini coefficients, 1977 to 2014/15
Image .csv .xlsIn recent years, there has been relatively little change in levels of income inequality. The provisional estimate for the Gini coefficient for disposable income in 2014/15 was 32.0%, which was not statistically significantly different from the 2013/14 value of 32.4%, but in line with the longer-term trend, which has shown a very gradual decline in inequality on this measure since 2006/07.
Inequality of disposable income for retired households has followed a similar trend, increasing significantly during the 1980s and peaking at 30.3% in 1991. Since then, the broad trend has been downwards, though income inequality levels remain above those seen in the late 1970s and early 1980s. In recent years, there is evidence of a slight increase in inequality for retired households. In 2014/15, the provisional estimate of the Gini coefficient for disposable income amongst retired households was 27.5%, up from 24.3% in 2009/10.
The characteristics of the Gini coefficient make it particularly useful for making comparisons over time, between countries and before or after taxes and benefits. However, no indicator is completely without limitations and one drawback of the Gini is that, as a single summary indicator, it cannot distinguish between different-shaped income distributions. For that reason, it is useful to look at this index alongside other measures of inequality. One such measure is the S80/S20 ratio, which is the ratio of the total income received by the 20% of households with the highest income to that received by the 20% of households with the lowest income. Another related measure is the P90/P10 ratio. This is the ratio of the income of the household at the bottom of the top decile to that of the household at the top of the bottom decile.
A relatively recently developed inequality measure, the Palma ratio, takes the ratio of the income share of the richest 10% of households to that of the poorest 40% of households. The idea behind using the Palma ratio is that middle 50% of households are likely to have a relatively stable share of income over time and hence isolating them, should not lead to a substantial loss of information (Cobham and Sumner, 2013). Together these measures provide further evidence on how incomes are shared across households and how this is changing over time.
Figure 4: Change in Gini coefficient, S80/S20 ratio, P90/P10 ratio & Palma ratio for equivalised disposable income, all households, 1977 to 2014/15
Source: Office for National Statistics
Notes:
- Indices are calculated relative to 1977 values
- 1994/95 represents the financial year ending 1995, and similarly through to 2014/15, which represents the financial year ending 2015
Download this chart Figure 4: Change in Gini coefficient, S80/S20 ratio, P90/P10 ratio & Palma ratio for equivalised disposable income, all households, 1977 to 2014/15
Image .csv .xlsFigure 4 shows how each of these measures reflects changes since 1977 for all households, using provisional figures based on nowcast estimates for 2014/15.
The chart shows that income inequality trends in the UK have been very similar on all 4 measures. Some year-on-year movements may reflect survey volatility, however, it can be seen that inequality of disposable income increased in the late 1980s and, to a lesser extent, during the late 1990s during periods of faster growth in income from employment and fell in the early 1990s during a period of slower growth in employment income.
Since the turn of the millennium, changes in income inequality have been relatively small compared with previous decades. In the early 2000s, income inequality fell. This was in part due to faster growth in income from earnings and self-employment income at the bottom end of the income distribution. Policy changes, such as increases in the national minimum wage, increases in tax credit payments, and the increase in National Insurance contributions in 2003/04 are also likely to have had an impact.
The most recent peak in income inequality was in 2006/07 or 2007/08 depending on the measure used. Since then the broad trend has been one of gradual decline in levels of inequality on each of the measures.
Back to table of contents5. Economic context
In the financial year 2014/15, real output in the UK economy increased 2.9% on the preceding 12 months. This is an increase from the 2013/14 growth rate and continues the strong recovery from the 2008/09 economic downturn. By the end of the period, the UK had recorded 9 quarters of consecutive economic growth. While aggregate real GDP surpassed its largely symbolic pre-economic downturn peak in Quarter 2 (Apr to June) 2013, GDP per capita only passed its previous high in Quarter 1 (Jan to Mar) 2015. However, in the 2014/15 financial year, GDP per capita remained 0.1% below the 2007/08 level despite growing by 2.2% between 2013/14 and 2014/15.
The strength of the UK economy over this period has coincided with improvements in the labour market as the demand for labour responded to the robust growth of output. In the 3 months to March 2015, the headline employment rate increased to 73.5%, with the number of people in employment at a record high. Over the same period, the unemployment rate fell to 5.5%, which is 1.3 percentage points lower than a year earlier and the lowest level since mid-2008.
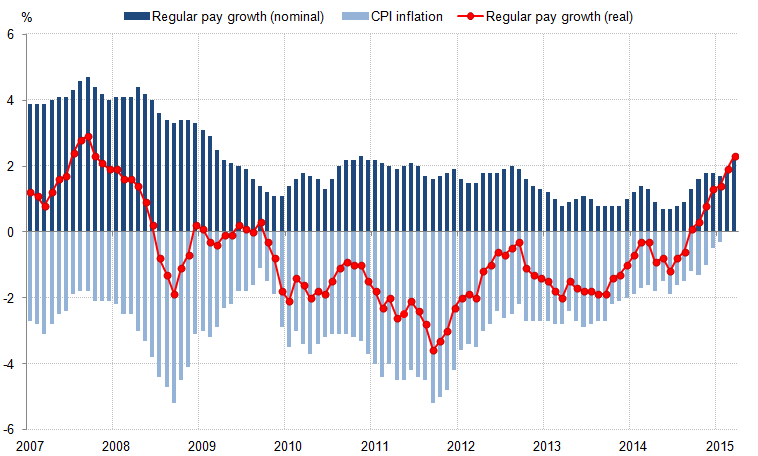
Analysis in the October 2015 Economic Review highlighted the extent of this recent labour market tightening, with a range of indicators suggesting a return towards pre-downturn conditions. As economic theory would suggest, this tightening has been reflected in a pick-up in nominal earnings growth. In the 3 months ending March 2015, regular pay was 2.3% higher than in the same period a year earlier. While this rate remained below the pre-downturn trend, it marked a 1.0 percentage point increase in nominal pay growth from the same period in 2014.
Figure 5: Contributions to the growth of real regular pay: Consumer Price Index (CPI) inflation and the growth of average regular weekly earnings, 2007 to 2015
UK
Source: Office for National Statistics
Notes:
- The data for regular pay presents the 3 months on 3 months a year ago growth rate for the month at the end of the period (the final data is for January to March 2015)
Download this image Figure 5: Contributions to the growth of real regular pay: Consumer Price Index (CPI) inflation and the growth of average regular weekly earnings, 2007 to 2015
.png (33.5 kB)
Alongside growth in earnings, one component that determines households’ real income growth is the rate of price inflation in the economy. In March 2015, the Consumer Price Index (CPI) measure of inflation fell to 0.0%. During the 2014/15 financial year, a sharp fall in the price of oil and increased supermarket competition helped push inflation to record lows, which eased pressure on real household incomes. Combined with a pick-up in nominal earnings growth, the rate of real earnings growth in March 2015 increased to its highest rate since the economic downturn.
Back to table of contents6. Policy context: Changes to taxes and benefits in 2014 to 2015
Some of the main tax and benefit changes occurring during 2014/15 included:
Child tax and working tax credits: The basic element of Working Tax Credit (WTC) rose by £20 (around 1%) to £1,940 a year. The family element of Child Tax Credit (CTC) was frozen at £545 a year, while the child element rose by £30 (around 1%) to £2,750
Benefit uprating: Benefits for working age people, including Universal Credit, Jobseeker’s Allowance and Income Support were increased by 1% in April 2014, below the rate of inflation. Benefits received by disabled people and pensioners (including Personal Independence Payments , Attendance Allowance and Incapacity Benefit) were increased in line with the Consumer Prices Index (CPI) at 2.7%. The State Pension was also increased by 2.7% due to the ‘triple lock’ which guarantees to increase the basic State Pension by the higher of CPI inflation, average earnings or a minimum of 2.5% every year
Personal independence payment: The roll-out of Personal Independence Payment (PIP) continued during 2014/15. PIP is replacing Disability Living Allowance (DLA) for adults aged under 65 in England, Wales & Scotland. PIP is made up of 2 components and paid at a standard and enhanced rate which increased by Consumer Prices Index (CPI) at 2.7% for 2014/15. Eligibility for PIP is assessed using different criteria than for DLA. This assessment includes a review of an individual’s ability to participate fully in society rather than the severity of impairment. All new claimants were assessed for PIP from June 2013. During 2014/15, existing DLA claimants were invited to be assessed for PIP in an increasing number of postcode areas
Child benefit: The rate for a first child rose by £0.20 (around 1%) to £20.50, while the rate for second & subsequent children rose by £0.15 (around 1%) to £13.55 per week, having been frozen for the 3 previous years
Income tax: Age related personal allowances continued to be phased out. The personal allowance for those born after 5 April 1948 increased from £9,440 to £10,000. By contrast, the personal allowances for those born between 6 April 1938 - 5 April 1948 and those born before 6 April 1938 remained at £10,500 and £10,660 respectively. In addition, there was a reduction in the starting level for the higher rate band, from £32,011 to £31,866. Combined with the personal allowance, this meant that people paid the higher rate of 40% on any taxable income above £41,865, up from £41,450 in 2013/14
Council tax: In 2014-15, 60% of eligible local authorities in England made use of a Council Tax freeze grant. This meant that the average band D dwelling council tax set by local authorities in England for 2014-15 was £1,468, an increase of £12 or 0.9% on 2013-14. Council Tax levels were frozen in all local authorities in Scotland. However, in Wales, the average band D Council Tax increased by 4.2% compared with 2013/14
7. About these statistics
How are these statistics produced?
The input data for this analysis comes from the Living Costs and Food (LCF) survey and the Effects of Taxes and Benefits on Household Income (ETB) dataset which is derived from the LCF. Together these provide information on income, expenditure and important family characteristics. These data are first adjusted to reflect how changes in the macro-economic conditions have affected households at different points of the income distribution. The next step of the analysis involves applying the rules of the current tax and benefit system to the household level data to calculate disposable incomes for those households4. Finally, adjustments are made to take into account changes in labour market participation and the socio-demographic characteristics of the population.
For this statistical bulletin, historical income data were used to estimate household income data for the 2013/14 and 2014/15 financial years. The growth rate between the 2 nowcasts for measures such as equivalised disposable income was then applied to the published 2013/14 estimates from the latest Effects of Taxes and Benefits on Household Income (ETB) release, published 29 June 2015.
A detailed description of the methodology is provided in the accompanying article, "Nowcasting household income in the UK: Methodology, 2015 (251 Kb Pdf)".
How do these estimates fit in with other official statistics on household incomes?
These experimental nowcast estimates have been developed to serve as early or provisional estimates of figures which are currently published in the Effects of Taxes and Benefits on Household Income (ETB). When the survey based ETB figures for 2014/15 income are available in 2016, they will supersede these nowcast estimates. We will also use these survey-based figures to evaluate the accuracy of these nowcasts.
The figures published in this bulletin and those in ETB use exactly the same definition of disposable income used in "the Effects of Taxes and Benefits on Household Income" (ETB), which in turn is consistent with the concepts set out in the second edition of the UNECE Canberra Handbook (UNECE, 2011), which sets out the main international standards in this area. Additionally, these estimates and ETB use the same primary data source in the Living Costs and Food survey.
The Department for Work and Pensions (DWP) also publishes analysis each year, particularly focusing on the lower part of the household income distribution, in their publication Households Below Average Income (HBAI). Due to HBAI being based on a larger survey, along with some methodological and conceptual differences, HBAI and ETB estimates for these figures can differ slightly from each other. However, historical trends are broadly similar across the 2 sources. However, these nowcasts use the ETB methodology and data source so may not reflect future changes in HBAI.
What are Experimental Statistics?
The UK Statistics Authority Code of Practice defines Experimental Statistics as “New official statistics undergoing evaluation. They are published in order to involve users and stakeholders in their development and as a means to build in quality at an early stage.”
The data contained within this release have undergone the same high levels of quality assurance as other official statistics. However, as Experimental Statistics, the methodology used to create them remains under development and may be revised following further evaluation. It is therefore recommended that this is taken into account when using the findings.
As with any other nowcast, the accuracy of these indicators will inevitably depend on many factors. Throughout the development work feeding into this bulletin, a variety of approaches have been tested in order to develop a robust methodology, and the experience of external experts has been used in order to make use of international best practice. Despite this, it is unrealistic to expect nowcast estimates to perfectly reflect changes in the distribution of income, particularly when examining smaller sub-groups of the population, meaning that the final survey data may show different patterns of change for some groups. This is taken into account in the level of detail presented in the initial edition of this bulletin.
In line with the UK Statistics Authority’s statement on "Assessment and Designation of Experimental Statistics", we will be carefully evaluating these new estimates against the Code of Practice for Official Statistics. This will include assessments of both the quality of the estimates themselves and the extent to which they meet user needs.
Accuracy and reliability of nowcast estimates
The nowcast estimates are subject to the same degree and types of statistical error as any other analysis based on survey data. In particular, as the LCF data is a sample survey, the estimates are subject to sampling error. Surveys gather information from a sample rather than from the whole population. The sample is designed carefully to allow for this, and to be as accurate as possible given practical limitations such as time and cost constraints, but results from sample surveys are always estimates, not precise figures. This means that they are subject to a margin of error which can have an impact on how changes in the numbers should be interpreted, especially in the short-term. In practice, this means that small, short-term movements should be treated as indicative, and considered alongside medium and long-term patterns in the series.
As well as sampling error, all statistics, including these "nowcast" estimates, are also subject to non-sampling error. Non-sampling error includes all sources of data error that are not a result of the way the sample is selected. Throughout the development work feeding into this bulletin, a variety of approaches have been tested in order to develop a robust methodology and the experience of external experts has been used in order to make use of international best practice. Despite this, it is unrealistic to expect nowcast estimates to perfectly reflect changes in the distribution of income, particularly when examining smaller sub-groups of the population, so the estimates should be treated as providing an early indication of what the full survey-based data will show.
Further information is available in the Accuracy of the Statistics: Estimating and Reporting Uncertainty section of this Statistical Bulletin.
Back to table of contents