Table of contents
- Cohort fertility, England and Wales
- Introduction
- Key figures
- What is cohort fertility?
- Average family size
- Childlessness
- Number of children
- The changing age pattern of fertility
- Further releases on live births in 2011 in England and Wales also published on 7 March 2013
- Users and uses of birth statistics
- Further information
- Changes to outputs
- Background notes
1. Cohort fertility, England and Wales
- The average completed family size for women born in 1966, and reaching age 45 in 2011, was 1.91 children per woman. This compares with their mothers’ generation, represented by women born in 1939, who had on average 2.36 children
- Two children was the most common family size for women born in both 1939 and 1966
- The level of childlessness among women born in 1966 is higher than for women born in 1939. One in five women born in 1966 remained childless, compared with about one in eight born in 1939
- One in ten women born in 1966 had four or more children, compared with nearly one in five women born in 1939
- Women born in 1981 have had slightly fewer children on average (1.01) by their 30th birthday than women born in 1966 (who had 1.17 children on average by the same age)
2. Introduction
This bulletin presents statistics on childbearing among women in England and Wales. These figures are presented by the year of birth of mother – for ‘cohorts’ of women born in the same year - rather than by the year of birth of child. The estimates have been updated with 2011 births, the latest data available, which means that completed family size for women born in 1966 (reaching age 45, the end of their childbearing years in 2011) is presented for the first time.
These are also the first cohort fertility tables to include the impact of rebasing of population estimates from 2002-2010 in line with the results of the 2011 Census (affecting female cohorts born from 1957 to 1995), hence this bulletin is published slightly later than in previous years due to the rebasing timetable. More details on this rebasing can be found in the reference tables.
This statistical bulletin provides supporting commentary for the cohort fertility package which includes reference tables on:
average number of live-born children, age and year of birth of woman, 1920-1996
proportion of women who have had at least one live birth, age and year of birth of woman, 1920-1996. Includes proportion of women remaining childless (by the end of their childbearing years)
percentage distribution of women of childbearing age by number of live-born children, age and year of birth of woman, 1920-1991
age-specific fertility rates, age and year of birth of woman, 1920-1996
3. Key figures
Table A shows the average family size and estimated family size distribution for women who have completed their childbearing years in 2011, and of the cohort assumed to be their mothers. The 1939 cohort is assumed to be their mothers' generation because the average age of mothers giving birth in 1966 was 27 years, and women of that age were born in 1939.
This comparison of the most recent cohort to have finished their childbearing with their mothers' cohort lets us examine change over time. The completed family size of the 1966 cohort is much smaller than for the 1939 cohort, and the proportion of women remaining childless is substantially higher for the 1966 cohort.
Table A: Average family size and estimated family size distribution for women who have completed their families, by year of birth of woman, selected cohorts.
| England and Wales | |||||||
| Year of birth of woman | Average completed family size | Number of live-born children (%)1 | |||||
| Childless | 1 | 2 | 3 | 4+ | Total | ||
| 1939 | 2.36 | 12 | 13 | 35 | 22 | 18 | 100 |
| 1966 | 1.91 | 20 | 14 | 38 | 18 | 10 | 100 |
| Source: Office for National Statistics | |||||||
| Notes: | |||||||
| 1. Percentage of women with 0, 1, 2, 3 or 4+ children at age 45 | |||||||
Download this table Table A: Average family size and estimated family size distribution for women who have completed their families, by year of birth of woman, selected cohorts.
.xls (54.3 kB)4. What is cohort fertility?
A cohort is a group of women born in the same year. Cohort fertility analysis explores whether current generations of women of childbearing age are reaching, exceeding or falling short of the fertility levels of previous generations. This bulletin contains statistics on changes in average family size for past and present cohorts, levels of childlessness for different cohorts of women, and the proportions of women having one, two or more children.
The key cohort presented here is women born in 1966, who were aged 45 in 2011 (see note 1) . This is the most recent cohort that is assumed to have completed their childbearing (see note 2). This statistical bulletin compares the completed family size of women born in 1966 with that of their mothers’ generation; the average age of mothers giving birth in 1966 was 27 years, and women of that age were born in 1939.
Women born in 1981, who have reached age 30 in 2011, are also used as a comparison group, as age 30 may be considered the mid-point of childbearing age. This bulletin compares the achieved fertility of the 1981 cohort by this age with that of previous cohorts by the same age.
Notes for what is cohort fertility?
- The ages of women are presented in 'exact years'. Therefore figures should be interpreted as the average number of children a woman has had up to that birthday. So childbearing up to exact age 30 includes cumulative fertility through her lifetime up to the day before her 30th birthday. Any childbearing in the 12 months from her 29th birthday onwards will be included in fertility up to exact age 30. See background note 4 for a more technical explanation.
- A woman is assumed to have completed her childbearing by the last day she is aged 45, that is by her 46th birthday (exact age 46). Completed fertility includes fertility rates up to and including age 45. See background note 4 for a more technical explanation.
5. Average family size
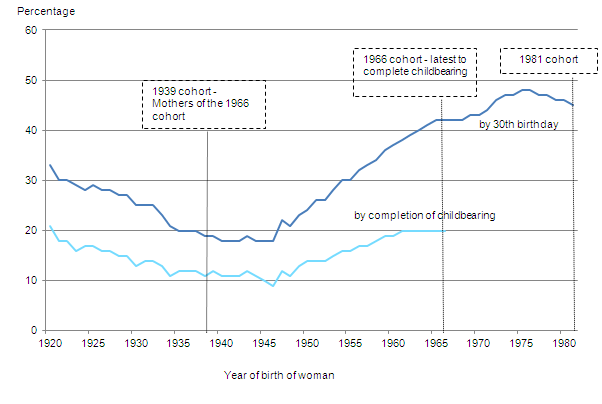
The average number of live-born children a woman has by the end of her childbearing years (completed family size) has been falling for recent cohorts (Figure 1). Women born in 1966 had on average 1.91 live-born children. This compares with women born in the 1930s and 1940s, who had on average between 2.1 and 2.4 children. Cohorts of women born from 1958 onwards have had on average fewer than two children per woman. This decrease in the average family size is mainly due to rising levels of childlessness, which is discussed further in the next section.
Figure 1 - Average number of live-born children, by age 30 and completed family size, by year of birth of woman
England and Wales
Source: Office for National Statistics
Notes:
- Table 1 in the cohort fertility release and Figure 1 (above) measure cumulative fertility. For example, Figure 1 shows that women born in 1966 had given birth to 1.17 children on average up to their 30th birthday (this includes fertility up to and including age 29), and 1.91 by the end of their childbearing years
- Completed family size includes births after the 46th birthday, achieved up to the end of 2011 by women born in 1966 and earlier years. See background note 2 for details of the impact of births after age 40
- 1939 cohort - Mother of the 1966 cohort
- 1966 cohort - latest to complete childbearing
Download this chart Figure 1 - Average number of live-born children, by age 30 and completed family size, by year of birth of woman
Image .csv .xlsThe average number of children women have had up to their 30th birthday can give an indication of more recent trends in family size. The 1966 cohort had 1.17 children on average by their 30th birthday, compared with 1.87 by the same age for their mothers' generation, the 1939 cohort. Overall, women born in the 1960s and 1970s have had fewer children by age 30 than previous generations. This reflects their postponement of childbearing to older ages, for reasons including:
increased participation in higher education
delayed marriage and partnership formation
the desire to establish a career, get on the housing ladder and ensure financial stability before starting a family (see notes 1 and 2)
However, Figure 1 shows a slight upturn in average family size by the 30th birthday for the most recent cohorts, from 0.99 children for the 1975 cohort to 1.01 for the 1981 cohort. This is mainly because women born in 1981 had higher fertility rates in their late twenties than those born in 1975. There is no single explanation for this increase, but possible reasons include the changes in support for families introduced since the late 1990s (such as tax credits and maternity/paternity leave), and the increasing proportion of women aged 25-29 who were born outside the UK (with fertility above the UK born average) (see note 3).
Notes for average family size
Jefferies, J (2008), Fertility assumptions for the 2006-based national population projections (297 Kb Pdf) , Population Trends, no 131, pp 18-27
Bhrolchain, M, Beaujouan, E (2012) Fertility postponement is largely due to rising educational enrolment, Population Studies, A Journal of Demography, Volume 66, issue 3, pp. 311-327
Zumpe, J, Dormon, O, and Jefferies, J (2012) Childbearing among UK born and non-UK born women living in the UK. Office for National Statistics
6. Childlessness
Childlessness is estimated as the proportion of women who have not had a live birth by a specific age.
Figure 2 - Percentage of women remaining childless by their 30th birthday and at completion of childbearing, by year of birth of woman
England and Wales
Source: Office for National Statistics
Notes:
- The percentage of women remaining childless by age 30 and by completion of childbearing is calculated as 1 minus the proportion of women who have had at least one live birth by that age, multiplied by 100. This calculation takes into account all first live births from a woman's teenage years through to the last day she is 29 (the day before her 30th birthday) or the last day she is 45 (the day before her 46th birthday)
Download this image Figure 2 - Percentage of women remaining childless by their 30th birthday and at completion of childbearing, by year of birth of woman
.png (17.7 kB) .xls (43.0 kB)
Figure 2 shows that the level of childlessness for women reaching age 45, born in 1966, has levelled off at the 40 year high that it reached for the 1961 cohort and remains comparable with that of women born in 1920. One in five women born in 1966 (and 1920) remained childless by the end of their childbearing years compared with one in eight women born in 1939. The lowest level of childlessness in the series was seen for the 1946 cohort, where only one in eleven women remained childless at age 45. A wide range of explanations relating to circumstances and choices have been put forward for the increasing childlessness seen in recent cohorts. These include the decline in the proportion of women married, changes in the perceived costs and benefits of childrearing versus work and leisure activities, greater social acceptability of the childfree lifestyle and the postponement of decisions about whether to have children until it may be biologically too late (see note 1).
By their 30th birthday, 45% of the 1981 cohort were childless, a slightly higher proportion than for the 1966 cohort at the same age (42%). This highlights the trend that women have been increasingly delaying having children to older ages. However, Figure 2 shows that the proportion of women childless by age 30 has been falling for successive cohorts born from 1975 onwards (when 48% of women had not yet had a live birth by age 30). This suggests a slight reversal and reflects the higher levels of childbearing among women in their late twenties born in 1981 compared with those born five years earlier.
Figure 3: Percentage of women remaining childless by their 20th birthday, by year of birth of woman
England and Wales
Source: Office for National Statistics
Notes:
- The percentage of women remaining childless by age 20 is calculated as 1 minus the proportion of women who have had at least one live birth by that age, multiplied by 100. This calculation takes into account all first live births from a woman's teenage years through to the last day she is 19 (the day before her 20th birthday)
Download this chart Figure 3: Percentage of women remaining childless by their 20th birthday, by year of birth of woman
Image .csv .xlsFigure 3 shows that the proportion of women remaining childless by age 20 has been gradually increasing for more recent cohorts, from around eight in ten for women born in 1950, to around nine in ten women for those born in 1991, the most recent cohort to reach age 20. This shows that the proportion of women becoming mothers during their teenage years is falling. The level of childlessness in 20 year old women remains below that of the cohorts born in the early 1920s where around 93% of women remained childless by age 20.
Notes for childlessness
For reasons for increasing childlessness, see for example:
O'Leary, L, Natamba, E, Jefferies, J and Wilson, B (2010) Fertility and partnership status in the last two decades (2.5 Mb Pdf) , Population Trends 140, pp 5-35
Simpson, R (2009) Delayed childbearing and childlessness in Britain, in Stillwell, J, Kneale, D and Coast, E (eds.) Fertility, Living Arrangements, Care and Mobility Understanding Population Trends and Processes Volume 1, Springer, Dordrecht, pp. 23-40.
Kneale D, Joshi H (2008) Postponement and childlessness: Evidence from two British cohorts Volume 19, Article 58,
Basten, S (2009) Voluntary childlessness and being Childfree. The Future of Human Reproduction: Working Paper #5, St Johns College, Oxford and Vienna Institute of Demography,
Berrington, A M. (2004) Perpetual postponers? Women's, men's and couple's fertility intentions and subsequent fertility behaviour (137.7 Kb Pdf). Population Trends 117: 9-19
7. Number of children
Figure 4: Estimated family size distribution for women born between 1920 and 1966 who are assumed to have completed their childbearing
England and Wales
Source: Office for National Statistics
Download this chart Figure 4: Estimated family size distribution for women born between 1920 and 1966 who are assumed to have completed their childbearing
Image .csv .xlsThe traditional two-child family remains the most common family type in England and Wales, with 38% of women born in 1966 having two children (Figure 4, Table B). Childlessness is the second most common family size for the 1966 cohort. This is a recent development first encountered among the 1964 cohort, whereas for those born between the late 1930s and early 1960s, three children was the second most common family size. A woman born in 1939 was more likely to have one, three or, ‘four or more’ children than not to have any. Only one in ten women born in 1966 had four or more children, compared with nearly one in five in the 1939 cohort (Table B).
Table B: Average family size and estimated family size distribution for women who are assumed to have completed their childbearing, by year of birth of woman, 1920 to 1966
| England and Wales | |||||||
| Year of birth of woman | Average completed family size | Number of live-born children (%)1 | |||||
| Childless | 1 | 2 | 3 | 4+ | Total | ||
| 1920 | 2.00 | 21 | 21 | 27 | 16 | 15 | 100 |
| 1925 | 2.12 | 17 | 22 | 28 | 17 | 16 | 100 |
| 1930 | 2.35 | 13 | 18 | 30 | 19 | 20 | 100 |
| 1935 | 2.42 | 12 | 15 | 32 | 21 | 20 | 100 |
| 1940 | 2.36 | 11 | 13 | 36 | 22 | 18 | 100 |
| 1945 | 2.19 | 10 | 14 | 43 | 21 | 12 | 100 |
| 1950 | 2.07 | 14 | 13 | 44 | 20 | 10 | 100 |
| 1955 | 2.02 | 16 | 13 | 41 | 19 | 11 | 100 |
| 1960 | 1.98 | 19 | 12 | 38 | 20 | 11 | 100 |
| 1965 | 1.91 | 20 | 13 | 38 | 19 | 10 | 100 |
| 1966 | 1.91 | 20 | 14 | 38 | 18 | 10 | 100 |
| Source: Office for National Statistics | |||||||
| Notes: | |||||||
| 1. Percentage of women with 0, 1, 2, 3 or, 4+ children who have completed their childbearing | |||||||
Download this table Table B: Average family size and estimated family size distribution for women who are assumed to have completed their childbearing, by year of birth of woman, 1920 to 1966
.xls (55.8 kB)The proportion of women with a one-child family remained relatively stable for women born between 1940 and 1966 with 14% of women born in 1966 having a one-child family. The proportion of women with only one child was highest for women born in the 1920s, where around one-fifth had one child – this may be because their marriage and childbearing was delayed or disrupted by World War II.
Back to table of contents8. The changing age pattern of fertility
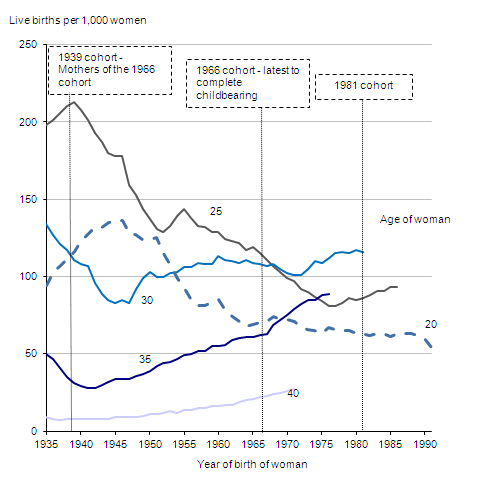
Looking at the fertility rates of selected cohorts at particular age milestones highlights how the age distribution of women giving birth has varied over time. As an example, the two vertical lines on Figure 5 allow a comparison of the age profile of fertility in the 1966 cohort, who have completed their childbearing, with that of the 1981 cohort to date.
Figure 5 - Age-specific fertility rates at selected ages, by year of birth of woman, 1935 to 1991
England and Wales
Source: Office for National Statistics
Download this image Figure 5 - Age-specific fertility rates at selected ages, by year of birth of woman, 1935 to 1991
.png (23.2 kB) .xls (117.2 kB)
For the 1966 cohort the highest fertility rate of those shown was at the age of 25, closely followed by age 30. Lower levels of fertility were recorded at the ages of 20 and 35, while the number of live births per 1,000 women at age 40 was lower still. On average the 1966 cohort had 1.91 children per woman.
Age-specific fertility rates for the 1981 cohort are currently only available up to the age of 30. For this cohort, fertility rates at age 30 were a little higher than for the 1966 cohort and at a level last encountered by women born in the late 1930s. In contrast, fertility at age 20 was similar to the 1966 cohort, while at the age of 25 it was much lower for the 1981 cohort than for the 1966 cohort.
Fertility at age 25 hit a low for women born in 1977 before rising slightly among cohorts born between 1978 and 1985. Consequently, 25 year olds born in 1981 had 25% fewer live births per 1,000 women at this age (91 births per 1000 women) than 25 year olds who were born in 1966 (115 births per 1000 women).
If recent trends continue, the 1981 cohort would be expected to have an older average age at childbearing than the 1966 cohort.
Back to table of contents9. Further releases on live births in 2011 in England and Wales also published on 7 March 2013
Other releases published on 7 March 2013:
Characteristics of Mother 2 – this package presents live birth statistics (numbers and rates) within and outside marriage/civil partnership. It also provides data on first live births by marriage/civil partnership duration, and live births within marriage/civil partnership by age of mother and number of previous live-born children
Further Parental Characteristics – this package presents age-specific fertility rates for men, the average age of father, and paternities within and outside marriage/civil partnership. See Characteristics of Mother 1 and 2 for birth statistics by age of mother, type of registration (within marriage/civil partnership, joint, sole) and number of previous live-born children
Live Births by Socio-economic Status of Father – this package presents data on birth registrations in England and Wales by National Statistics Socio-economic Classification (NS-SEC) of father as defined by occupation. For information on proposed changes please see the "Changes to Outputs" section
Key findings from these releases:
The standardised mean age of all fathers at the birth of their child has increased by nearly two years over the last two decades from 30.8 years in 1991 to 32.6 in 2011 (see background notes 6 and 7). The standardised mean age of mother increased by a similar amount over the same period, from 27.7 in 1991 to 29.7 in 2011
For men, the 30–34 age group had the highest fertility rate in 2011, the same age group that had the highest fertility rate for women. Previously, men in their mid-to-late twenties had the highest fertility rate but were overtaken in 1993 by men in their early thirties. The same trend occurred among women a decade later, with the fertility of women in their early thirties overtaking that of women in their mid-to-late twenties in 2004
The median interval between women in the UK having a first and second birth was 36 months in 2011. The median interval between second and third births was slightly longer (40 months)
In 2011, 42% of live births within marriage/civil partnership were first births, 36% were second births and 14% were third births
10. Users and uses of birth statistics
The Office for National Statistics uses birth statistics to:
produce population estimates and population projections, both national and subnational
quality assure census estimates
report on social and demographic trends
Department of Health are another key user of the data. Other users include academics, demographers, health researchers, lobby groups, international organisations and the media.
Cohort fertility statistics and estimates of fertility by family size are primarily used by ONS for producing the fertility component of population projections and for reporting on social and demographic trends.
The Department for Work and Pensions uses information on family size for modelling pensions, benefits and the future number of lone parents.
Estimates of childlessness are of interest to policymakers concerned with the support and care available to people at older ages. Estimates of family size are of use to special interest groups such as organisations and networks supporting large families and for people who are, or who have, an only child.
Back to table of contents