1. Main points
The economy grew by 0.5% in the third quarter of 2015, slightly slower than in the previous quarter. Output growth was strongest in the services industries, while output in manufacturing and construction is estimated to have fallen in the 3 months to September 2015
The unemployment rate has fallen sharply since mid-2013, and is currently just 0.3 percentage points above its 2002 to 2007 average. This fall has been broadly based, affecting the levels of both short- and long-term unemployment
Average weekly regular pay grew by 2.8% in the three months to August 2015, continuing the recovery which started in earnest in mid-2014. The growth rate of real earnings has also picked up since the beginning of 2014, albeit from well below pre-downturn levels
Inflation as measured by the Consumer Prices Index (CPI) fell back to -0.1% in the year to September 2015. Much of the recent fall in inflation is due to weak price pressure from energy, food and fuel, although price growth across a broader range of products has also weakened in recent months
The fall in UK’s primary income account is partly explained by the weakness of rates of return on the UK's weakest and mid-performing overseas assets during recent years. By contrast, the rates of return earned by overseas investors in the UK have been relatively stable over this period
2. Introduction
The preliminary estimate of Gross Domestic Product (GDP) indicated that the growth of the UK economy slowed from 0.7% in Q2 2015 to 0.5% in Q3 2015, and from 2.4% to 2.3% compared to the same quarter a year earlier. While the output of the services industries is estimated to be 11.1% above its pre-downturn peak, the manufacturing industry remains 6.3% below this yardstick. Over the recovery, there has also been a shift in the composition of services output away from financial services toward other services.
The unemployment rate fell from 7.7% in the three months to August 2013, to 6.0% in the same period the following year and to 5.4% in the most recent data. This edition of the Review shows that the fall has been broad based across workers that have been unemployed for a range of durations - including those who have been unemployed for longer than two years - which contrasts with earlier downturns.
Growing evidence of tightening in the labour market has been accompanied by a sharp rise in the rate of earnings growth, driven in part by a sharp recovery in private sector earnings growth. Combined with relatively stable prices, the trend of falling real earnings following the economic downturn has partly reversed, albeit to differing extents across industries. Stronger growth in earnings and employment have also had a correspondingly positive impact on measures of household income, with recent experimental ONS estimates suggesting median household income rose 3.0% in the year to March 2015.
Domestic price pressure in the UK economy remains weak, with factors such as the recent fall in the oil price, the strength of Sterling and strong competition among retailers acting to reduce the Consumer Prices Index (CPI) inflation rate. Energy, food and fuels account for a large fraction of the recent movement in the CPI, while housing, transport and education have made a relatively stable contribution in recent quarters. However, there is some evidence of weakening price pressure among the remaining class level items in the CPI. A diverse range of goods within this group – including second hand cars and information processing equipment – have put downward pressure on the CPI in recent months.
The recent weakness of the current account has largely been driven by a fall in the UK’s balance on primary income – mainly as a consequence of a deteriorating Foreign Direct Investment (FDI) income balance. ONS recently published a detailed examination of some of the factors affecting FDI income alongside the annual Pink Book publication on 30 October. This edition of the Review focuses on the distribution of the rates of return on the UK’s FDI analysis, which have been identified as a key factor in the recent development of the current account balance.
Back to table of contents3. GDP
The preliminary estimate of Gross Domestic Product (GDP) indicated that the UK economy grew by 0.5% in the third quarter of 2015, slower than the 0.7% growth recorded in the second quarter of 2015. Compared to the same quarter of the previous year, GDP growth also slowed from 2.4% to 2.3%. However, this extends a run of 11 consecutive quarters of positive quarterly growth during 2013, 2014 and 2015. GDP has risen by 13.3% compared to the trough of the economic downturn in Q2 2009 and is now 6.4% higher than the pre-downturn level of output in Q1 2008.
Figure 1 indexes the level of output in the headline industries to 100 at Q1 2008. This shows that the services industries have performed most strongly over the last seven years, continuing the shift of output towards these industries and away from manufacturing. It also shows that the recent reduction in GDP growth has been driven by falling output in the construction and manufacturing industries, as well as slower output growth in non-manufacturing production (including the oil and gas extraction and the utilities industries). In contrast, the output of the services industries experienced a slight increase in growth to 0.7% in the third quarter.
Figure 1: Output by industry; constant prices, seasonally adjusted, Q1 2008=100
UK
Source: Office for National Statistics
Download this chart Figure 1: Output by industry; constant prices, seasonally adjusted, Q1 2008=100
Image .csv .xlsAs a consequence, the services industries have been the most important and consistent driver of the UK’s economic recovery. Between the trough of the downturn in Q2 2009 and the most recent quarter, services growth accounted for 12.5 percentage points of the growth in whole economy output, while manufacturing and construction growth accounted for 0.7 and 0.9 percentage points respectively. However, this is not out of line with the consistent trend seen over the past 6 decades, as strong growth in the services industries has gradually enlarged the share of total output for which they account. In 1948, the services industries accounted for 45.8% of the economy’s output, a proportion that rose to 57.7% in 1978, 66.9% in 1990 and 78.6% in 20141.
Figure 2 examines the services industries in more detail, by plotting the most recent growth (black dot) alongside pre-downturn trend rates of growth (dark bars) and post-downturn average growth rates (light bars). However, as these services industry groupings can conceal differing performances for the sub-industries within each grouping, Figure 2 should be considered alongside Figure 3, which calculates the contributions to GDP growth for the same periods, but at a finer level of industry detail. The colour codes in Figures 2 and 3 show the sub-industries that are attributed to the industry groupings.
Figure 2: Growth rates for the 4 services sub-industries compared against their 10 year pre-downturn average, recovery average (Q2 2009 to Q3 2015) and Q3 2015 values, chained volume measure, seasonally adjusted
Percent, UK
Source: Office for National Statistics
Notes:
- Recovery comprises Q2 2009 to Q3 2015 inclusive
Download this chart Figure 2: Growth rates for the 4 services sub-industries compared against their 10 year pre-downturn average, recovery average (Q2 2009 to Q3 2015) and Q3 2015 values, chained volume measure, seasonally adjusted
Image .csv .xls
Figure 3: Contributions to growth in the output measure of GDP in Q3 2015, 10 year pre-downturn average, recovery average (Q2 2009 to Q3 2015) and Q3 2015 values, quarter on quarter, chained volume measure, seasonally adjusted
Percentage points, UK
Source: Office for National Statistics
Notes:
- Recovery comprises Quarter 2 2009 to Quarter 3 2015 inclusive
Download this chart Figure 3: Contributions to growth in the output measure of GDP in Q3 2015, 10 year pre-downturn average, recovery average (Q2 2009 to Q3 2015) and Q3 2015 values, quarter on quarter, chained volume measure, seasonally adjusted
Image .csv .xlsThe more recent data also show a shift within the services industries, away from financial services toward non-financial business services. In the latest quarter the ‘business services and finance’ industry achieved relatively strong growth of 1.0%, stronger than the recovery average quarterly growth rate of 0.7%. However, during the recovery as a whole, Figure 3 shows that much of this growth has been concentrated in industries such as administrative and support services, professional services such as accountancy and architecture, and real estate. By contrast, output in the financial industry has declined since the start of the economic recovery, recording negative average growth rates over this period. Although it recovered quite strongly in the latest quarter, the level of financial and insurance output remains 7.4% below Q1 2008 levels.
While services output growth in the most recent quarter was fairly broad based, with 12 of the 14 services sub-industries expanding, the decline in manufacturing output over the same period was also fairly widespread. Although total manufacturing output contracted at a slower rate in Q3 2015 (-0.3%) when compared with Q2 2015 (-0.5%), 8 of the 13 manufacturing sub-industries experienced falling growth rates over this period. The biggest fall in output occurred in the textiles industry (down from 3.8% to -4.6% in Q2 2015 and Q3 2015 respectively) and other manufacturing (down from -0.3% to -3.4%). However, the manufacture of coke and refined petroleum products saw a large increase in growth between Q2 2015 and Q3 2015 (up from -5.4% to 12.2%), coinciding with significant increases in the output of the extraction of crude petroleum and natural gas industry over the last 2 quarters.
Notes for GDP
- Data for 1948 and 1978 will not be entirely aligned with the remaining data, which are consistent with Standard Industrial Classification (SIC). Data consistent with SIC are not available on a yearly basis prior to 1990. For more information, see 'UK Service Industries: definition, classification and evolution' (ONS, 2013)
4. Labour Market
The continued recovery of GDP has also had a substantial effect on the labour market, as firms have drawn in more labour to meet growing demand. The employment rate rose to a record high of 73.6% of the working age population in the three months to August 2015, up from 73.0% in the same period a year earlier, and from 71.5% in the three months to August 2013. The unemployment rate has also fallen sharply since mid-2013 (Figure 4), falling from 7.7% among those aged 16 and above in the three months to August 2013, to 6.0% in the same period the following year and to 5.4% in the most recent data. Unemployment is now at its lowest rate since the three months to May 2008, just 0.3 percentage points above its long run average of 5.1% between 2002 and 2007.
Figure 4: Unemployment rate by duration, 16+
Percent, UK

Source: Office for National Statistics
Notes:
- Dotted lines indicate the long term average for the respective series between 2002 and 2007
Download this image Figure 4: Unemployment rate by duration, 16+
.png (31.7 kB)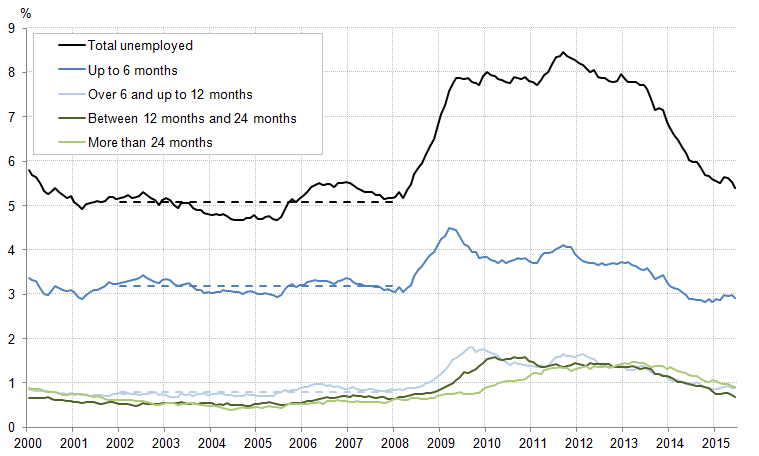
This fall in the unemployment rate has also been broadly based. While unemployment rates remain elevated for young workers, these have been falling in recent periods, as have rates for workers of different unemployment durations. The fall in the headline rate to close to its 2002 to 2007 average has been reflected in particular in the rate of short-term unemployment – defined as those who have been out of work for less than six months. The rate of short-term unemployment, which grew to 4.5% of the workforce in early 2009, has gradually fallen and is now below its long-term average – indicating that workers who have recently become unemployed are moving out of unemployment relatively swiftly. Longer unemployment durations – which increased initially as individuals moved from short- to longer-term unemployment – have also started to fall. This suggests that the UK economy appears to have experienced less of a build up of long-term unemployed workers than in previous economic downturns, whose skills, confidence and motivation is thought to atrophy with time.
The recent fall in the unemployment rate and growing evidence of tightening in the labour market has been accompanied by a sharp rise in the rate of average earnings growth. Average weekly regular pay grew at an annual rate of 2.8% in the three months to August 2015, continuing the recovery which appears to have started in earnest in mid-2014. Private sector regular pay has been particularly strong over recent months, growing at an annual rate of 3.2% in the three months to August, and continues a run of strong monthly outturns. As a result, both the whole economy and private sector average weekly earnings series are growing at among their fastest rates since 2009. Public sector regular pay, by contrast, grew relatively slowly over the same period. Excluding financial institutions, average weekly pay growth in the public sector was just 1.4% between the three months ending August 2014 and the three month period ending August 2015. This is in marked contrast to the experience during the early part of the economic downturn: public sector earnings growth supported aggregate average weekly earnings growth through this earlier period.
Figure 5: Average Weekly Earnings, regular pay growth, three month on same three months a year earlier
Percent, UK
Source: Office for National Statistics
Notes:
- From July 2009 Royal Bank of Scotland Group plc is classified to the public sector; for earlier time periods it is classified to the private sector. Between July 2009 and March 2014 Lloyds Banking Group plc is classified to the public sector; it is classified to the private sector for earlier and later time periods
Download this chart Figure 5: Average Weekly Earnings, regular pay growth, three month on same three months a year earlier
Image .csv .xlsThe return of stronger earnings growth and the steady fall in the rate of inflation have both had a positive impact on the rate of real earnings growth. Stronger nominal pay growth since mid-2014, combined with a fall in inflation to close to zero during much of 2015, have partly reversed the downwards trend in real earnings which set in following the recent economic downturn. Figure 6 shows whole economy real average weekly earnings – as well as those in selected industries – indexed to their respective levels in 2008. At the whole economy level, it shows that real weekly regular pay declined by close to 7.8% between 2008 and early 2014, largely mirroring the performance of the services sector. Real regular pay in the manufacturing (-3.5%) and retail industries (-6.3%) also fell over this period – albeit to a lesser extent – as did earnings in finance and business services (-4.8%): the early resilience of this latter industry giving way to real earnings declines in late 2012. The impact of the economic downturn on real earnings in the construction industry was particularly severe: falling by close to 11.6% over the same period. While some of these movements reflect changes in average weekly hours and the composition of the workforce, this period of weak real earnings growth was a marked break from historical trends.
Figure 6: Real Average Weekly Earnings, regular pay growth 2008=100
UK
Source: Office for National Statistics
Notes:
- These indices are constructed by deflating the appropriate Average Weekly Earnings, regular pay series (non-seasonally adjusted) using the Consumer Prices Index (CPI)
Download this chart Figure 6: Real Average Weekly Earnings, regular pay growth 2008=100
Image .csv .xlsSince mid-2014, however, these downwards trends have started to reverse. Whole economy real earnings are now 5.1% below their 2008 level, while earnings in the financial, manufacturing and retail industries are now 2.5%, 3.0% and 2.1% below their 2008 levels respectively. In construction, the recovery has been relatively slow until recent months – when earnings growth has picked up notably. However, this series is relatively volatile: it remains to be seen whether the recent acceleration of earnings growth can be sustained.
The combination of stronger nominal earnings, weakening inflation and growth in employment has had a correspondingly positive impact on measures of household income in recent years. Real median equivalised disposable household income grew by 3.4% in 2013/14 – rising from just over £24,000 in 2012/13 to £24,900 in 2013/14. Recently published ONS nowcasts of median household income – which use published data on employment and earnings growth to simulate the developments in the distribution of household income – suggest that this trend continued into 2014/15. These experimental estimates indicate that median real household income grew by 3.0% in the year to March 2015 (Table 1) to £25,600 – around 1.3% higher than the previous record high in 2009/10.
Table 1: Real median equivalised disposable household income growth: average annual growth rates, selected periods
| % | |||
| Retired households | Non-retired households | All households | |
| 1988-1998/99 | 3.5 | 1.5 | 1.8 |
| 1998/99-2008/09 | 2.9 | 2.3 | 2.3 |
| 2008/09-2013/14 | 2.1 | -0.8 | -0.1 |
| 2013/14 | 3.9 | 2.7 | 3.4 |
| 2014/15 (p) | 1.9 | 3.0 | 3.0 |
| Source: Office for National Statistics | |||
| Notes: | |||
| 1. Growth rates calculated as compound average annual growth rates. Retired households are defined as households in which the combined income of retired members amounts to at least half the total gross income of the household | |||
Download this table Table 1: Real median equivalised disposable household income growth: average annual growth rates, selected periods
.xls (55.3 kB)The experimental nowcasts also suggest that income growth has varied considerably between households of different types. Median real household income for non-retired households – which grew by close to 2.3% per year on average over the decade prior to the economic downturn – fell by 0.8% per year on average over the 2008/09 to 2013/14 period, reflecting the weakness of earnings growth and the fall in the employment rate during the economic downturn. Real median household income among this group consequently remains below its pre-downturn level. Median income growth among retired households has been relatively strong by comparison, as these households were both insulated from the impact of lower earnings and employment and benefited from the indexation of pension payments over this period. Income growth among these households fell from an average of 2.9% per year in the decade prior to 2008/09, to 2.1% per year during the recovery, to 1.9% in the nowcast estimates. These trends have helped to lift median real income for retired households from 66% of median non-retired household income to just over 75% between 2008/09 and 2014/15 (Figure 7).
Figure 7: Ratio of median real household income for retired to non-retired households
Percent, UK
Source: Office for National Statistics
Notes:
- Retired households are defined as households in which the combined income of retired members amounts to at least half the total gross income of the household
Download this image Figure 7: Ratio of median real household income for retired to non-retired households
.png (18.6 kB)
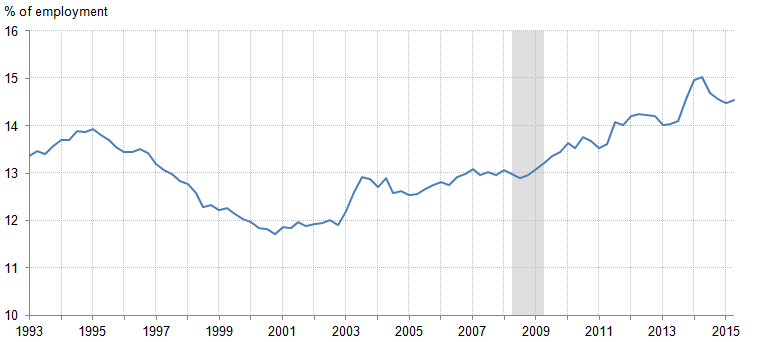
Non-retired household income growth has also been supported by the growth of self employment in recent years – earnings from which are not captured by the average weekly earnings series presented in Figures 5 and 6. As explained in a previous edition of the Economic Review, self employment accounts for a large share of the growth in employment during the economic recovery, and has risen from 11.7% of total employment to close to 15.0% between Q4 2000 and Q1 2014. This trend appears to have been unaffected by the economic downturn, but has started to moderate over the last year. Movements in self employment will be the subject of a more detailed article published by ONS before the end of 2015.
Figure 8: Self-employed workers as a proportion of total employment
Percent, UK
Source: Office for National Statistics
Download this image Figure 8: Self-employed workers as a proportion of total employment
.png (18.2 kB)
5. Inflation
Despite the relative strength of the recovery and growing evidence of a tightening in the labour market, price pressure in the UK economy has remained weak. Inflation as measured by the Consumer Prices Index (CPI) fell back to its joint record low of -0.1% in the year to September 2015, following 0.1% and 0.0% in July and August respectively. CPI goods inflation fell from -2.0% to -2.4% in September, partly offset by a slight increase in services inflation from 2.3% to 2.5% over the same period.
Much of the recent downwards pressure on CPI inflation has come from energy, food and fuels – partly reflecting the fall in the oil price, the appreciation of Sterling and strong competition among retailers. Figure 9 plots contributions to annual CPI inflation since 2003. It shows that the electricity, gas and fuel (including automotive fuels) components have consistently acted to reduce the annual CPI inflation rate by between 0.7 and 0.8 percentage points over the last year. The relatively stable size of this contribution also suggests that the fall in the oil price has largely had a one-off effect which – absent any further changes in the oil price – will drop out of the annual comparison around the turn of the year. However, more recent falls in fuel prices (for example the price of petrol fell by 3.7 pence per litre between August and September 2015) act to complicate the potential magnitude and timing of this effect.
Figure 9: Contributions to CPI inflation
Percent and percentage points, UK
Source: Office for National Statistics
Notes:
- Stacked bars reflect the percentage point contributions of each class-level item in the Classification of Individual Consumption by Purpose (COICOP) to the annual percentage change in the Consumer Prices Index. The contribution of each class-level item is estimated separately, before being aggregated to the categories above. Note that a reduction in the contribution of series to the annual rate of change need not imply falling prices, but could also reflect a lower rate of increase
- Food & drink is composed of food, non-alcoholic and alcoholic beverages and tobacco. Housing is composed of actual rents and products and services for the repair of dwellings. Elect., gas & fuel includes electricity, gas and other household fuels as well as fuels and lubricants for motor vehicles. Transport & package holidays includes passenger transport by road, rail, air and sea, as well as package holidays. Education reflects the division-level contribution. The ‘other’ category reflects the combined contributions of the remaining 56 class-level items and a small rounding error, bringing the sum of contributions to the CPI. See the Guidance & Methodology pages of the ONS website for more details on the goods and services included in CPI
Download this chart Figure 9: Contributions to CPI inflation
Image .csv .xlsWhile much of the recent downwards pressure on inflation has come from energy, food and fuels, other components have also made a substantial contribution to this disinflationary trend. Figure 9 indicates that the ‘Other’ component – a grouping of 56 class level indices in the CPI – has weakened markedly over the last two years. Figure 10 decomposes the contribution of this group into its main components, showing the classes which have the largest impact on the CPI, either because of large price movements or because they carry a relatively large weight. Goods besides food, drink and energy – including clothing, footwear, cars and furniture & furnishings – account for a large fraction of this group. It shows that second hand cars and information processing equipment inflation have both put downwards pressure on the contribution of this group, while lower inflation in restaurants and cafes has also had an impact. Financial services price growth – which made a negative contribution to the CPI during the second half of 2014 – has picked up marginally in recent months.
Figure 10: Contributions to CPI of ‘Other’ products
Percentage points, UK

Source: Office for National Statistics
Download this image Figure 10: Contributions to CPI of ‘Other’ products
.png (33.2 kB)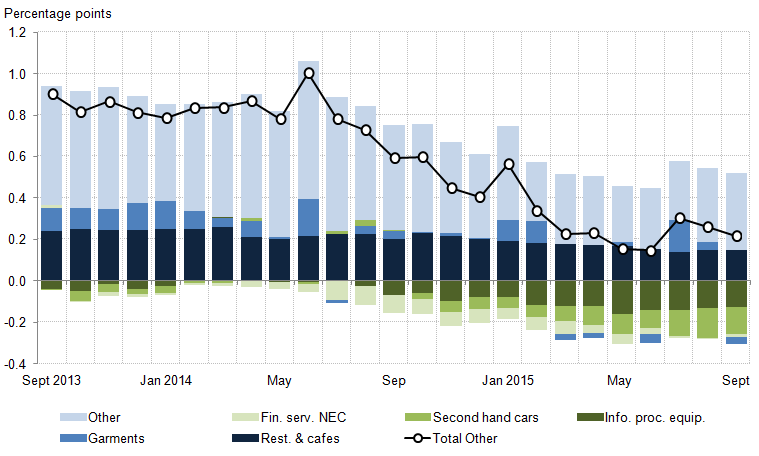
However, even after breaking down the ‘other’ component into its constituent parts, there remains a relatively large, downwards contribution from the remaining products of this group, which is indicative of a broad weakening of price pressure among a range of products. Taking Figure 10 as a whole, 15 of the 56 classes represented experienced falling prices in September 2014, compared with 23 in September 2015, and the group’s cumulative contribution to the CPI has fallen from 0.6 percentage points to 0.2 percentage points over this period. Some of these movements – and in particular recent changes in some goods prices – are partly explained by movements in the exchange rate, through its impact on import prices. Sterling has appreciated by 5% on a trade weighted basis during the first nine months of 2015 – reflecting a marked appreciation against the Euro, and a relatively strong depreciation against the US dollar (Figure 11). Others – and in particular prices for products which are not typically imported – are likely to reflect some degree of pass through of lower price pressures from other products.
Figure 11: Sterling exchange rates 2007=100
UK
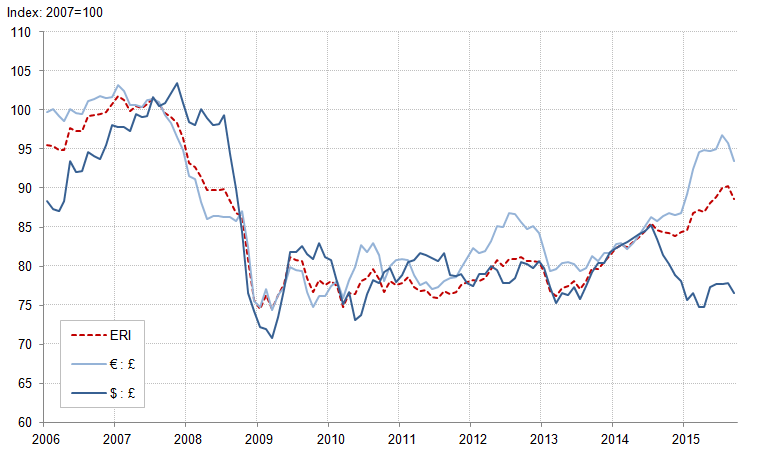
Source: Office for National Statistics
Notes:
- ERI is the trade-weighted Sterling effective Exchange Rate Index (ERI)
Download this image Figure 11: Sterling exchange rates 2007=100
.png (36.1 kB)
6. Foreign Direct Investment
Developments in the exchange rate also have a bearing on the performance of the UK’s current account, revised data for which were published in the annual balance of payments publication – the Pink Book 2015. As noted in previous editions of the Economic Review, current account developments over the last two years have been dominated by changes to the UK’s primary income balance – which records the UK’s earnings on overseas assets and the earnings overseas agents make on investments in the UK. While the stock of assets that the UK holds abroad appears to have fallen relative to overseas holdings in the UK in recent years, changes in the rate of return on those UK assets appear to have played the biggest role in explaining the deterioration of the primary income balance.
Figure 12 shows the rates of return generated on direct investments by UK and overseas investors since 1998. It indicates that from 2001 to 2007, and again from 2010 to early 2014, the UK received a higher rate of return on its direct investment assets than overseas investors gained from assets in the UK. This supported the UK’s current account position, partially offsetting a persistent deficit on trade in goods in particular. However, the rate of return on assets began to fall in 2011, leading the rates on assets and liabilities to converge. Since mid-2014 the rates of return on the UK’s assets and liabilities have been similar, resulting in a fall in the FDI income balance. While rates have converged in the past – during both the early 2000s and the recent economic downturn – understanding what factors have driven recent trends in rates of return is central to understanding why the UK currently runs a deficit on primary income.
Figure 12: Quarterly rates of return on direct investment, seasonally adjusted
Percent, UK
Source: Office for National Statistics
Notes:
- Rates of return are estimated by dividing current period credits/debits by the average asset/liability position in the current and previous period
Download this chart Figure 12: Quarterly rates of return on direct investment, seasonally adjusted
Image .csv .xlsONS recently published a detailed examination of some of the factors affecting FDI alongside the annual Pink Book publication. This presents information on the relative performances of FDI in different industries, undertaken by different firm sizes and in different markets, as well as giving some indication of the impact of the exchange rate on the FDI income balance. It also includes analysis of the distribution of rates of return on the UK’s FDI assets: while changes in the aggregate rate of return on FDI assets provides a measure of the average performance of the UK’s assets and liabilities, it can be driven by a relatively small number of projects with very high or low profits. For instance, the decline in the rate of return on UK assets might be driven by a general reduction in returns on UK FDI across all industries and regions, or it might arise because of a sharp slowing in some of the UK’s largest FDI assets. As the policy implications of these two possibilities are quite different, understanding the drivers of the change in the rates of return is important.
Figure 13 presents this more detailed picture by showing the distribution of rates of return across the UK’s stock of outward assets in each time period. Ranking the stock of UK assets overseas by rate of return, it shows the rate of return at selected percentile points of the distribution. The shaded regions show the distribution of rates of return, with the darker (lighter) areas denoting the centre (extremes - 10th to 90th percentiles) of the distribution. For instance, in 2006 the highest performing 10% or £88 billion of the UK’s £880 billion stock of outward assets had a rate of return in excess of 19%, while the lowest performing £88 billion of UK outward assets had a negative rate of return. The orange line shows the median rate of return on assets – the rate of return which divides the UK’s asset stock in half: 50% earn a return above this rate, 50% earn a return below this rate.
Figure 13: Distribution of rates of return on direct investment, non seasonally adjusted
Percent, UK

Source: Office for National Statistics, Foreign Direct Investment datasets
Notes:
- Annual data are used between 2006 and 2014. From 2014 onwards, quarterly data are used to derive annualised rates of return – which results in the corresponding increase in volatility. Note that these, later data are also likely to reflect a seasonal pattern in earnings from overseas assets. Percentiles are calculated from outward assets
Download this image Figure 13: Distribution of rates of return on direct investment, non seasonally adjusted
.png (34.8 kB)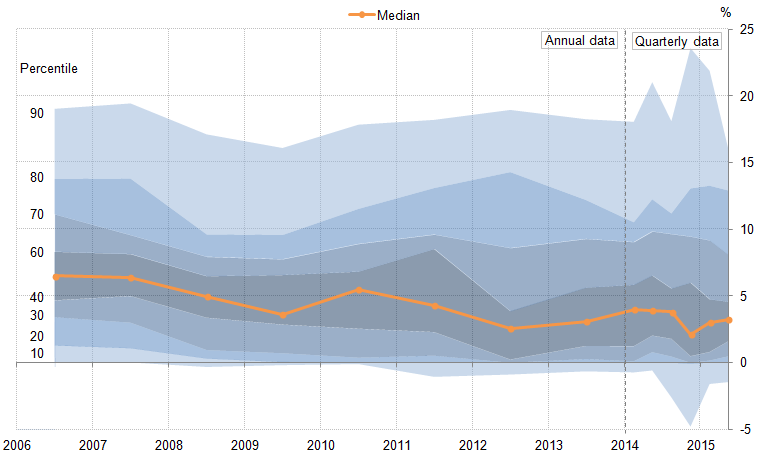
This analysis suggests that the recent fall in the average rate of return for the UK’s assets reflects a combination of downwards pressure on the performance of some of the UK’s mid-performing assets and a worsening of the performance of some of our least productive assets. The median rate of return on UK FDI assets overseas fell from 6.5% to 3.6% between 2006 and 2009, recovered some ground in 2010, before falling again in 2011 and 2012. By contrast, the rate of return on the highest performing 10% of the UK’s asset stock fell slightly during 2008 and 2009, but has otherwise been broadly stable over this period.
Using quarterly data from 2014 onwards, the median rate of return is estimated to have exceeded its 2013 value between Q1 2014 and Q3 2014, but fell in the final three months of the year. Figure 13 indicates that this was driven by a fall in the lower end of the distribution. The rate of return below which the lowest performing 10% of the UK’s asset stock fell, dropped from -0.6% in Q2 2014 to -4.8% in Q4 2014, while the top of the distribution was either unchanged or slightly stronger on average over this period. While these are not adjusted for their seasonal components and may consequently reflect the normal pattern of seasonal behaviour, ONS analysis of the composition of this group suggests that the fall in the oil price may have played a key role in this development. Over 40% of the value of assets which fell below the 10th percentile in Q4 2014 were in the extraction of crude petroleum & natural gas industry, suggesting that the UK’s relative exposure to the oil and gas industry may have played a role in the recent deterioration of the primary income balance.
A similar analysis can be produced for the UK’s liabilities (Figure 14), which suggests that in contrast to the UK’s asset position, rates of return earned by overseas agents in the UK are broadly unchanged for the lowest-performing 70% of UK liabilities over this period. Ranking the stock of the UK’s inwards liabilities by rate of return, it shows the rate of return at selected percentile points of the distribution. The points in between provide some sense of how rates of return vary for the remainder of the UK’s FDI stock: shifts rightward in this line indicate that more of the UK’s stock of liabilities is generating a lower rate of return, shifts to the left indicate the converse.
Figure 14: Distribution of rates of return for liabilities, selected periods
Percent, UK
Source: Office for National Statistics
Notes:
- Percentiles are calculated from inward liabilities
Download this chart Figure 14: Distribution of rates of return for liabilities, selected periods
Image .csv .xlsWhile the distribution below the 70th percentile remains fairly constant from 2008 onwards, there is more movement at the top of the distribution. The rate of return exceeded by the UK’s 10% highest performing liabilities fell following the economic downturn – from 23.0% in 2008, to 17.4% in 2009-11 and to 13.3% in 2012-14. Factors behind this fall, as well as others affecting FDI – such as industrial composition, firm sizes, and economic regions UK FDI is conducted with - are explored in more detail in An analysis of Foreign Direct Investment.
Back to table of contents7. Reference Tables
Table 2: UK Demand side indicators
| 2013 | 2014 | Q1 2015 | Q2 2015 | Q3 2015 | Jun 2014 | Jul 2015 | Aug 2015 | Sep 2015 | |
| GDP1 | 2.2 | 2.9 | 0.4 | 0.7 | 0.5 | : | : | : | : |
| Index of Services | |||||||||
| All Services1 | 2.8 | 3.2 | 0.4 | 0.6 | 0.7 | 0.6 | 0.2 | 0.0 | : |
| Business Services & Finance1 | 3.6 | 3.9 | 0.1 | 0.6 | 1.0 | 0.7 | 0.2 | 0.2 | : |
| Government & Other1 | 1.4 | 1.4 | 0.2 | 0.1 | 0.1 | 0.1 | 0.0 | -0.1 | : |
| Distribution, Hotels & Rest. 1 | 4.1 | 4.7 | 1.2 | 1.0 | 0.8 | 0.7 | 0.3 | -0.4 | : |
| Transport, Stor. & Comms. 1 | 2.2 | 3.0 | 0.8 | 1.4 | 1.3 | 1.2 | 0.2 | 0.2 | : |
| Index of Production | |||||||||
| All Production1 | -0.8 | 1.4 | 0.3 | 0.7 | 0.3 | -0.2 | -0.3 | 1.0 | : |
| Manufacturing1 | -1.1 | 2.7 | -0.1 | -0.5 | -0.3 | 0.2 | -0.7 | 0.5 | : |
| Mining & Quarrying1 | -3.3 | -0.5 | 0.5 | 7.5 | 2.4 | -3.0 | 0.7 | 6.0 | : |
| Construction1 | 1.6 | 8.1 | 0.2 | 1.4 | -2.2 | 2.4 | -1.0 | -4.3 | : |
| Retail Sales Index | |||||||||
| All Retailing1 | 1.4 | 3.9 | 0.8 | 0.8 | 0.9 | -0.2 | 0.5 | -0.4 | 1.9 |
| All Retailing, excl.Fuel1 | 1.9 | 4.3 | 0.4 | 1.0 | 0.9 | -0.3 | 0.8 | -0.7 | 1.7 |
| Predom. Food Stores1 | -0.1 | 0.8 | 0.3 | 0.4 | 0.0 | -0.4 | -0.1 | -1.2 | 2.3 |
| Predom. Non-Food Stores1 | 1.7 | 6.5 | 0.0 | 1.3 | 1.0 | -0.8 | 1.3 | -0.2 | 0.8 |
| Non-Store Retailing1 | 17.2 | 11.8 | 3.9 | 2.9 | 4.6 | 3.3 | 2.0 | -1.0 | 3.4 |
| Trade | |||||||||
| Balance2, 3 | -34.2 | -34.5 | -10.5 | -3.5 | : | -0.4 | -4.4 | -3.3 | : |
| Exports4 | 3.8 | -1.1 | -2.2 | 3.7 | : | 1.8 | -7.4 | 1.9 | : |
| Imports4 | 3.7 | -1.0 | -1.3 | -1.7 | : | 1.0 | 1.5 | -0.8 | : |
| Public Sector Finances | |||||||||
| PSNB-ex3,5 | -25.8 | -2.5 | -7.9 | -4.5 | -3.0 | -0.6 | -2.3 | 0.8 | -1.6 |
| PSND-ex as a % GDP | 78.1 | 80.9 | 80.0 | 80.7 | 80.6 | 80.7 | 80.1 | 79.9 | 80.6 |
| Source: Office for National Statistics | |||||||||
| Notes: | |||||||||
| 1. Percentage change on previous period, seasonally adjusted, CVM | |||||||||
| 2. Levels, seasonally adjusted, CP | |||||||||
| 3. Expressed in £ billion | |||||||||
| 4. Percentage change on previous period, seasonally adjusted, CP | |||||||||
| 5. Public Sector net borrowing, excluding public sector banks. Level change on previous period a year ago, not seasonally adjusted | |||||||||
Download this table Table 2: UK Demand side indicators
.xls (58.9 kB)
Table 3: UK Supply side indicators
| 2013 | 2014 | Q1 2015 | Q2 2015 | Q3 2015 | Jun 2014 | Jul 2015 | Aug 2015 | Sep 2015 | |||||
| Labour Market | |||||||||||||
| Employment Rate1, 2 | 71.5 | 72.9 | 73.5 | 73.4 | : | 73.5 | 73.6 | : | : | ||||
| Unemployment Rate1, 3 | 7.6 | 6.2 | 5.5 | 5.6 | : | 5.5 | 5.4 | : | : | ||||
| Inactivity Rate1, 4 | 22.4 | 22.2 | 22.1 | 22.1 | : | 22.1 | 22.1 | : | : | ||||
| Claimant Count Rate7 | 4.2 | 3.0 | 2.4 | 2.3 | 2.3 | 2.3 | 2.3 | 2.3 | 2.3 | ||||
| Total Weekly Earnings6 | £474 | £480 | £487 | £491 | : | £489 | £495 | £494 | : | ||||
| CPI | |||||||||||||
| All-item CPI5 | 2.6 | 1.5 | 0.1 | 0.0 | 0.0 | 0.0 | 0.1 | 0.0 | -0.1 | ||||
| Transport5 | 1.0 | 0.3 | -2.5 | -2.1 | -2.4 | -1.8 | -1.9 | -2.6 | -2.7 | ||||
| Recreation & Culture5 | 1.1 | 0.9 | -0.4 | -0.8 | -0.8 | -1.0 | -0.6 | -0.9 | -0.8 | ||||
| Utilities5 | 4.1 | 3.0 | 0.9 | 0.4 | 0.3 | 0.4 | 0.4 | 0.4 | 0.1 | ||||
| Food & Non-alcoh. Bev. 5 | 3.8 | -0.2 | -2.9 | -2.3 | -2.5 | -2.2 | -2.7 | -2.4 | -2.3 | ||||
| PPI | |||||||||||||
| Input8 | 1.2 | -6.6 | -13.5 | -12.2 | -13.5 | -13.0 | -12.8 | -14.6 | -13.3 | ||||
| Output8 | 1.3 | 0.0 | -1.7 | -1.7 | -1.8 | -1.6 | -1.6 | -1.9 | -1.8 | ||||
| HPI8 | 3.6 | 10.0 | 8.5 | 5.6 | : | 5.7 | 5.2 | 5.2 | : | ||||
| Source: Office for National Statistics | |||||||||||||
| Notes: | |||||||||||||
| 1. Monthly data shows a three month rolling average (e.g. The figure for February is for the three months Jan - Mar) | |||||||||||||
| 2. Headline employment figure is the number of people aged 16-64 in employment divided by the total population 16-64 | |||||||||||||
| 3. Headline unemployment figure is the number of unemployed people (aged 16+) divided by the economically active population (aged 16+) | |||||||||||||
| 4. Headline inactivity figure is the number of economically active people aged 16 to 64 divided by the 16-64 population | |||||||||||||
| 5. Percentage change on previous period a year ago, seasonally adjusted | |||||||||||||
| 6. Estimates of total pay include bonuses but exclude arrears of pay (£) | |||||||||||||
| 7. Calculated by JSA claimants divided by claimant count plus workforce jobs | |||||||||||||
| 8. Percentage change on previous period a year ago, non-seasonally adjusted | |||||||||||||