Table of contents
- Main points
- Overview
- Understanding crime statistics
- Summary
- Violent crime
- Robbery
- Sexual offences
- Offences involving knives and sharp instruments
- Offences involving firearms
- Theft offences
- Theft offences – burglary
- Theft offences – vehicle
- Theft offences – other theft of property
- Criminal damage
- Other crimes against society
- Fraud
- Crime experienced by children aged 10 to 15
- Anti-social behaviour
- Other non-notifiable crimes
- Commercial victimisation survey
- Data sources – coverage and coherence
- Accuracy of the statistics
- Users of crime statistics
- International and UK comparisons
- List of products
- References
- Background notes
- Methodology
1. Main points
- Latest figures from the Crime Survey for England and Wales (CSEW) showed that, for the offences it covers, there were an estimated 6.9 million incidents of crime against households and resident adults (aged 16 and over) in England and Wales. This is a 7% decrease compared with the previous year’s survey, and the lowest estimate since the CSEW began in 1981. The CSEW covers a broad range of victim based crimes and includes crimes which do not come to the attention of the police.
- While the estimate of all CSEW crime was lower than the previous year, the apparent falls seen in most individual crime types were not statistically significant compared with the previous year. The only major category to show a statistically significant fall was theft offences which decreased by 7%.
- In contrast to the CSEW, there was a 2% increase in police recorded crime compared with the previous year, with 3.8 million offences recorded in the year ending December 2014. The renewed focus on the quality of crime recording is thought to have led to improved compliance with national recording standards, leading to proportionally more crimes reported to the police being recorded by them.
- Improved compliance with recording standards is thought to have particularly affected the police recorded crime categories of violence against the person (up 21%) and public order offences (up 14%). These rises were largely off-set by falls in the number of recorded theft offences (down 5%).
- Total sexual offences rose by 32% with the numbers of rapes (26,703) and other sexual offences (53,559) being at the highest level ever recorded since the introduction of the National Crime Recording Standard (NCRS) in 2002/03. As well as improvements in recording, this is also thought to reflect a greater willingness of victims to come forward to report such crimes.
- There was an increase in the volume of offences recorded by Action Fraud (9% year-on-year), although it is still difficult to judge to what extent this was affected by the transfer in responsibility of recording fraud offences from individual police forces to Action Fraud.
2. Overview
This release provides the latest statistics on crime from two principal sources: the Crime Survey for England and Wales and police recorded crime.
In accordance with the Statistics and Registration Service Act 2007, statistics based on police recorded crime data have been assessed against the Code of Practice for Official Statistics and found not to meet the required standard for designation as National Statistics. The full assessment report can be found on the UK Statistics Authority website. Alongside this release, the Office for National Statistics (ONS) have published a progress update on actions taken in addressing the requirements set out by the Authority. Data from the Crime Survey for England and Wales (CSEW) continue to be badged as National Statistics.
Further information on the datasets is available in the ‘Data sources – coverage and coherence’ section and the CSEW technical report (839.6 Kb Pdf) .
The user guide to crime statistics for England and Wales provides information for those wanting to obtain more detail on crime statistics. This includes information on the datasets used to compile the statistics and is a useful reference guide with explanatory notes regarding updates, issues and classifications.
The quality and methodology report sets out detailed information about the quality of crime statistics and the roles and responsibilities of the different departments involved in the production and publication of crime statistics.
An interactive guide provides a general overview of crime statistics.
A short video provides an introduction to crime statistics, including an overview of the main data sources used to produce the statistics.
Back to table of contents3. Understanding crime statistics
This quarterly release presents the most recent crime statistics from 2 main sources: the Crime Survey for England and Wales (CSEW; previously known as the British Crime Survey), and police recorded crime. Neither of these sources can provide a picture of total crime.
Crime Survey for England and Wales
The CSEW is a face-to-face victimisation survey in which people resident in households in England and Wales are asked about their experiences of a selected number of offences in the 12 months prior to the interview. It covers adults aged 16 and over, and a separate survey is used to cover children aged 10 to15, but neither cover those living in group residences (such as care homes, student halls of residence and prisons), or crimes against commercial or public sector bodies. For the population and offence types it covers, the CSEW is a valuable source for providing robust estimates on a consistent basis over time.
It is able to capture all offences experienced by those interviewed, not just those that have been reported to, and recorded by, the police. It covers a broad range of victim-based crimes experienced by the resident household population. However, there are some serious but relatively low volume offences, such as homicide and sexual offences, which are not included in its main estimates. The survey also currently excludes fraud and cyber crime though there is ongoing development work to address this gap – Work to extend the Crime Survey for England and Wales to include fraud and cyber crime has more information. An infographic published in October 2014 sets out what is and is not covered by the CSEW.
Police recorded crime
Police recorded crime figures cover selected offences that have been reported to and recorded by the police. They are supplied by the 43 territorial police forces of England and Wales, plus the British Transport Police, via the Home Office, to the Office for National Statistics (ONS). The coverage of police recorded crime is defined by the Notifiable Offence List (NOL)1, which includes a broad range of offences, from murder to minor criminal damage, theft and public order offences. The NOL excludes less serious offences that are dealt with exclusively at magistrates’ courts.
Police recorded crime is the primary source of sub-national crime statistics and relatively serious, but low volume, crimes that are not well measured by a sample survey. It covers victims (for example, residents of institutions and tourists) and sectors (for example, commercial bodies) excluded from the CSEW sample. While the police recorded crime series covers a wider population and a broader set of offences than the CSEW, crimes that don’t come to the attention of the police or are not recorded by them, are not included.
Statistics based on police recorded crime data don’t currently meet the required standard for designation as National Statistics (this is explained in the ‘Recent assessments of crime statistics and accuracy’ section).
We also draw on data from other sources to provide a more comprehensive picture of crime and disorder, including incidents of anti-social behaviour recorded by the police and other transgressions of the law that are dealt with by the courts, but not covered in the recorded crime collection.
Recent assessments of crime statistics and accuracy
Following an assessment of ONS crime statistics by the UK Statistics Authority, published in January 2014, the statistics based on police recorded crime data have been found not to meet the required standard for designation as National Statistics. Data from the CSEW continue to be designated as National Statistics.
In their report, the UK Statistics Authority set out 16 requirements to be addressed in order for the statistics to meet National Statistics standards. We are working in collaboration with the Home Office Statistics Unit and Her Majesty’s Inspectorate of Constabulary (HMIC) to address these requirements. A summary of progress so far is available on the crime statistics methodology page.
In light of concerns raised about the quality of police recorded crime data, in November 2014 we launched a user engagement exercise to help expand our knowledge of users’ needs. The exercise has now closed and a summary of responses will be published in May 2015. A short summary of the main themes raised respondents is given in the ‘Users of Crime Statistics’ section.
As part of the inquiry by the Public Administration Select Committee (PASC) into crime statistics, allegations of under-recording of crime by the police were made. During 2014, Her Majesty’s Inspectorate of Constabulary (HMIC) carried out a national inspection of crime data integrity. The final report Crime-recording: making the victim count, was published on 18 November 2014.
Based on an audit of a large sample of records, HMIC concluded that, across England and Wales as a whole, an estimated 1 in 5 offences (19%) that should have been recorded as crimes were not. The greatest levels of under-recording were seen for violence against the person offences (33%) and sexual offences (26%), however there was considerable variation in the level of under-recording across the different offence types investigated (for example, burglary; 11%) and these are reported on further in the relevant sections.
The audit sample was not large enough to produce compliance rates for individual police forces. However, the HMIC inspected the crime recording process in each force and have reported on their findings in separate crime data integrity force reports.
Further information on the accuracy of the statistics is also available in the ‘Accuracy of the statistics’ section.
Time periods covered
The latest CSEW figures presented in this release are based on interviews conducted between January 2014 and December 2014, measuring experiences of crime in the 12 months before the interview. Therefore, it covers a rolling reference period with, for example, respondents interviewed in January 2014 reporting on crimes experienced between January 2013 and December 2013, and those interviewed in December 2014 reporting on crimes taking place between December 2013 and November 2014. For that reason, the CSEW tends to lag short-term trends.
Recorded crime figures relate to crimes recorded by the police during the year ending December 20142 and, therefore, are not subject to the time lag experienced by the CSEW. Recorded crime figures presented in this release are those notified to the Home Office and that were recorded in the Home Office database on 17 March 2015.
There is a 9 month overlap of the data reported here with the data contained in the previous bulletin; as a result the estimates in successive bulletins are not from independent samples. Therefore, year-on-year comparisons are made with the previous year; that is, the 12 month period ending December 2013 (rather than those published last quarter). To put the latest dataset in context, data are also shown for the year ending March 2009 (around five years ago) and the year ending March 2004 (around ten years ago). Additionally, for the CSEW estimates, data for the year ending December 1995, which was when crime peaked in the CSEW (when the survey was conducted on a calendar year basis), are also included.
Users should be aware that police recorded crime figures have been affected by the recent HMIC audit which took place over the period December 2013 to August 2014, this falls within the time period covered by this release. The current year covers the period January 2014 to December 2014 and the comparator year covers the period January 2013 to December 2013.
Changes following survey re-weighting
Revised survey weights and a back-series have been produced for the CSEW following the release of the new-2011 Census-based population estimates. The programme of work to produce the revised weights and key estimates for all survey years back to 2001/02 is now complete and both CSEW and police recorded crime use post 2011 Census population figures. Micro datasets for the entire affected back-series are planned for release during 2015. Presentational and methodological improvements to National Statistics on the Crime Survey for England and Wales has more information.
Notes for understanding crime statistics
- The Notifiable Offence List includes all indictable and triable-either-way-offences (offences which could be tried at a crown court) and a few additional closely related summary offences (which would be dealt with by magistrates’ courts). Appendix 1 of the User Guide (1.61 Mb Pdf) has more information on the classifications used for notifiable crimes recorded by the police.
- Police recorded crime statistics are based on the year in which the offence was recorded, rather than the year in which it was committed. However, such data for any given period will include some historic offences that occurred in a previous year to the one in which it is reported to the police.
4. Summary
Latest headline figures from the CSEW and police recorded crime
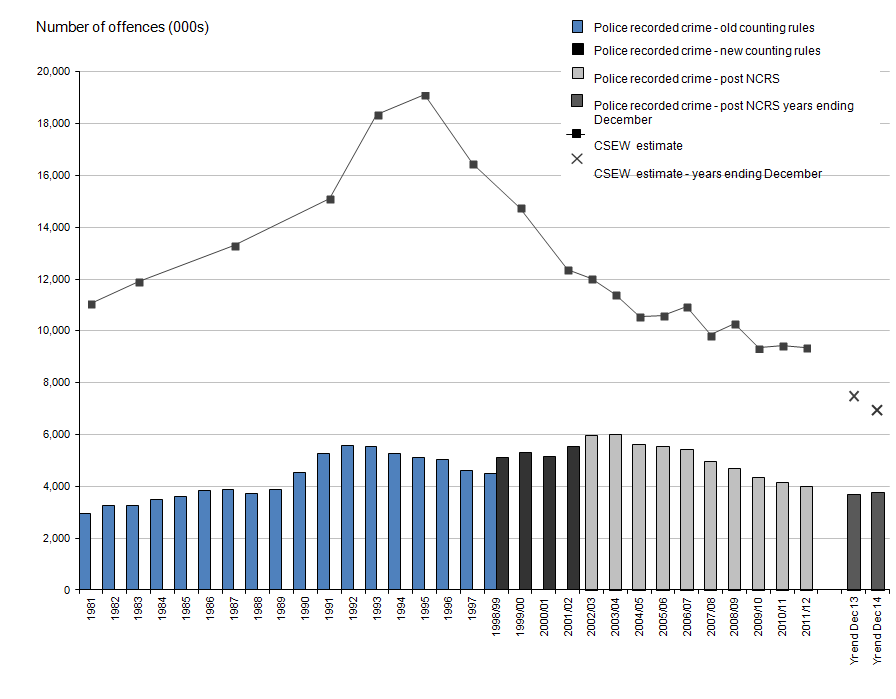
Latest figures from the CSEW show there were an estimated 6.9 million incidents of crime against households and resident adults (aged 16 and over) in England and Wales for the year ending December 2014 (Table 1). This is a 7% decrease from 7.5 million incidents estimated in the previous year’s survey and continues the long term downward trend seen since the mid-1990s. The latest estimate is the lowest since the survey began in 1981. The total number of CSEW incidents is 32% lower than the 2008/09 survey estimate and 64% lower than its peak level in 1995.
Crime covered by the CSEW increased steadily from 1981, before peaking in 1995. After peaking, the CSEW showed marked falls up until the 2004/05 survey year. Since then, the underlying trend has continued downwards, but with some fluctuation from year to year (Figure 1).
An interactive version of Figure 1 is also available.
The Crime Survey for England and Wales (CSEW) covers a broad range of victim-based crimes experienced by the resident household population although there are some serious but relatively low volume offences, such as homicide and sexual offences, which are not included in its headline estimates. The survey also currently excludes fraud and cyber crime though there is ongoing development work to address this gap (the methodological note Work to extend the Crime Survey for England and Wales to include fraud and cyber crime contains more information). This infographic provides more information on what is and is not included in the CSEW.
Figure 1: Trends in police recorded crime and Crime Survey for England and Wales, 1981 to year ending December 2014
Source: Crime Survey for England and Wales, Office for National Statistics / Police recorded crime, Home Office
Notes:
- Police recorded crime data are not designated as National Statistics.
- The data on this chart refer to different time periods: a) 1981 to 1999 refer to crimes experienced in the calendar year (January to December) b) from 2001/02 onwards the estimates relate to crimes experienced in the 12 months before interview, based on interviews carried out in that financial year (April to March) c) the last two data points relate to interviews carried out in the rolling 12 month periods for the latest available 2 years (January to December).
- CSEW data relate to households/adults aged 16 and over.
- Some forces have revised their data and police recorded crime totals may not agree with those previously published.
Download this image Figure 1: Trends in police recorded crime and Crime Survey for England and Wales, 1981 to year ending December 2014
.png (33.1 kB) .xls (82.9 kB)
The CSEW time series shown in Figure 1 doesn’t includes crimes committed against children aged 10 to 15. The survey was extended to include such children from January 2009: data from this module of the survey are not directly comparable with the main survey. The CSEW estimated that 767,0001 crimes were experienced by children aged 10 to 15 in the year ending December 2014. Of this number, 51% were categorised as violent crimes2 (394,000), while most of the remaining crimes were thefts of personal property (312,000; 41%). Incidents of criminal damage to personal property experienced by children were less common (62,000; 8% of all crimes). The proportions of violent, personal property theft and criminal damage crimes experienced by children aged 10 to 15 are similar to the previous year (57%, 36% and 7% respectively).
Police recorded crime is restricted to offences that have been reported to and recorded by the police, and so doesn’t provide a total count of all crimes that take place. The police recorded 3.8 million offences in the year ending December 2014, an increase of 2% compared with the previous year (Table 2)3. This is the first increase in police recorded crime since 2003/04 but needs to be seen in the context of the renewed focus on the quality of crime recording. Although the latest figures show a small increase, the level of police recorded crime is still 20% lower than in 2008/09 and 37% lower than the peak in 2003/04.
Like CSEW crime, police recorded crime also increased during most of the 1980s, reaching a peak in 1992, and then fell each year until 1998/99. Expanded coverage of offences in the police recorded crime collection, following changes to the Home Office Counting Rules (HOCR) in 1998, and the introduction of the National Crime Recording Standard (NCRS) in April 2002, saw increases in the number of crimes recorded by the police while the CSEW count fell. Following these changes, trends from the 2 series tracked each other well from 2002/03 until 2006/07. While both series continued to show a downward trend between 2007/08 and 2012/13, the gap between the 2 series widened with police recorded crime showing a faster rate of reduction (32% compared with 19% for the CSEW, for a comparable basket of crimes)4.
However, more recently this pattern has changed and police recorded crime has stopped its downward trend for the last 3 quarterly bulletins, while the CSEW estimates have continued to fall. A likely factor behind the changing trend in police recorded crime is the recent renewed focus on the quality of recording by the police, this is light of the inspections of forces by Her Majesty’s Inspectorate of Constabulary (HMIC), the Public Administration Select Committee (PASC) inquiry into crime statistics, and the UK Statistics Authority’s decision to remove the National Statistics designation. This renewed focus is thought to have led to improved compliance with the NCRS, leading to a greater proportion of crimes reported to the police being recorded.
Police recorded crime is made up of 2 broad groupings, victim based crime and other crimes against society, there was a 1% increase in both these categories in the year ending December 2014 compared with the previous year.
Victim-based crime 5 accounted for 83% of all police recorded crime, with 3.1 million offences recorded. Whilst there were decreases across many of the police recorded crime categories these were offset by large increases in violence against the person offences, which was up by 21% (an additional 126,392 offences), sexual offences up by 32% (19,425 offences) and shoplifting up by 3% (8,457 offences), which has resulted in an increase of 1% in victim based crime.
Other crimes against society 6 accounted for 11% of all police recorded crime, with 401,293 offences recorded in the year ending December 2014 (an increase of 1% compared with the previous year). Trends in such offences often reflect changes in police activity and workload, rather than levels of criminality. However, anecdotal evidence from forces suggests that some increases, such as public order, in this grouping are being driven by a tightening of recording practices. Public order offences accounted for the largest volume rise and increased by 14%, miscellaneous crimes against society increased by 14%, offences involving possession of weapons by 4%, but drug offences decreased by 11%.
The remaining 6% of recorded crimes were fraud offences. There were 224,947 fraud offences recorded by Action Fraud 7 in the year ending December 2014 (an increase of 9% on the previous year). However, trends in fraud should be interpreted with caution. It is unclear to what extent there has been a genuine increase in such crimes, or whether the move to the centralised recording of such offences has led to improved reporting and recording of fraud offences; the ‘Total fraud offences recorded by Action Fraud’ section has further details.
In addition, fraud data are also collected from industry bodies by the National Fraud Intelligence Bureau (NFIB). In the year ending December 2014, there were 411,590 reports of fraud to the NFIB from industry bodies, the vast majority of which were related to banking and credit industry fraud. The ‘Fraud’ section has more information on these data sources.
Overall level of crime – other sources of crime statistics
Around 2.0 million incidents of anti-social behaviour (ASB) were recorded by the police for the year ending December 2014. These are incidents that were not judged to require recording as a notifiable offence within the Home Office Counting Rules for recorded crime. The number of ASB incidents in the year ending December 2014 decreased by 9% compared with the previous year. However, it should be noted that a review by HMIC in 2012 found that there was a wide variation in the quality of decision making associated with the recording of ASB. As a result, ASB incident data should be interpreted with caution.
In the year ending September 2014 (the latest period for which data are available) there were over 950,000 convictions for non-notifiable offences (down 4% from the year ending September 2013), that are not covered in police recorded crime or the CSEW (for example: being drunk and disorderly; committing a speeding offence). There were 30,000 Penalty Notices for Disorder issued in relation to non-notifiable offences8.
The CSEW does not cover crimes against businesses and police recorded crime can only provide a partial picture (as not all offences come to the attention of the police). The 2013 and 2014 Commercial Victimisation Surveys, respectively, estimated that there were 6.6 million and 4.8 million incidents of crime against business premises 9 in England and Wales in the three comparable sectors covered by each survey (‘Wholesale and retail’, ‘Accommodation and food’ and ‘Agriculture, forestry and fishing’); a decrease of 1.8 million incidents.
Trends in victim-based crime – CSEW
The CSEW provides coverage of most victim-based crimes, although there are necessary exclusions from its main estimates, such as homicide and sexual offences. This infographic has more information on the coverage of the survey.
Estimates of violent crime from the CSEW have shown large falls between the 1995 and the 2004/05 survey. While the downward trend continues, the 3% fall in the latest year was not statistically significantly lower than the previous year’s estimate.
CSEW domestic burglary follows a similar pattern to that seen for overall crime, peaking in the 1993 survey and then falling steeply until the 2004/05 CSEW. The underlying trend in domestic burglary remained fairly flat between the 2004/05 and 2010/11 surveys. Since then estimates have fallen and incidents of domestic burglary for the year ending December 2014 are 39% lower than those in the 2003/04 survey. However, the apparent year-on-year fall of 2% in the latest survey estimate was not statistically significant.
While the CSEW category of vehicle-related theft showed an apparent decrease of 6% compared with the previous year, this was not statistically significant. There has been a consistent downward trend since the mid-1990s. The latest estimates indicate that a vehicle-owning household was around 5-times less likely to become a victim of such crime than in 1995.
The apparent 3% decrease in CSEW other household theft compared with the previous year was not statistically significant. The lastest estimates show levels of other household theft similar to those seen in the 2007/08 survey, following a period of year-on-year increases between the 2007/08 and 2011/12 surveys. Peak levels of other household theft were recorded in the mid-1990s and the latest estimate is half the level seen in 1995.
The CSEW estimates that there were around 768,000 incidents of other theft of personal property in the survey year ending December 2014. The underlying trend was fairly flat between 2004/05 and 2011/12 following marked declines from the mid-1990s; since 2011/12 estimates have decreased with the latest estimate 17% lower compared with the previous year.
Latest CSEW findings for bicycle theft show little change in the level of incidents in the year ending December 2014 compared with the previous year (the apparent 6% increase was not statistically significant). Over the long term, incidents of bicycle theft are now 40% lower than in 1995.
The number of incidents of criminal damage estimated by the CSEW showed little change in the year ending December 2014 compared with the previous year (the apparent 8% decrease was not statistically significant). The longer term trend shows that there has been a general decline in criminal damage estimates since 2008/09.
CSEW estimates for robbery and theft from the person were not significantly different from the previous year (the apparent respective 31% and 15% decreases were not statistically significant). However, these must be treated with caution and interpreted alongside police recorded crime as short term trends in these crimes are likely to fluctuate when measured by the CSEW due to the small number of victims interviewed in any one year. Further information on these crimes is provided in the relevant sections of this bulletin.
Table 1: Number of CSEW incidents for year ending December 2014 and percentage change [1]
| England and Wales | |||||||||
| Adults aged 16 and over/households | |||||||||
| Offence group3 | Jan-14 to Dec-144 | January 2014 to December 2014 compared with: | |||||||
| Jan-95 to Dec-95 | Apr-03 to Mar-04 | Apr-08 to Mar-09 | Jan-13 to Dec-13 | ||||||
| Number of incidents (thousands), percentage change and significance5 | |||||||||
| Violence | 1,316 | -66 | * | -41 | * | -26 | * | -3 | |
| with injury | 621 | -73 | * | -48 | * | -35 | * | -14 | |
| without injury | 695 | -56 | * | -31 | * | -15 | 10 | ||
| Robbery | 106 | -69 | * | -61 | * | -60 | * | -31 | |
| Theft offences | 4,123 | -65 | * | -37 | * | -26 | * | -7 | * |
| Theft from the person | 478 | -30 | * | -21 | * | -32 | * | -15 | |
| Other theft of personal property | 768 | -63 | * | -40 | * | -28 | * | -17 | * |
| Unweighted base - number of adults | 32,666 | ||||||||
| Domestic burglary | 796 | -67 | * | -39 | * | -20 | * | -2 | |
| Domestic burglary in a dwelling | 564 | -68 | * | -40 | * | -21 | * | -7 | |
| Domestic burglary in a non-connected building to a dwelling | 232 | -64 | * | -38 | * | -15 | * | 13 | |
| Other household theft | 780 | -50 | * | -13 | * | -10 | * | -3 | |
| Vehicle-related theft | 906 | -79 | * | -56 | * | -37 | * | -6 | |
| Bicycle theft | 395 | -40 | * | 9 | -23 | * | 6 | ||
| Criminal damage | 1,404 | -57 | * | -42 | * | -47 | * | -8 | |
| Unweighted base - number of households | 32,624 | ||||||||
| All CSEW crime | 6,949 | -64 | * | -39 | * | -32 | * | -7 | * |
| Source: Crime Survey for England and Wales, Office for National Statistics | |||||||||
| Notes: | |||||||||
| 1. More detail on further years can be found in Appendix Table A1. | |||||||||
| 2. Section 5 of the User Guide provides more information about the crime types included in this table. | |||||||||
| 3. Base sizes for data since year ending December 2014 are smaller than previous years, due to sample size reductions introduced in April 2012. | |||||||||
| 4. Statistically significant change at the 5% level is indicated by an asterisk. | |||||||||
Download this table Table 1: Number of CSEW incidents for year ending December 2014 and percentage change [1]
.xls (80.4 kB)Trends in victim-based crime – police recorded crime
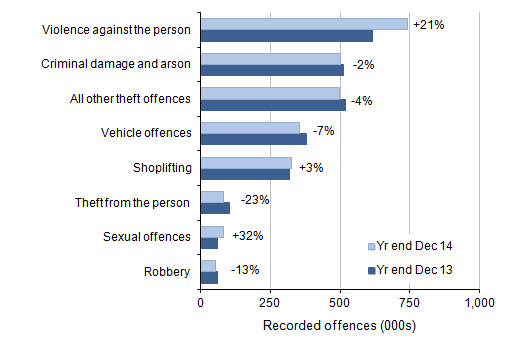
Figure 2 focuses on selected police recorded crime offences with notable changes in the year ending December 2014 compared with the previous year.
Figure 2: Selected victim-based police recorded crime offences in England and Wales: volumes and percentage change between year ending December 2013 and year ending December 2014
Source: Police recorded crime, Home Office
Notes:
- Police recorded crime data are not designated as National Statistics.
- ‘All other theft’ includes: theft of unattended items, blackmail, theft by an employee, and making off without payment.
Download this image Figure 2: Selected victim-based police recorded crime offences in England and Wales: volumes and percentage change between year ending December 2013 and year ending December 2014
.png (13.5 kB) .xls (77.3 kB)
There was a 1% increase in victim-based crimes in the year ending December 2014 to 3.1 million offences. This is equivalent to 55 recorded offences per 1,000 population (though this shouldn’t be read as a victimisation rate as multiple offences could be reported by the same victim) – shown in Table 3. There were decreases in:
theft from the person (down 23%)
vehicle offences (down 7%)
all other theft offences10 (down 4%)
criminal damage and arson (down 2%)
robbery (down 13%)
There were increases in:
violence against the person (up 21%)
sexual offences (up 32%)
shoplifting (up 3%)
The 21% increase in violence against the person offences recorded by the police is likely to be driven by improved compliance with the NCRS as the CSEW showed no change in estimated levels of violence over the same period (the apparent 3% decrease was not statistically significant). The volume of recorded violence against the person crimes (740,802 offences) equates to approximately 13 offences recorded per 1,000 population in the year ending December 2014. The largest increase in total violence against the person offences was in the violence without injury subcategory, which showed an increase of 26% compared with the previous year. The violence with injury subcategory showed a smaller increase (15%) over the same period.
In the year ending December 2014 the police recorded 515 homicides, 37 fewer than in the previous year11. This latest annual count of homicides is at its lowest since 1977 (484 offences). The number of homicides increased from around 300 per year in the early 1960s to over 800 per year in the early years of this century, which was at a faster rate than population growth over that period12. However, over the past decade the volume of homicides has decreased while the population of England and Wales has continued to grow.
Offences involving firearms (excluding air weapons) have fallen 1% in the year ending December 2014 compared with the previous year. This is a smaller decrease than seen in previous years, however, it continues the downward trend seen since the peak in 2005/06. The number of offences that involved a knife or sharp instrument showed little change over the same period13.
Robberies fell 13% in the year ending December 2014 compared with the previous year, from 59,426 offences to 51,585 offences. This is equivalent to around 1 offence recorded per 1,000 population and is the lowest level since the introduction of the NCRS in 2002/03 (when 110,271 offences were recorded). With the exception of a notable rise in the number of robberies in 2005/06 and 2006/07, there has been a general downward trend in robbery offences since 2002/03. The overall decrease has been driven by a fall in the number of offences recorded by the Metropolitan Police Force (which decreased by 25%; 7,438 fewer offences), where robbery offences tend to be concentrated (nearly half of all such offences were recorded in London).
Sexual offences recorded by the police increased by 32% compared with the previous year, to a total of 80,262 across England and Wales in the year ending December 2014. This is the highest level since the introduction of the NCRS in 2002/03. Within this, the number of offences of rape increased by 40% and the number of other sexual offences increased by 28%. The latest rises in total sexual offences, rape and other sexual offences are the largest year-on-year increases since the introduction of the NCRS in 2002/03. These increases are likely to be due to an improvement in crime recording by the police and an increase in the willingness of victims to come forward and report these crimes to the police. Estimates from the 2013/14 CSEW show a fall in sexual assault victimisation rates compared with the previous year14; the ‘Sexual offences’ section has more information.
While previous releases reported that the rise in sexual offences was being largely driven by a rise in the number of historical offences, additional analysis of data supplied by around half of police forces show recent offences accounted for the majority of the increase (79% of the increase was due to offences committed within the last 12 months15).
Total theft offences recorded by the police in the year ending December 2014 showed a 5% decrease compared with the previous year, continuing the year-on-year decrease seen since 2002/03. The majority of the categories in this offence group (burglary, vehicle offences, theft from the person, bicycle theft and ‘all other theft offences’) showed decreases compared with the previous year. The only exception to this was shoplifting, which increased by 3% compared with the previous year (from 317,047 offences to 325,504), the highest level since the introduction of the NCRS in 2002/03. Vehicle interference has increased by 56% (from 20,872 to 32,472) in the year ending December 2014 compared with the previous year. There was a change in the guidance within the HOCR with respect to interpreting the motive of the offender in theft of, or from, a vehicle or criminal damage to a vehicle which has led to offences now being recorded as vehicle interference where the motive of the offender was not clear.
Theft from the person offences recorded by the police in the year ending December 2014 showed a 23% decrease compared with the previous year. This is a reversal of recent trends, which showed year-on-year increases between 2008/09 and 2012/13. This latest decrease is driven by a large drop in offences from December 2013 onwards, thought to be associated with improved mobile phone security features. The ‘Theft offences - Other theft of property’ section has more information.
Fraud offences
Responsibility for recording fraud offences has transferred from individual police forces to Action Fraud. This transfer occurred between April 2011 and March 2013. In the year ending December 2014 there were 224,944 fraud offences recorded by Action Fraud in England and Wales16. This represents a volume increase of 11% compared with the previous year and an increase of 211% compared with 2008/09. These reported increases should be seen in the context of the recent move to centralised recording of fraud. During the transition to Action Fraud, the level of recorded fraud showed steady increases. It should be noted that since all forces completed the transfer of recording to Action Fraud (April 2013), levels of fraud remained fairly steady in the first 4 quarters. Data from the latest 2 quarters have shown increases, however it is too early to say whether this is the beginning of an emerging upward trend ( Table QT1 (202 Kb Excel sheet) ).
In addition, there were 411,590 reports of fraud to the National Fraud Intelligence Bureau from industry bodies. The ‘Fraud’ section has further information.
CSEW data on plastic card fraud show that, for the year ending December 2014 survey, 4.8% of plastic card owners were victims of card fraud in the last year, little change from 4.9% in the year ending December 2013. Before that, there had been small reductions in levels of plastic card fraud over the last few years, following a rise between the 2005/06 and 2008/09 surveys.
Table 2: Number of police recorded crimes for year ending December 2014 and percentage change [1,2,3]
| England and Wales | ||||||
| Number and percentage change | ||||||
| Offence group | Jan-14 to Dec-14 | January 2014 to December 2014 compared with: | ||||
| Apr-03 to Mar-04 | Apr-08 to Mar-09 | Jan-13 to Dec-13 | ||||
| Victim-based crime | 3,142,935 | -42 | -23 | 1 | ||
| Violence against the person offences | 740,802 | -7 | 4 | 21 | ||
| Homicide | 515 | -43 | -22 | -7 | ||
| Violence with injury4 | 362,852 | -21 | -14 | 15 | ||
| Violence without injury5 | 377,435 | 11 | 31 | 26 | ||
| Sexual offences | 80,262 | 33 | 60 | 32 | ||
| Rape | 26,703 | 101 | 104 | 40 | ||
| Other sexual offences | 53,559 | 14 | 44 | 28 | ||
| Robbery offences | 51,585 | -50 | -36 | -13 | ||
| Robbery of business property | 5,778 | -43 | -38 | -0 | ||
| Robbery of personal property | 45,807 | -51 | -35 | -15 | ||
| Theft offences | 1,770,401 | -46 | -24 | -5 | ||
| Burglary | 419,350 | -49 | -28 | -6 | ||
| Domestic burglary | 200,785 | -50 | -29 | -8 | ||
| Non-domestic burglary | 218,565 | -48 | -26 | -5 | ||
| Vehicle offences | 353,308 | -64 | -40 | -7 | ||
| Theft of a motor vehicle | 74,985 | -74 | -49 | -1 | ||
| Theft from a vehicle | 245,851 | -59 | -38 | -13 | ||
| Interfering with a motor vehicle | 32,472 | -64 | -32 | 56 | ||
| Theft from the person | 80,728 | -41 | -10 | -23 | ||
| Bicycle theft | 94,251 | -11 | -10 | -2 | ||
| Shoplifting | 325,504 | 7 | 1 | 3 | ||
| All other theft offences6 | 497,260 | -45 | -22 | -4 | ||
| Criminal damage and arson | 499,885 | -59 | -46 | -2 | ||
| Other crimes against society | 401,293 | -5 | -26 | 1 | ||
| Drug offences | 178,719 | 25 | -27 | -11 | ||
| Trafficking of drugs | 28,021 | 14 | -6 | -5 | ||
| Possession of drugs | 150,698 | 27 | -29 | -12 | ||
| Possession of weapons offences | 21,371 | -45 | -40 | 4 | ||
| Public order offences | 151,083 | -4 | -26 | 14 | ||
| Miscellaneous crimes against society | 50,120 | -37 | -10 | 14 | ||
| Total fraud offences7 | 224,947 | 32 | 211 | 9 | ||
| Total recorded crime - All offences including fraud7 | 3,769,175 | -37 | -20 | 2 | ||
| Source: Police recorded crime, Home Office | ||||||
| Notes: | ||||||
| 1. Police recorded crime data are not designated as National Statistics. | ||||||
| 2. Police recorded crime statistics based on data from all 44 forces in England and Wales (including the British Transport Police). | ||||||
| 3. More detail on further years can be found in Appendix Table A4. | ||||||
| 4. Includes attempted murder, intentional destruction of viable unborn child, causing death by dangerous driving/careless driving when under the influence of drink or drugs, more serious wounding or other act endangering life (including grievous bodily harm with and without intent), causing death by aggravated vehicle taking and less serious wounding offences. | ||||||
| 5. Includes threat or conspiracy to murder, harassment, other offences against children and assault without injury (formerly common assault where there is no injury). | ||||||
| 6. All other theft offences now includes all 'making off without payment' offences recorded since 2002/03. Making off without payment was previously included within the fraud offence group, but following a change in the classification for 2013/14, this change has been applied to previous years of data to give a consistent time series. | ||||||
| 7. Action Fraud have taken over the recording of fraud offences on behalf of individual police forces. The process began in April 2011 and was rolled out to all police forces by March 2013. Due to this change, caution should be applied when comparing data over this transitional period and with earlier years. New offences were introduced under the Fraud Act 2006, which came into force on 15 January 2007. | ||||||
Download this table Table 2: Number of police recorded crimes for year ending December 2014 and percentage change [1,2,3]
.xls (82.4 kB)
Table 3: Total police recorded crime - rate of offences [1,2,3]
| England and Wales | ||||
| Apr-03 to Mar-04 | Apr-08 to Mar-09 | Jan-13 to Dec-13 | Jan-14 to Dec-14 | |
| Rate per 1,000 population | ||||
| Total recorded crime - all offences including fraud | 114 | 86 | 66 | 66 |
| Victim-based crime4 | 103 | 75 | 55 | 55 |
| Other crimes against society | 8 | 10 | 7 | 7 |
| Total fraud offences | 3 | 1 | 4 | 4 |
| Source: Police recorded crime, Home Office | ||||
| Notes: | ||||
| 1. Police recorded crime data are not designated as National Statistics. | ||||
| 2. Police recorded crime statistics based on data from all 44 forces in England and Wales (including the British Transport Police). | ||||
| 3. Appendix table A4 provides detailed footnotes and data for further years. | ||||
| 4. Victim-based crime now includes all 'making off without payment' offences recorded since 2002/03. Making off without payment was previously included within the fraud offence group, but following a change in the classification for 2013/14, this change has been applied to previous years of data to give a consistent time series. | ||||
Download this table Table 3: Total police recorded crime - rate of offences [1,2,3]
.xls (82.4 kB)Notes for summary
The survey of children aged 10 to 15 only covers personal level crime (so excludes household level crime) and, as with the adult survey, doesn’t include sexual offences.
The majority (74%) of violent crimes experienced in the year ending December 2014 resulted in minor or no injury, so in most cases the violence is low level.
Police recorded crimes are notifiable offences which are all crimes that could possibly be tried by a jury (these include some less serious offences, such as minor theft that would not usually be dealt with in this way) plus a few additional closely related offences, such as assault without injury.
The methodological note Analysis of variation in crime trends and Section 4.2 of the User Guide (1.61 Mb Pdf) have more details.
Victim-based crimes are those offences with a specific identifiable victim. These cover the police recorded crime categories of violence against the person, sexual offences, robbery, theft offences, and criminal damage and arson.
Other crimes against society’ cover offences without a direct victim, and includes drug offences, possession of weapon offences, public order offences and miscellaneous crimes against society.
Of the 224,947 fraud offences in the year ending December 2014, 3 offences were recorded by the police, these cases are likely to be revised in future quarters.
Non-notifiable offences are offences dealt with exclusively by magistrates’ courts or by the police issuing of a Penalty Notice for Disorder or a Fixed Penalty Notice. Along with non-notifiable offences dealt with by the police (such as speeding), these include many offences that may be dealt with by other agencies – for example: prosecutions by TV Licensing; or the Driver and Vehicle Licensing Agency (DVLA) for vehicle registration offences.
This is a premises based survey: respondents were asked if the business at their current premises had experienced any of a range of crime types in the 12 months prior to interview and, if so, how many incidents of crime had been experienced.
'All other theft’ includes: theft of unattended items, theft from a dwelling (by a person who has permission to be in the home) and making off without payment
Homicide includes the offences of murder, manslaughter, corporate manslaughter and infanticide. Figures from the Homicide Index for the time period April 2013 to March 2014, which take account of further police investigations and court outcomes, were published in Focus on: Violent Crime and Sexual Offences, 2013/14 on 12 February 2015.
These figures, taken from the Homicide Index, are less likely to be affected by changes in police recording practices made in 1998 and 2002, so it is possible to examine longer-term trends.
Only selected violent offences can be broken down by whether a knife or sharp instrument was used. These are: homicide; attempted murder; threats to kill; assault with injury and assault with intent to cause serious harm; robbery; rape; and sexual assault.
Information taken from the Focus on Violent Crime and Sexual Offences, 2013/14 is based on a self-completion module of the CSEW asked of respondents aged 16 to 59.
The standard recorded crime collection does not provide information on the date when the offence occurred and this analysis is based on just under half of the 43 territorial police forces in England and Wales that provided additional information on sexual offences to the Home Office Data Hub.
Action Fraud had taken over the recording of all fraud offences from police forces by the end of 2012/13, but police recorded figures showed a count of three fraud offences in the year ending December 2014. This is a consequence of the transitional process, and these cases will likely be revised in future publications.
5. Violent crime
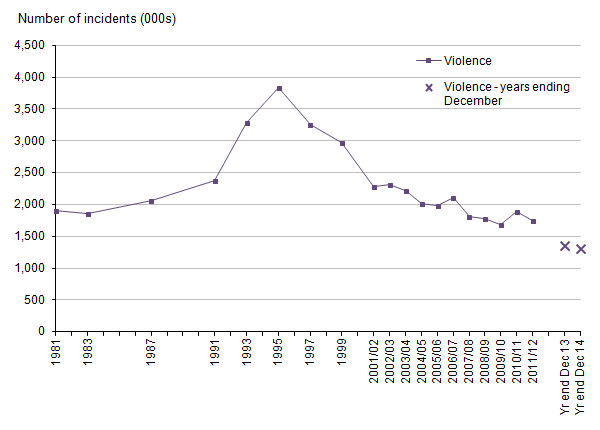
Violent crime in the Crime Survey for England and Wales (CSEW) is referred to as “violence”, and includes wounding and assault. There are additional breakdowns for violence with and without injury, as well as on the offender-victim relationship. Violent crime in police recorded data is referred to as “violence against the person” and includes homicide, violence with injury, and violence without injury. Violent offences that have no identifiable victim are classified as other offences, such as public disorder. The underlying trend from the survey indicates that violent crime has continued to fall, although, as with the apparent 3% decrease in the year ending December 2014, year-on-year decreases have not always been statistically significant (Figure 3).
Figure 3: Trends in Crime Survey for England and Wales violence, 1981 to year ending December 2014
Source: Crime Survey for England and Wales, Office for National Statistics
Notes:
- The data on this chart refer to different time periods: a) 1981 to 1999 refer to crimes experienced in the calendar year (January to December) b) from 2001/02 onwards the estimates relate to crimes experienced in the 12 months before interview, based on interviews carried out in that financial year (April to March) c) the last two data points relate to interviews carried out in the rolling 12 month periods for the latest available 2 years (January to December).
- The numbers of incidents are derived by multiplying incidence rates by the population estimates for England and Wales.
Download this image Figure 3: Trends in Crime Survey for England and Wales violence, 1981 to year ending December 2014
.png (14.7 kB) .xls (77.8 kB)
Latest CSEW estimates show there were 1.3 million violent incidents in England and Wales (Figure 3). Violent incidents comprised 19% of all CSEW crime, making them an important driver of overall trends.
With regard to the latest estimate, the number of violent incidents has decreased by 66% from the peak of violent crime in the 1995 survey (Table 4b). Around 2 in every 100 adults were a victim of violent crime in the last year, based on the year ending December 2014 survey, compared with around 5 in 100 adults in the 1995 survey (Table 4a). However, it is important to note that victimisation rates vary considerably across the population and by geographic area. Such variations in victimisation rates are further explored in our thematic reports, which are published annually1.
The longer term reduction in violent crime, as shown by the CSEW, is supported by evidence from several health data sources. The most recent provisional National Health Service (NHS) data on assault admissions to hospitals in England show that, for the 12 months to the end of March 2014, there were 31,243 hospital admissions for assault, a reduction of 5% compared with figures for the preceding 12 months2. In addition, research conducted by the Violence and Society Research Group at Cardiff University (Sivarajasingam et al., 2015) also show a downward trend. Findings from their annual survey, covering a sample of hospital emergency departments and walk-in centres in England and Wales, showed an overall decrease of 10% in serious violence-related attendances in 2014 compared with 2013.
Whilst overall levels of violent crime in the CSEW have been decreasing, neither the CSEW or police recorded crime are good data sources for some “high harm” crimes, where there has been recent increased focus, such as Female Genital Mutilation (FGM) and modern slavery.
Offences of FGM that come to the attention of the police will be contained within the police recorded crime category of assault with injury. However, it is known that much FGM remains hidden and unreported to the police. The Health and Social Care Information Center (HSCIC) have published new experimental statistics on FGM 3. These data are collected monthly from hospitals in England and are being collected to gain a better picture of the prevalence of FGM4. For the period September to December 2014, there were 1,946 newly identified5 cases of FGM reported nationally. Of course, these are only cases that have come to light as a result of a victim receiving medical treatment and will understate the true volume of such offences.
Modern slavery is currently spread across a number of police recorded classifications including “sexual offences” and “other crimes against society”. As a result it is not currently possible to identify the number of modern slavery offences. As of 1st April 2015 modern slavery will be included in the police recorded crime category “violence without injury” and will be a separately identifiable offence. It has been estimated that the number of victims of modern slavery in 2013 ranges between 10,000 and 13,0006.
The CSEW violence offences can be broken down further into “violence with injury” and “violence without injury”. The subcategory of “violence with injury” shows an apparent decrease of 14% in the year ending December 2014 compared with the previous year, though this was not statistically significant. The apparent increase of 10% in “violence without injury” was not statistically significant.
Table 4a: CSEW violence - number, rate and percentage of incidents [1]
| England and Wales | ||||||
| Adults aged 16 and over | ||||||
| Interviews from: | ||||||
| Jan-95 to Dec-95 | Apr-03 to Mar-04 | Apr-08 to Mar-09 | Jan-13 to Dec-132 | Jan-14 to Dec-142 | ||
| Number of incidents | Thousands | |||||
| Violence | 3,837 | 2,213 | 1,774 | 1,354 | 1,316 | |
| with injury | 2,270 | 1,204 | 959 | 720 | 621 | |
| without injury | 1,567 | 1,009 | 815 | 634 | 695 | |
| Incidence rate per 1,000 adults | ||||||
| Violence | 94 | 53 | 41 | 30 | 29 | |
| with injury | 56 | 29 | 22 | 16 | 14 | |
| without injury | 39 | 24 | 19 | 14 | 15 | |
| Percentage of adults who were victims once or more | % | |||||
| Violence | 4.8 | 3.4 | 2.7 | 1.9 | 1.8 | |
| with injury | 3.0 | 2.0 | 1.5 | 1.1 | 0.9 | |
| without injury | 2.1 | 1.6 | 1.3 | 0.9 | 1.0 | |
| Unweighted base - number of adults | 16,337 | 37,891 | 46,220 | 36,354 | 32,666 | |
| Source: Crime Survey for England and Wales, Office for National Statistics | ||||||
| Notes: | ||||||
| 1. Appendix table A1, A2, A3 provide detailed footnotes and data for further years. | ||||||
| 2. Base sizes for data since the years ending December 2013 and December 2014 are smaller than previous years, due to sample size reductions introduced in April 2012. | ||||||
Download this table Table 4a: CSEW violence - number, rate and percentage of incidents [1]
.xls (77.3 kB)
Table 4b: CSEW violence - percentage change and statistical significance [1]
| England and Wales | ||||||||
| Adults aged 16 and over | ||||||||
| January 2014 to December 2014 compared with: | ||||||||
| Jan-95 to Dec-95 | Apr-03 to Mar-04 | Apr-08 to Mar-09 | Jan-13 to Dec-13 | |||||
| Number of incidents | Percentage change and significance2 | |||||||
| Violence | -66 | * | -41 | * | -26 | * | -3 | |
| with injury | -73 | * | -48 | * | -35 | * | -14 | |
| without injury | -56 | * | -31 | * | -15 | 10 | ||
| Incidence rate per 1,000 adults | ||||||||
| Violence | -69 | * | -46 | * | -29 | * | -4 | |
| with injury | -76 | * | -53 | * | -38 | * | -14 | |
| without injury | -60 | * | -37 | * | -19 | 9 | ||
| Percentage of adults who were victims once or more | Percentage point change and significance2,3 | |||||||
| Violence | -3.0 | * | -1.6 | * | -0.9 | * | -0.1 | |
| with injury | -2.1 | * | -1.1 | * | -0.7 | * | -0.2 | * |
| without injury | -1.2 | * | -0.6 | * | -0.3 | * | 0.1 | |
| Source: Crime Survey for England and Wales, Office for National Statistics | ||||||||
| Notes: | ||||||||
| 1. Appendix table A1, A2, A3 provide detailed footnotes and data for further years. | ||||||||
| 2. Statistically significant change at the 5% level is indicated by an asterisk. | ||||||||
| 3. The percentage point change presented in the tables may differ from subtraction of the 2 percentages due to rounding. | ||||||||
Download this table Table 4b: CSEW violence - percentage change and statistical significance [1]
.xls (84.0 kB)Estimates of violence against 10 to 15 year olds as measured by the CSEW can be found in the section ‘Crime experienced by children aged 10 to 15’.
The overall level of violence against the person recorded by the police in the year ending December 2014 showed a 21% increase compared with the previous year (up from 614,410 to 740,802, Tables 5a and 5b). Within this, “violence with injury” showed a 15% rise and “violence without injury” increased by 26%. All police forces showed rises, the largest volume increase being reported by the Metropolitan Police Service who recorded an additional 31,015 offences compared with the previous year (a 25% increase).
It is known that violent offences are more prone to subjective judgement about whether to record a crime than some other offences. The Crime-recording: making the victim count report published by Her Majesty’s Inspectorate of Constabulary (HMIC) found that violence against the person offences had the highest under-recording rates across police forces in England and Wales. Nationally, an estimated 1 in 3 (33%) violent offences that should have been recorded as crimes were not. Therefore, action taken by police forces to improve their compliance with the National Crime Recording Standard (NCRS) and the renewed focus on the accuracy of crime recording by the police is likely to have resulted in the increase in the number of offences recorded7. This is supported by evidence from the Metropolitan Police Service8, which shows an increase in the number of reports of violence being recorded as crimes in that police force. The ‘Accuracy of the statistics’ section has more information.
Another factor behind the rise is the increase in the reporting of domestic abuse and subsequent recording of these offences by the police. An HMIC inspection expressed concerns about the police response to domestic abuse, but noted the majority of Police and Crime Commissioners (PCC) were now showing a strong commitment to tackling it. The report noted just under half of PCCs had made a commitment to increase the reporting of this type of offence. It is thought that this renewed focus may have led to more victims coming forward to report crimes and allegations treated more sensitively.
The latest rise in violence against the person recorded by the police is in contrast to the trend shown by the Crime Survey and figures on attendances at Accident and Emergency departments due to violent assaults, cited previously. This supports the view that the apparent rise in violence against the person offences recorded by the police reflects changes in recording practices, rather than levels of crime.
Compared with 2003/04, the volume of violence against the person offences recorded by the police has fallen by 7%. The rates for violence against the person have dropped from 15 recorded offences per 1,000 population in 2003/04 to 13 recorded offences per 1,000 population in the year ending December 2014 (Table 5a).
In contrast to other violent crime, there is unlikely to be significant under-recording of homicides by the police. In the year ending December 2014, the police recorded 515 homicides, 37 fewer than in the previous year (Table 5a)9. This latest annual count of homicides is at its lowest since 1977 (484 offences). Historically, the number of homicides increased from around 300 per year in the early 1960s to over 800 per year in the early years of this century10, a faster rate of increase than the growth in population. Since then,the number of homicides recorded per year has been on a downward trend, while the population of England and Wales has continued to grow. The rate of homicide has fallen by almost half between 2003/04 and the year ending December 2014, from 17 homicides per million population11; to 9 homicides per million population.
In the year ending December 2014 the police recorded 74,999 harassment offences. From 1 April 2014 stalking became a specific legal offence following the introduction of the Protection of Freedoms Act 2012. Prior to this it would have been hidden within other offences, largely harassment. In the year ending December 2014, for the 9 months that stalking has been a separate offence category, the police recorded 2,187 such offences. As this newly separated stalking offence only contains 3 quarter’s worth of data (offences recorded between 1 April and 31 December 2014) there will be a rise in the next release as a full years data will be available. This change in the law should also be borne in mind when looking at trends in harassment ( Appendix table A4 (486 Kb Excel sheet) ).
There is more detailed information on trends and the circumstances of violence against the person in Focus on: Violent Crime and Sexual Offences, 2013/14.
Table 5a: Police recorded violence against the person - number and rate of offences [1,2,3]
| England and Wales | |||||
| Apr-03 to Mar-04 | Apr-08 to Mar-09 | Jan-13 to Dec-13 | Jan-14 to Dec-14 | ||
| Violence against the person offences | 799,247 | 709,008 | 614,410 | 740,802 | |
| Homicide4 | 904 | 664 | 552 | 515 | |
| Violence against the person - with injury5 | 457,731 | 420,643 | 315,396 | 362,852 | |
| Violence against the person - without injury6 | 340,612 | 287,701 | 298,462 | 377,435 | |
| Violence against the person rate per 1,000 population | 15 | 13 | 11 | 13 | |
| Source: Police recorded crime, Home Office | |||||
| Notes: | |||||
| 1. Police recorded crime data are not designated as National Statistics. | |||||
| 2. Police recorded crime statistics based on data from all 44 forces in England and Wales (including the British Transport Police). | |||||
| 3. Appendix table A4 provides detailed footnotes and data for further years. | |||||
| 4. Includes the offences of murder, manslaughter, corporate manslaughter and infanticide. | |||||
| 5. Includes attempted murder, intentional destruction of viable unborn child, causing death by dangerous driving/careless driving when under the influence of drink or drugs, more serious wounding or other act endangering life (including grievous bodily harm with and without intent), causing death by aggravated vehicle taking, assault with injury, assault with intent to cause serious harm and less serious wounding offences. | |||||
| 6. Includes threat or conspiracy to murder, harassment, other offences against children and assault without injury (formerly common assault where there is no injury). | |||||
Download this table Table 5a: Police recorded violence against the person - number and rate of offences [1,2,3]
.xls (76.8 kB)
Table 5b: Police recorded violence against the person - percentage change [1,2,3]
| England and Wales | ||||
| Percentage change | ||||
| January 2014 to December 2014 compared with: | ||||
| Apr-03 to Mar-04 | Apr-08 to Mar-09 | Jan-13 to Dec-13 | ||
| Violence against the person offences | -7 | 4 | 21 | |
| Homicide4 | -43 | -22 | -7 | |
| Violence against the person - with injury5 | -21 | -14 | 15 | |
| Violence against the person - without injury6 | 11 | 31 | 26 | |
| Source: Police recorded crime, Home Office | ||||
| Notes: | ||||
| 1. Police recorded crime data are not designated as National Statistics. | ||||
| 2. Police recorded crime statistics based on data from all 44 forces in England and Wales (including the British Transport Police). | ||||
| 3. Appendix table A4 provides detailed footnotes and data for further years. | ||||
| 4. Includes the offences of murder, manslaughter, corporate manslaughter and infanticide. | ||||
| 5. Includes attempted murder, intentional destruction of viable unborn child, causing death by dangerous driving/careless driving when under the influence of drink or drugs, more serious wounding or other act endangering life (including grievous bodily harm with and without intent), causing death by aggravated vehicle taking, assault with injury, assault with intent to cause serious harm and less serious wounding offences. | ||||
| 6. Includes threat or conspiracy to murder, harassment, other offences against children and assault without injury (formerly common assault where there is no injury). | ||||
Download this table Table 5b: Police recorded violence against the person - percentage change [1,2,3]
.xls (77.3 kB)Notes for violent crime
There is more information on violent crime in Focus on: Violent Crime and Sexual Offences, 2013/14
Based on the latest National Health Service (NHS) Hospital Episode Statistics and hospital admissions due to assault (dated 15 July 2014). These don’t include figures for Wales and relate to activity in English NHS hospitals.
Figures from the Health and Social Care Information Center on Female Genital Mutilation do not include figures for Wales and relate to activity in English foundation and non-foundation trusts including A&E departments. 131 of the 157 eligible acute trusts in England submitted signed off data.
Clinical staff must record in patient healthcare records when it is identified that a patient has undergone FGM. This applies to all NHS clinicians and healthcare professionals across the NHS. However, the requirement to submit the FGM Prevalence Dataset is only mandatory for Foundation and non-Foundation trusts, including Accident and Emergency departments. Other organisations (which may include GPs) may wish to provide an FGM Prevalence Dataset centrally, the Data Quality Note contains further information.
Patients first identified during the reporting period as having undergone FGM at any stage in their life.
This exploratory analysis uses Multiple Systems Estimation (MSE) which includes data on the number of victims of modern slavery from a number of organisaions such as; Local Authorities, Police Forces, Government Organisations (mostly Home Office agencies), Non-governmantal organisations, the National Crime Agency and the General Public (through various routes). The report ‘Modern Slavery: an application of Multiple Systems Estimation’ has more information.
The inspections took place over the period December 2013 to August 2014, this falls within the time period covered by this release. The current year covers the period January 2014 to December 2014 and the comparator year covers the period January 2013 to December 2013.
In evidence given by the Metropolitan Police Service to the London Assembly Police and Crime Committee on 13 November 2014, they reported that the proportion of incidents of violence that were converted into recorded crimes increased from 40% to 75% between 2012 and 2014.
Homicide includes the offences of murder, manslaughter, corporate manslaughter and infanticide.
These figures, taken from the Homicide Index, are less likely to be affected by changes to in police recording practice made in 1998 and 2002, so it is possible to examine longer-term trends.
While most rates of recorded crime are given per 1,000 population, due to the relatively low number of offences recorded, and to aid interpretation, homicide rates are given per million population.
6. Robbery
Robbery is an offence in which force, or the threat of force, is used either during or immediately prior to a theft or attempted theft.
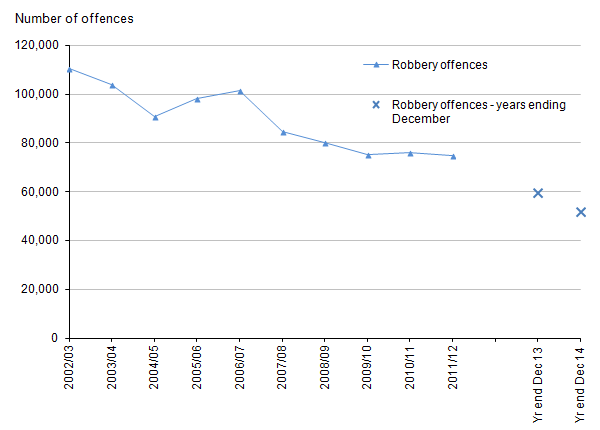
Robbery is a relatively low volume offence, accounting for less than 2% of all police recorded crime in the year ending December 2014. The latest figures show police recorded robberies decreased by 13% in the year ending December 2014 compared with the previous year (Tables 6a and 6b). With the exception of a notable rise in the number of robberies in 2005/06 and 2006/07, there has been a general downward trend since 2002/03 in England and Wales. The latest figure shows the number of robbery offences falling to 51,585- the lowest level since the introduction of the National Crime Recording Standard (NCRS) in 2002/03 (Figure 4).
The Crime-recording: making the victim count report, published by Her Majesty’s Inspectorate of Constabulary (HMIC) found that nationally, an estimated 14% of robbery offences that should have been recorded as crimes were not; this level of under-recording is better than the national average of 19%. The ‘Accuracy of the statistics’ section has more information.
Not all robberies will be reported to the police1, the Crime Survey for England and Wales (CSEW) estimates there were 106,000 robbery offences in the year ending December 2014, however, owing to the small number of robbery victims interviewed in the CSEW, the number of robberies recorded by the police provides a more robust indication of trends2.
Figure 4: Trends in police recorded robberies, 2002/03 to year ending December 2014
Source: Police recorded crime, Home Office
Notes:
- Police recorded crime data are not designated as National Statistics.
Download this image Figure 4: Trends in police recorded robberies, 2002/03 to year ending December 2014
.png (13.2 kB) .xls (76.8 kB)
In the year ending December 2014, 89% of robberies recorded by the police were of personal property. There were 45,807 of these offences, down 15% compared with the previous year. Robbery of business property (which makes up the remaining 11% of total robbery offences) showed similar levels in the year ending December 2014 to those recorded in the previous year. In the year ending December 2014, around 1 in 5 robberies (20%) recorded by the police involved a knife or other sharp instrument, the same level as recorded in the previous year (Table 9b).
Table 6a: Police recorded robbery - number and rate of offences [1,2,3]
| England and Wales | ||||
| Apr-03 to Mar-04 | Apr-08 to Mar-09 | Jan-13 to Dec-13 | Jan-14 to Dec-14 | |
| Robbery offences | 103,736 | 80,130 | 59,426 | 51,585 |
| Robbery of business property | 10,110 | 9,350 | 5,783 | 5,778 |
| Robbery of personal property | 93,626 | 70,780 | 53,643 | 45,807 |
| Robbery rate per 1,000 population | 2 | 1 | 1 | 1 |
| Source: Police recorded crime, Home Office | ||||
| Notes: | ||||
| 1. Police recorded crime data are not designated as National Statistics. | ||||
| 2. Police recorded crime statistics based on data from all 44 forces in England and Wales (including the British Transport Police). | ||||
| 3. Appendix table A4 provides detailed footnotes and data for further years. | ||||
Download this table Table 6a: Police recorded robbery - number and rate of offences [1,2,3]
.xls (81.9 kB)
Table 6b: Police recorded robbery - percentage change [1,2,3]
| England and Wales | |||
| Percentage change | |||
| January 2014 to December 2014 compared with: | |||
| Apr-03 to Mar-04 | Apr-08 to Mar-09 | Jan-13 to Dec-13 | |
| Robbery offences | -50 | -36 | -13 |
| Robbery of business property | -43 | -38 | -0 |
| Robbery of personal property | -51 | -35 | -15 |
| Source: Police recorded crime, Home Office | |||
| Notes: | |||
| 1. Police recorded crime data are not designated as National Statistics. | |||
| 2. Police recorded crime statistics based on data from all 44 forces in England and Wales (including the British Transport Police). | |||
| 3. Appendix table A4 provides detailed footnotes and data for further years. | |||
Download this table Table 6b: Police recorded robbery - percentage change [1,2,3]
.xls (81.9 kB)These offences are concentrated in a small number of metropolitan forces with nearly half (44%) of all offences recorded in London, and a further 21% in the Greater Manchester, West Midlands and West Yorkshire police force areas combined ( Table P1 (154 Kb Excel sheet) ). The geographic concentration of robbery offences means that trends across England and Wales tend to reflect what is happening in these areas, in particular the Metropolitan Police force area. The latest figures for the Metropolitan Police force area show that the number of robberies for the year ending December 2014 was 22,582, a decrease of 25% from the previous year ( Tables P1-P2 (154 Kb Excel sheet) ). This continues the downward trend seen in the year ending March 2013 (11% fall), following increases in the 3 preceding years. The fall in the number of robbery offences in the Metropolitan police force accounts for 95% of the total fall in robbery in England and Wales.
The small number of robbery victims interviewed in any 1 year means that CSEW estimates have large confidence intervals and are prone to fluctuation. So, while there was an apparent 31% decrease in the year ending December 2014 compared with the previous year, this reduction was not statistically significant. However, the current volume is 69% lower than the level seen in the 1995 overall crime peak (Tables 7a and 7b).
Table 7a: CSEW robbery - number, rate and percentage of incidents [1,2]
| England and Wales | |||||
| Adults aged 16 and over | |||||
| Interviews from: | |||||
| Jan-95 to Dec-95 | Apr-03 to Mar-04 | Apr-08 to Mar-09 | Jan-13 to Dec-133 | Jan-14 to Dec-143 | |
| Thousands | |||||
| Number of robbery incidents | 339 | 271 | 262 | 154 | 106 |
| Robbery incidence rate per 1,000 adults | 8 | 7 | 6 | 3 | 2 |
| % | |||||
| Percentage of adults that were victims of robbery once or more | 0.7 | 0.6 | 0.5 | 0.3 | 0.2 |
| Unweighted base - number of adults | 16,337 | 37,891 | 46,220 | 36,354 | 32,666 |
| Source: Crime Survey for England and Wales, Office for National Statistics | |||||
| Notes: | |||||
| 1. Appendix table A1, A2, A3 provide detailed footnotes and data for further years. | |||||
| 2. Figures are based on analysis of a small number of victims and should be interpreted with caution. | |||||
| 3. Base sizes for data since the years ending December 2013 and December 2014 are smaller than previous years, due to sample size reductions introduced in April 2012. | |||||
Download this table Table 7a: CSEW robbery - number, rate and percentage of incidents [1,2]
.xls (77.3 kB)
Table 7b: CSEW robbery - percentage change and statistical significance [1,2]
| England and Wales | ||||||||
| Adults aged 16 and over | ||||||||
| January 2014 to December 2014 compared with: | ||||||||
| Jan-95 to Dec-95 | Apr-03 to Mar-04 | Apr-08 to Mar-09 | Jan-13 to Dec-13 | |||||
| Percentage change and significance3 | ||||||||
| Number of robbery incidents | -69 | * | -61 | * | -60 | * | -31 | |
| Robbery incidence rate per 1,000 adults | -72 | * | -64 | * | -62 | * | -32 | |
| Percentage point change and significance3,4 | ||||||||
| Percentage of adults that were victims of robbery once or more | -0.5 | * | -0.4 | * | -0.3 | * | -0.1 | |
| Source: Crime Survey for England and Wales, Office for National Statistics | ||||||||
| Notes: | ||||||||
| 1. Appendix table A1, A2, A3 provide detailed footnotes and data for further years. | ||||||||
| 2. Figures are based on analysis of a small number of victims and should be interpreted with caution. | ||||||||
| 3. Statistically significant change at the 5% level is indicated by an asterisk. | ||||||||
| 4. The percentage point change presented in the tables may differ from subtraction of the 2 percentages due to rounding. | ||||||||
Download this table Table 7b: CSEW robbery - percentage change and statistical significance [1,2]
.xls (77.3 kB)Notes for robbery
In the 2013/14 survey analysis showed that 42% of CSEW robbery offences were reported to the police. Further information can be found in the Annual trend and demographic tables, 2013/14.
The 2013/14 CSEW estimated there were 166,000 robbery offences in England and Wales, the confidence intervals around this estimate showed that the number of offences was between 123,000 and 209,000. Further information can be found in the User guide tables.
7. Sexual offences
It is difficult to obtain reliable information on the volume of sexual offences as it is known1 that a high proportion of offences are not reported to the police and changes in recorded figures may reflect changes in reporting or recording rates rather than actual victimisation. For these reasons, caution should be used when interpreting trends in these offences (there is more information in An Overview of Sexual Offending in England and Wales and Focus on: Violent Crime and Sexual Offences, 2013/14).
Police recorded crime figures showed an increase of 32% in all sexual offences for the year ending December 2014 compared with the previous year (up from 60,837 to 80,262; Table 8a). This is the highest level ever recorded since the introduction of the National Crime Recording Standard (NCRS) in April 2002. Increases in offences against both adults and children have contributed to this rise. Increases were seen in all police forces; Table P2 (154 Kb Excel sheet) .
Police recorded rape increased by 40% (to 26,703 offences) compared with the previous year, following previous increases over the past five years. Other sexual offences increased by 28% (to 53,559 offences). Both rape and other sexual offences are at the highest level since the NCRS was introduced in 2002/03. The latest rises in total sexual offences, and the component categories of rape and other sexual offences, are the largest year-on-year increases since the introduction of the NCRS in 2002/03.
There are likely to be two main factors in the rise in police recorded rape and other sexual offences; an improvement in crime recording by the police for these offences and an increase in the willingness of victims to come forward and report these crimes to the police.
The rises in the volume of sexual offences recorded by the police should be seen in the context of a number of high-profile reports and inquiries, including:
the investigation by Her Majesty’s Inspectorate of Constabulary (HMIC) and HM Crown Prosecution Service Inspectorate (HMCPSI)2 in 2012, which highlighted the need to improve the recording and investigation of sexual offences
concerns about the recording of sexual offences, for example in evidence presented to the Public Administration Select Committee (PASC) inquiry3 and arising from other high profile cases. This is likely to have resulted in police forces reviewing and improving their recording processes
the creation of the ‘Independent Panel Inquiry into Child Sexual Abuse’, which was set up to consider whether, and the extent to which, public bodies and other non-state institutions have taken seriously their duty of care to protect children from sexual abuse in England and Wales
the Crime-recording: making the victim count report published by HMIC found that sexual offences had been substantially under-recorded by police forces in England and Wales, an estimated 1 of 4 (26%) sexual offences that should have been recorded as crimes were not. Therefore, action taken by police forces to improve their compliance with the NCRS, given the renewed focus on the accuracy of crime recording, is likely to have resulted in an increase in the number of offences recorded. The ‘Accuracy of the statistics’ section has more information
The increase in people coming forward to report sexual offences is likely to be due to a wider ‘Operation Yewtree’ effect, where victims of sexual offences that are not directly connected to Yewtree are now reporting these offences to the police. Further insight into the wider ‘Yewtree effect’ can be provided by looking at the Home Office Data Hub, a record level dataset of police recorded offences4. Previous releases5 have shown historical offences were a large contributor to the increase in sexual offences. However, historical offences are now making a substantially smaller contribution to the overall rise, while the contribution made by recent offences has increased6. In forces for which data were available most of the increase in sexual offences was accounted for by offences that occurred within the previous 12 months (79%).
Figure 5: Trends in police recorded sexual offences in England and Wales, 2002/03 to year ending December 2014
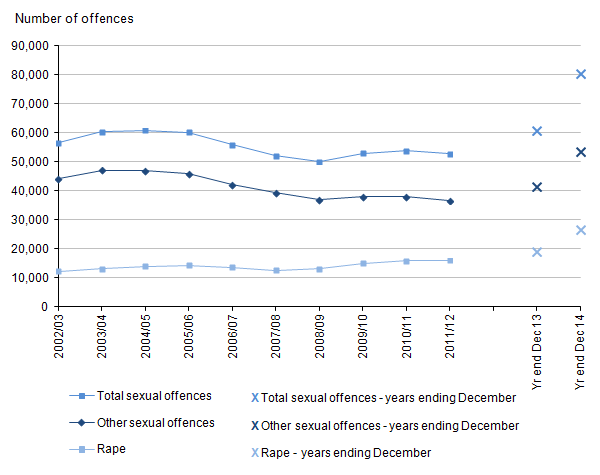
Source: Police recorded crime, Home Office
Notes:
- Police recorded crime data are not designated as National Statistics.
- The Sexual Offences Act 2003, introduced in May 2004, altered the definition and coverage of sexual offences.
Download this image Figure 5: Trends in police recorded sexual offences in England and Wales, 2002/03 to year ending December 2014
.png (18.4 kB) .xls (77.3 kB)
Table 8a: Police recorded sexual offences - number and rate of offences [1,2,3]
| England and Wales | ||||||||
| Apr-03 to Mar-04 | Apr-08 to Mar-09 | Jan-13 to Dec-13 | Jan-14 to Dec-14 | |||||
| Sexual offences | 60,412 | 50,185 | 60,837 | 80,262 | ||||
| Rape | 13,272 | 13,096 | 19,099 | 26,703 | ||||
| Other sexual offences | 47,140 | 37,089 | 41,738 | 53,559 | ||||
| Sexual offences rate per 1,000 population | 1 | 1 | 1 | 1 | ||||
| Source: Police recorded crime, Home Office | ||||||||
| Notes: | ||||||||
| 1. Police recorded crime data are not designated as National Statistics. | ||||||||
| 2. Police recorded crime statistics based on data from all 44 forces in England and Wales (including the British Transport Police). | ||||||||
| 3. Appendix table A4 provides detailed footnotes and data for further years. | ||||||||
Download this table Table 8a: Police recorded sexual offences - number and rate of offences [1,2,3]
.xls (75.3 kB)
Table 8b: Police recorded sexual offences - percentage change [1,2,3]
| England and Wales | |||
| Percentage change | |||
| January 2014 to December 2014 compared with: | |||
| Apr-03 to Mar-04 | Apr-08 to Mar-09 | Jan-13 to Dec-13 | |
| Sexual offences | 33 | 60 | 32 |
| Rape | 101 | 104 | 40 |
| Other sexual offences | 14 | 44 | 28 |
| Source: Police recorded crime, Home Office | |||
| Notes: | |||
| 1. Police recorded crime data are not designated as National Statistics. | |||
| 2. Police recorded crime statistics based on data from all 44 forces in England and Wales (including the British Transport Police). | |||
| 3. Appendix table A4 provides detailed footnotes and data for further years. | |||
Download this table Table 8b: Police recorded sexual offences - percentage change [1,2,3]
.xls (81.9 kB)Crime Survey for England and Wales (CSEW)
Due to the small number of sexual offences identified in the main CSEW crime measure, estimates of the volume of incidents are too unreliable to report. Since 2004/05, the CSEW has included a self-completion questionnaire module on intimate violence which does provide a measure of the proportion of people who have been victims of sexual offences and supplements the information presented here7. Estimates from the 2013/14 CSEW show a fall in sexual assault victimisation rates compared with the previous year. Detailed findings from this module for 2013/14 are available in Focus on: Violent Crime and Sexual Offences, 2013/14.
Notes for sexual offences
As frequently indicated in the findings from the CSEW self-completion module on intimate violence, for example, presented in Focus on: Violent Crime and Sexual Offences, 2013/14.
HMIC and HMCPSI, 2012 has further information.
The Commission of an independent review into rape investigation and the transcript for the Public Administration Select Committee hearing on Crime Statistics (19 November 2013) have more information.
The Home Office Data Hub includes additional information provided by police forces, such as when an offence took place, as well as when it was recorded by the police.
More information can be found in Crime in England and Wales, Year Ending September 2013.
Based on analysis of just under half of the 43 territorial police forces of England and Wales.
Chapter 5 of the User Guide has more information regarding intimate violence.
8. Offences involving knives and sharp instruments
Some of the more serious offences in the recorded crime data (violent, robbery and sexual offences) can be broken down by whether or not a knife or sharp instrument was involved1,2.
In the year ending December 2014, the police recorded 26,000 offences involving a knife or sharp instrument, a similar number compared with the previous year (26,016, Table 9a).There were increases across most of the offence groups for which data are collected, in particular assault with injury and assault with intent to cause serious harm (up 10%). However, these increases were offset by a reduction in robbery offences involving the use of a knife or sharp instrument (down 14% compared with the previous year3).
For some offence types, such as rape and sexual assault, the relatively low number of offences, that involve the use of a knife or sharp instrument means the volume of these offences are subject to apparent large percentage changes, and should be interpreted with caution. For example the number of rapes involving knives or sharp instruments recorded by the police increased from 238 in the year ending December 2013 to 311 in the current year (an increase of 31%) and the number of sexual assaults involving knives increased from 89 in the year ending December 2013 to 125 in the current year (an increase of 40%).
Between 2010/11 (the earliest period for which data are directly comparable) and 2012/13, across all offence groups where it is possible to identify whether a knife or sharp instrument was used, the numbers of offences recorded by the police saw reductions. Following on from 2012/13, to the year ending December 2014, with the exceptions of homicide and robbery offences, there have been increases in the numbers of offences where a knife or sharp instrument was used. Therefore, while there was no change in the overall number of offences involving a knife or sharp instrument, for the latest time period, this masks falls in some offences and rises in others.
Table 9a: Number and percentage change of selected violent and sexual offences involving a knife or sharp instrument recorded by the police [1,2,3,4]
| England and Wales | |||||||
| Selected offence type | Number of selected offences involving a knife or sharp instrument | % change year ending Dec-13 to year ending Dec-14 | |||||
| Apr-10 to Mar-11 | Apr-11 to Mar-12 | Apr-12 to Mar-13 | Apr-13 to Mar-14 | Jan-13 to Dec-13 | Jan-14 to Dec-14 | ||
| Attempted murder | 240 | 246 | 198 | 248 | 239 | 245 | 3 |
| Threats to kill | 1,462 | 1,183 | 1,188 | 1,317 | 1,282 | 1,634 | 27 |
| Assault with injury and assault with intent to cause serious harm5 | 14,144 | 12,774 | 11,491 | 11,911 | 11,809 | 13,028 | 10 |
| Robbery | 16,454 | 16,427 | 13,201 | 11,927 | 12,168 | 10,468 | -14 |
| Rape | 259 | 237 | 190 | 267 | 238 | 311 | 31 |
| Sexual assault6 | 94 | 72 | 90 | 101 | 89 | 125 | 40 |
| Total selected offences | 32,653 | 30,939 | 26,358 | 25,771 | 25,825 | 25,811 | -0 |
| Homicide7 | 237 | 211 | 195 | 203 | 191 | 189 | -1 |
| Total selected offences including homicide | 32,890 | 31,150 | 26,553 | 25,974 | 26,016 | 26,000 | -0 |
| Source: Police recorded crime, Home Office | |||||||
| Notes: | |||||||
| 1. Police recorded crime data are not designated as National Statistics. | |||||||
| 2. Police recorded crime statistics based on data from all 44 forces in England and Wales (including the British Transport Police). | |||||||
| 3. Police recorded knife and sharp instrument offences data are submitted via an additional special collection. Proportions of offences involving the use of a knife or sharp instrument presented in this table are calculated based on figures submitted in this special collection. Other offences exist that are not shown in this table that may include the use of a knife or sharp instrument. | |||||||
| 4. Surrey police force includes unbroken bottle and glass offences in their returns, which are outside the scope of this special collection however it is not thought that offences of this kind constitute a large enough number to impact on the national figure. | |||||||
| 5. Changes to offence codes in April 2012 mean the category of assault with injury and assault with intent to cause serious harm is not directly comparable with previous years. Appendix table A4 contains more details. | |||||||
| 6. Sexual assault includes indecent assault on a male/female and sexual assault on a male/female (all ages). | |||||||
| 7. Homicide offences are those currently recorded by the police as at 2 March 2015 and are subject to revision as cases are dealt with by the police and by the courts, or as further information becomes available. They include the offences of murder, manslaughter, infantIcide and, as of 2012/13, corporate manslaughter. These figures are taken from the detailed record level Homicide Index (rather than the main police collection for which forces are only required to provide an overall count of homicides, used in Table A4). There may therefore be differences in the total homicides figure used to calculate these proportions and the homicide figure presented in Table A4. | |||||||
Download this table Table 9a: Number and percentage change of selected violent and sexual offences involving a knife or sharp instrument recorded by the police [1,2,3,4]
.xls (73.2 kB)
Table 9b: Proportion of selected violent and sexual offences involving a knife or sharp instrument recorded by the police [1,2,3,4]
| England and Wales | ||||||
| Selected offence type | Proportion of selected offences involving a knife or sharp instrument | |||||
| Apr-10 to Mar-11 | Apr-11 to Mar-12 | Apr-12 to Mar-13 | Apr-13 to Mar-14 | Jan-13 to Dec-13 | Jan-14 to Dec-14 | |
| Attempted murder | 46 | 51 | 49 | 50 | 50 | 47 |
| Threats to kill | 15 | 15 | 16 | 15 | 16 | 14 |
| Assault with injury and assault with intent to cause serious harm5 | 4 | 4 | 4 | 4 | 4 | 4 |
| Robbery | 22 | 22 | 20 | 21 | 20 | 20 |
| Rape | 2 | 1 | 1 | 1 | 1 | 1 |
| Sexual assault6 | 0 | 0 | 0 | 0 | 0 | 0 |
| Total selected offences | 7 | 7 | 6 | 6 | 6 | 5 |
| Homicide7 | 37 | 39 | 35 | 38 | 35 | 41 |
| Total selected offences including homicide | 7 | 7 | 6 | 6 | 6 | 5 |
| Source: Police recorded crime, Home Office | ||||||
| Notes: | ||||||
| 1. Police recorded crime data are not designated as National Statistics. | ||||||
| 2. Police recorded crime statistics based on data from all 44 forces in England and Wales (including the British Transport Police). | ||||||
| 3. Police recorded knife and sharp instrument offences data are submitted via an additional special collection. Proportions of offences involving the use of a knife or sharp instrument presented in this table are calculated based on figures submitted in this special collection. Other offences exist that are not shown in this table that may include the use of a knife or sharp instrument. | ||||||
| 4. Surrey police force includes unbroken bottle and glass offences in their returns, which are outside the scope of this special collection however it is not thought that offences of this kind constitute a large enough number to impact on the national figure. | ||||||
| 5. Changes to offence codes in April 2012 mean the category of assault with injury and assault with intent to cause serious harm is not directly comparable with previous years. Appendix table A4 contains more details. | ||||||
| 6. Sexual assault includes indecent assault on a male/female and sexual assault on a male/female (all ages). | ||||||
| 7. Homicide offences are those currently recorded by the police as at 2 March 2015 and are subject to revision as cases are dealt with by the police and by the courts, or as further information becomes available. They include the offences of murder, manslaughter, infantIcide and, as of 2012/13, corporate manslaughter. These figures are taken from the detailed record level Homicide Index (rather than the main police collection for which forces are only required to provide an overall count of homicides, used in Table A4). There may therefore be differences in the total homicides figure used to calculate these proportions and the homicide figure presented in Table A4. | ||||||
Download this table Table 9b: Proportion of selected violent and sexual offences involving a knife or sharp instrument recorded by the police [1,2,3,4]
.xls (72.7 kB)Of the selected violent offences covered in Table 9b, around 5% involved a knife or sharp instrument in the year ending December 2014; this was a slightly lower proportion than that seen in the previous year (6%). This is likely to be the result of the increases seen in overall police recorded violence4. Two-fifths of homicides (41%) and just under a half of attempted murders (47%) involved a knife or sharp instrument.
Between 2010/11 and the year ending December 2014, the proportion of offences involving a knife or sharp instrument recorded by the police has remained relatively consistent across all offence groups.
Further analysis on offences involving knives and sharp instruments recorded in 2013/14 has been published in Focus on: Violent Crime and Sexual Offences, 2013/14.
An additional source of information about incidents involving knives and sharp instruments is provided by provisional National Health Service (NHS) hospital admission statistics5. Admissions for assault with a sharp instrument peaked at 5,720 in 2006/07. Admissions have declined since that year, and in the year ending March 2014 there were 3,654 admissions, a 5% decrease on the previous year. Admissions for assault with a sharp instrument in 2013/14 were the lowest since 2002/036.
Notes for offences involving knives and sharp instruments
- A sharp instrument is any object that pierces the skin (or in the case of a threat, is capable of piercing the skin), for example a broken bottle.
- Until April 2010, West Midlands Police force included unbroken bottle and glass offences in their statistics, but now exclude these offences in line with other forces.
- Changes to offence codes in April 2012 mean the category of assault with injury and assault with intent to cause serious harm are not directly comparable with previous years. Appendix table A4 (486 Kb Excel sheet) contains more details.
- The increases seen in overall police recorded violence reflect improved recording practices, which are thought to affect lower level violent offences more than serious violent crimes such as those involving a knife or sharp instrument.
- While it is a requirement to record every hospital admission, completing the field for external cause is not always done.
- Based on the latest National Health Service (NHS) Hospital Episode Statistics and hospital admissions due to assault (dated 15 July 2014). These do not include figures for Wales and relate to activity in English NHS hospitals. A graph based on financial years is available in the latest Focus on: Violent Crime and Sexual Offences release.
9. Offences involving firearms
Similar to the breakdown of offences involving knives or sharp instruments, statistics for the year ending December 2014 are available for police recorded crimes involving the use of firearms other than air weapons. Firearms are taken to be involved in an offence if they are fired, used as a blunt instrument against a person, or used as a threat. Focus on: Violent Crime and Sexual Offences, 2013/14 has more detailed information on trends and the circumstances of offences involving firearms, including air weapons, recorded in 2013/14.
Figures for the year ending December 2014 show 4,860 offences involving firearms (excluding air weapons) were recorded in England and Wales, a 1% decrease compared with the previous year (4,927, Tables 10a and 10b). The latest fall is smaller than year-on-year decreases seen in previous years, with a 7% decrease reported in the year ending September 2014 and a 6% decrease reported in the year ending June 2014.
Figure 6 shows the trend from 2002/03 and demonstrates that since the peak in 2005/06 there has been a substantial decrease (56%) in the number of offences involving firearms (excluding air weapons) recorded by the police. This reduction in offences involving firearms is in contrast to the 4% increase seen in overall violent crime since 2008/09. The renewed focus in improving compliance with the NCRS is likely to have contributed to the increase in overall police recorded violence. However, offences involving firearms are less likely to have been affected by these changes in recording practices than overall police recorded crime, the Focus on: Violent Crime and Sexual Offences 2013/14 contains more detail.
Figure 6: Trends in police recorded crimes in England and Wales involving the use of firearms other than air weapons, 2002/03 to year ending December 2014

Source: Police recorded crime, Home Office
Notes:
- Police recorded crime data are not designated as National Statistics.
Download this image Figure 6: Trends in police recorded crimes in England and Wales involving the use of firearms other than air weapons, 2002/03 to year ending December 2014
.png (14.5 kB) .xls (75.3 kB)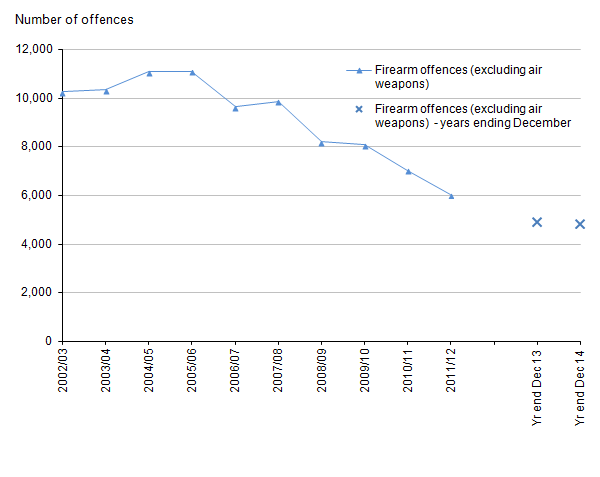
Table 10a: Police recorded offences involving firearms - number of offences [1,2,3]
| England and Wales | ||||
| Apr-03 to Mar-04 | Apr-08 to Mar-09 | Jan-13 to Dec-13 | Jan-14 to Dec-14 | |
| Firearm offences | 10,338 | 8,199 | 4,927 | 4,860 |
| Source: Police recorded crime, Home Office | ||||
| 1. Police recorded crime data are not designated as National Statistics. | ||||
| 2. Police recorded crime statistics based on data from all 43 forces in England and Wales (excluding the British Transport Police). | ||||
| 3. Firearms data are provisional. Excludes offences involving the use of air weapons and offences recorded by British Transport Police. Includes crimes recorded by police where a firearm has been fired, used as a blunt instrument against a person or used as a threat. | ||||
Download this table Table 10a: Police recorded offences involving firearms - number of offences [1,2,3]
.xls (74.2 kB)
Table 10b: Police recorded offences involving firearms - percentage change [1,2,3]
| England and Wales | |||
| Percentage change | |||
| January 2014 to December 2014 compared with: | |||
| Apr-03 to Mar-04 | Apr-08 to Mar-09 | Jan-13 to Dec-13 | |
| Firearm offences | -53 | -41 | -1 |
| Source: Police recorded crime, Home Office | |||
| 1. Police recorded crime data are not designated as National Statistics. | |||
| 2. Police recorded crime statistics based on data from all 43 forces in England and Wales (excluding the British Transport Police). | |||
| 3. Firearms data are provisional. Excludes offences involving the use of air weapons and offences recorded by British Transport Police. Includes crimes recorded by police where a firearm has been fired, used as a blunt instrument against a person or used as a threat. | |||
Download this table Table 10b: Police recorded offences involving firearms - percentage change [1,2,3]
.xls (75.3 kB)10. Theft offences
The Crime Survey for England and Wales (CSEW) and police recorded crime both measure various theft offences. Both series cover the headline categories of domestic burglary, vehicle-related theft, theft from the person, and bicycle theft. Theft of property from outside people’s homes (for example, garden furniture and tools) and theft of unattended property as measured by the CSEW are incorporated within the police recorded crime category “other theft”. Additionally, shoplifting offences, which are not included in the CSEW, are recorded by the police1.
There are substantial overlaps between theft offences in the two data series; however, the CSEW shows a larger volume as it includes incidents not reported to the police. Police recorded theft is broader, covering a wider variety of offences and victims; for example, police recorded theft includes theft against commercial victims and offences of handling stolen goods whereas the CSEW does not. Theft offences recorded by the police and the CSEW don’t include robbery as these are presented as a separate offence (as described in the ‘Robbery’ section).
Incidents of theft experienced by 10 to 15 year olds can be found in the ‘Crime experienced by children aged 10 to 15’ section of this bulletin.
Total theft offences (acquisitive crime) accounted for 59% of all incidents estimated by the CSEW (an estimated 4.1 million incidents) and almost half (47%) of all police recorded crime (1.8 million offences) in the year ending December 2014.
The long-term trend in CSEW theft reflects the long-term trend in total CSEW crime. Latest estimates point to a further decline, with total theft offences decreasing by 7% from the previous year (from 4.4 million to 4.1 million incidents, which is the lowest number recorded since the survey began in 1981) ( Appendix table A1 (486 Kb Excel sheet) ).
Since 2002/03, the number of police recorded theft offences has shown year-on-year decreases and is 46% lower in the year ending December 2014 than in 2003/04 (Figure 7). The latest figures show a 5% decrease compared with the previous year ( Appendix table A4 (486 Kb Excel sheet) ). As theft offences make up almost half of all police recorded crime, it is an important driver of the overall trend. However the decrease in theft has been offset by increases in other offence types which has resulted in a 2% increase in overall police recorded crime compared with the previous year.
Figure 7: Trends in police recorded theft offences in England and Wales, 2002/03 to year ending December 2014
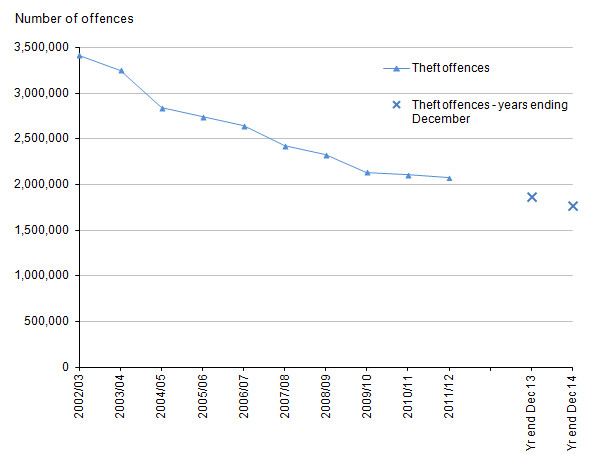
Source: Police recorded crime, Home Office
Notes:
- Police recorded crime data are not designated as National Statistics.
Download this image Figure 7: Trends in police recorded theft offences in England and Wales, 2002/03 to year ending December 2014
.png (13.6 kB) .xls (77.3 kB)
Further analysis on theft offences, based on the 2013/14 CSEW, was published on 27 November 2014 as part of Focus on: Property Crime, 2013/14.
Notes for theft offences
- Section 5.2 of the User Guide has more information.
11. Theft offences – burglary
The year ending December 2014 Crime Survey for England and Wales (CSEW) estimated 796,000 incidents of domestic burglary in the last year. There was no change compared with the previous year, the apparent 2% decrease was not statistically significant (Tables 11a and 11b). CSEW domestic burglary follows a similar pattern to that seen for overall crime, and despite some fluctuations the trend has remained fairly flat between 2004/05 and 2010/11 (Figure 8). Estimates for the year ending December 2014 are 39% lower than those in 2003/04 and 67% lower than those in the 1995 survey.
Figure 8: Trends in Crime Survey for England and Wales domestic burglary, 1981 to year ending December 2014
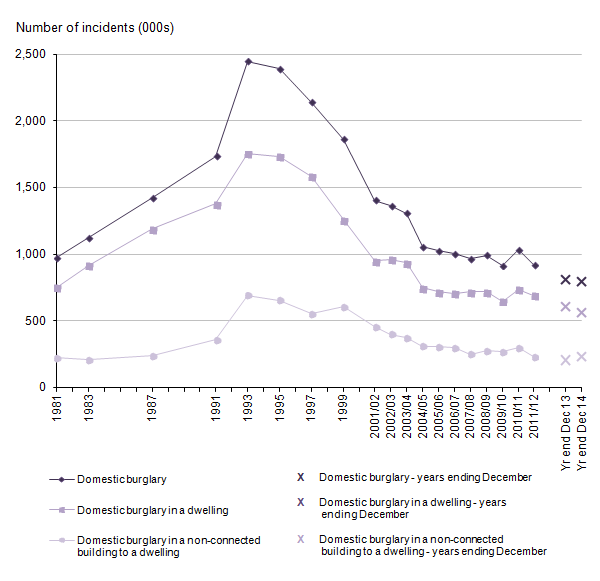
Source: Crime Survey for England and Wales, Office for National Statistics
Notes:
- The data on this chart refer to different time periods: a) 1981 to 1999 refer to crimes experienced in the calendar year (January to December) b) from 2001/02 onwards the estimates relate to crimes experienced in the 12 months before interview, based on interviews carried out in that financial year (April to March) c) the last two data points relate to interviews carried out in the rolling 12 month periods for the latest available two years (January to December).
- The numbers of incidents are derived by multiplying incidence rates by the population estimates for England and Wales.
Download this image Figure 8: Trends in Crime Survey for England and Wales domestic burglary, 1981 to year ending December 2014
.png (26.0 kB) .xls (78.3 kB)
The reduction is reflected in the percentage of households that had been victims of domestic burglary in the last year, with around 3 in 100 households being victims in the year ending December 2014 survey, compared with around 9 in 100 households in the 1995 survey. Households are now around 3 times less likely to be a victim of burglary than in 1995 (Tables 11a and 11b). It is widely accepted that improvements to home security has been an important factor in the reduction seen in domestic burglary offences; other potential factors are discussed in the ‘Existing theories on why property crime has fallen’ section of Focus on: Property Crime, 2013/14.
Over time, the sub-categories of CSEW ‘Domestic burglary in a dwelling’ and ‘Domestic burglary in a non-connected building to a dwelling’ have followed similar patterns to that of domestic burglary overall. In the year ending December 2014 there was an apparent 7% decrease in “domestic burglary in a dwelling” and an apparent 13% increase in “domestic burglary in a non-connected building to a dwelling” compared with the previous year, though these were not statistically significant.
Table 11a: CSEW burglary - number, rate and percentage of incidents [1]
| England and Wales | |||||
| Households | |||||
| Interviews from: | |||||
| Jan-95 to Dec-95 | Apr-03 to Mar-04 | Apr-08 to Mar-09 | Jan-13 to Dec-132 | Jan-14 to Dec-142 | |
| Number of incidents | Thousands | ||||
| Domestic burglary | 2,389 | 1,307 | 991 | 812 | 796 |
| Domestic burglary in a dwelling | 1,735 | 935 | 717 | 607 | 564 |
| Domestic burglary in a non-connected building to a dwelling | 654 | 372 | 275 | 205 | 232 |
| Incidence rate per 1,000 adults | |||||
| Domestic burglary | 115 | 59 | 43 | 34 | 33 |
| Domestic burglary in a dwelling | 84 | 42 | 31 | 26 | 23 |
| Domestic burglary in a non-connected building to a dwelling | 31 | 17 | 12 | 9 | 10 |
| Percentage of households that were victims once or more | Percentage | ||||
| Domestic burglary | 8.7 | 4.5 | 3.4 | 2.7 | 2.7 |
| Domestic burglary in a dwelling | 6.4 | 3.2 | 2.5 | 2.0 | 1.9 |
| Domestic burglary in a non-connected building to a dwelling | 2.6 | 1.4 | 1.0 | 0.7 | 0.8 |
| Unweighted base - number of households | 16,310 | 37,890 | 46,254 | 36,315 | 32,624 |
| Source: Crime Survey for England and Wales, Office for National Statistics | |||||
| Notes: | |||||
| 1. Appendix table A1, A2, A3 provide detailed footnotes and data for further years. | |||||
| 2. Base sizes for data since the years ending December 2013 and December 2014 are smaller than previous years, due to sample size reductions introduced in April 2012. | |||||
Download this table Table 11a: CSEW burglary - number, rate and percentage of incidents [1]
.xls (76.3 kB)
Table 11b: CSEW burglary - percentage change and statistical significance [1]
| England and Wales | |||||||||
| Households | |||||||||
| January 2014 to December 2014 compared with: | |||||||||
| Jan-95 to Dec-95 | Apr-03 to Mar-04 | Apr-08 to Mar-09 | Jan-13 to Dec-132 | ||||||
| Number of incidents | Percentage change and significance2 | ||||||||
| Domestic burglary | -67 | * | -39 | * | -20 | * | -2 | ||
| Domestic burglary in a dwelling | -68 | * | -40 | * | -21 | * | -7 | ||
| Domestic burglary in a non-connected building to a dwelling | -64 | * | -38 | * | -15 | * | 13 | ||
| Incidence rate per 1,000 adults | |||||||||
| Domestic burglary | -71 | * | -44 | * | -24 | * | -3 | ||
| Domestic burglary in a dwelling | -72 | * | -45 | * | -25 | * | -8 | ||
| Domestic burglary in a non-connected building to a dwelling | -69 | * | -43 | * | -19 | * | 12 | ||
| Percentage of households that were victims once or more | Percentage change and significance2,3 | ||||||||
| Domestic burglary | -6.0 | * | -1.8 | * | -0.7 | * | 0.0 | ||
| Domestic burglary in a dwelling | -4.4 | * | -1.3 | * | -0.5 | * | -0.1 | ||
| Domestic burglary in a non-connected building to a dwelling | -1.8 | * | -0.6 | * | -0.2 | * | 0.1 | ||
| Source: Crime Survey for England and Wales, Office for National Statistics | |||||||||
| Notes: | |||||||||
| 1. Appendix table A1, A2, A3 provide detailed footnotes and data for further years. | |||||||||
| 2. Statistically significant change at the 5% level is indicated by an asterisk. | |||||||||
| 3. The percentage point change presented in the tables may differ from subtraction of the 2 percentages due to rounding. | |||||||||
Download this table Table 11b: CSEW burglary - percentage change and statistical significance [1]
.xls (72.7 kB)The Crime-recording: making the victim count report, published by Her Majesty’s Inspectorate of Constabulary (HMIC), found that nationally, an estimated 11% of burglary offences that should have been recorded as crimes were not; this level of under-recording is better than the national average of 19%. The ‘Accuracy of the statistics’ section has more information.
The police recorded crime statistics measure both domestic burglaries (for example, those against inhabited dwellings) and non-domestic burglaries (for example, those against businesses)1. When compared with the previous year, domestic burglary decreased by 8% (from 217,486 to 200,785 offences) while non-domestic burglary decreased by 5% (from 229,749 to 218,565 offences) in the year ending December 2014 (Tables 12a and 12b). The latest level of burglary recorded by the police is around half the level recorded in 2003/04 (49% lower).
Table 12a: Police recorded burglary - number and rate of offences [1,2,3]
| England and Wales | ||||
| Apr-03 to Mar-04 | Apr-08 to Mar-09 | Jan-13 to Dec-13 | Jan-14 to Dec-14 | |
| Burglary offences | 820,013 | 581,584 | 447,235 | 419,350 |
| Domestic burglary | 402,345 | 284,431 | 217,486 | 200,785 |
| Non-domestic burglary | 417,668 | 297,153 | 229,749 | 218,565 |
| Burglary rate per 1,000 population | 16 | 11 | 8 | 7 |
| Source: Police recorded crime, Home Office | ||||
| Notes: | ||||
| 1. Police recorded crime data are not designated as National Statistics. | ||||
| 2. Police recorded crime statistics based on data from all 44 forces in England and Wales (including the British Transport Police). | ||||
| 3. Appendix table A4 provides detailed footnotes and data for further years. | ||||
Download this table Table 12a: Police recorded burglary - number and rate of offences [1,2,3]
.xls (82.4 kB)
Table 12b: Police recorded burglary - percentage change [1,2,3]
| England and Wales | |||
| Percentage change | |||
| January 2014 to December 2014 compared with: | |||
| Apr-03 to Mar-04 | Apr-08 to Mar-09 | Jan-13 to Dec-13 | |
| Burglary offences | -49 | -28 | -6 |
| Domestic burglary | -50 | -29 | -8 |
| Non-domestic burglary | -48 | -26 | -5 |
| Source: Police recorded crime, Home Office | |||
| Notes: | |||
| 1. Police recorded crime data are not designated as National Statistics. | |||
| 2. Police recorded crime statistics based on data from all 44 forces in England and Wales (including the British Transport Police). | |||
| 3. Appendix table A4 provides detailed footnotes and data for further years. | |||
Download this table Table 12b: Police recorded burglary - percentage change [1,2,3]
.xls (82.4 kB)Notes for theft offences – burglary
- Non-domestic burglary covers burglary in a building other than a dwelling, and includes burglaries of sheds and outhouses which do not have an entrance to the home. Section 5.2 of the User Guide has more details regarding this crime type.
12. Theft offences – vehicle
The Crime Survey for England and Wales (CSEW) covers offences against vehicles owned by any member of the household interviewed (including company cars). Estimates of CSEW vehicle-related theft for the year ending December 2014 showed an apparent 6% decrease compared with the previous year, though this decrease was not statistically significant (Table 13a and 13b)1.
Over the longer term, the CSEW indicates a consistent downward trend in levels of vehicle-related theft, with the latest estimates being 79% lower than in 1995. As shown in Figure 9, the rate of reduction in vehicle offences since the mid-1990s has been striking. It is widely accepted that improvements to vehicle security has been an important factor in the reduction seen in vehicle offences; other potential factors are discussed in the ‘Existing theories on why property crime has fallen’ section of Focus on: Property Crime, 2013/14.
There were an estimated 906,000 vehicle-related thefts in the year ending December 2014 survey, the lowest estimate since the survey began in 1981. Vehicle-owning households were around 5 times less likely to become a victim of vehicle-related theft in the year ending December 2014 than in 1995. Around 4 in 100 vehicle-owning households were victims in the year ending December 2014 CSEW compared with around 20 in 100 households in the 1995 CSEW (Table 13a).
Figure 9: Trends in Crime Survey for England and Wales vehicle-related theft, 1981 to year ending December 2014

Source: Crime Survey for England and Wales, Office for National Statistics
Notes:
- The data on this chart refer to different time periods: a) 1981 to 1999 refer to crimes experienced in the calendar year (January to December) b) from 2001/02 onwards the estimates relate to crimes experienced in the 12 months before interview, based on interviews carried out in that financial year (April to March) c) the last two data points relate to interviews carried out in the rolling 12 month periods for the latest available two years (January to December).
- The numbers of incidents are derived by multiplying incidence rates by the population estimates for England and Wales.
Download this image Figure 9: Trends in Crime Survey for England and Wales vehicle-related theft, 1981 to year ending December 2014
.png (15.2 kB) .xls (78.8 kB)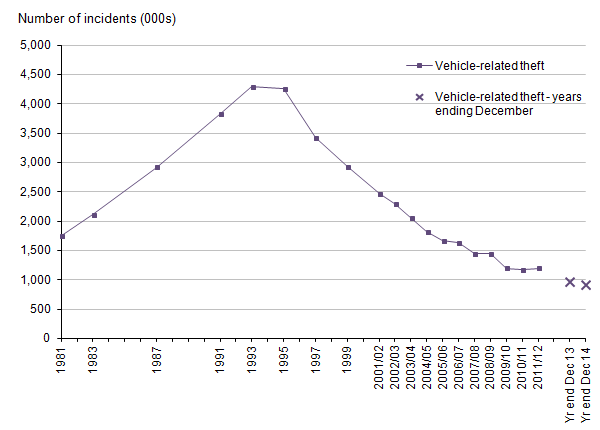
Table 13a: CSEW vehicle offences - number, rate and percentage of incidents [1]
| England and Wales | |||||
| Vehicle-owning households | |||||
| Interviews from: | |||||
| Jan-95 to Dec-95 | Apr-03 to Mar-04 | Apr-08 to Mar-09 | Jan-13 to Dec-132 | Jan-14 to Dec-142 | |
| Thousands | |||||
| Number of vehicle-related theft incidents | 4,266 | 2,063 | 1,447 | 962 | 906 |
| Vehicle-related theft incidence rate per 1,000 vehicle-owning households | 280 | 123 | 80 | 52 | 49 |
| % | |||||
| Percentage of vehicle-owning households that were victims of vehicle-related theft once or more | 19.7 | 9.6 | 6.4 | 4.4 | 4.1 |
| Unweighted base - vehicle owners | 11,721 | 29,457 | 36,882 | 28,529 | 25,712 |
| Source: Crime Survey for England and Wales, Office for National Statistics | |||||
| Notes: | |||||
| 1. Appendix table A1, A2, A3 provide detailed footnotes and data for further years. | |||||
| 2. Base sizes for data since the years ending December 2013 and December 2014 are smaller than previous years, due to sample size reductions introduced in April 2012. | |||||
Download this table Table 13a: CSEW vehicle offences - number, rate and percentage of incidents [1]
.xls (77.3 kB)
Table 13b: CSEW vehicle offences - percentage change and statistical significance [1]
| England and Wales | ||||||||
| Vehicle-owning households | ||||||||
| January 2014 to December 2014 compared with: | ||||||||
| Jan-95 to Dec-95 | Apr-03 to Mar-04 | Apr-08 to Mar-09 | Jan-13 to Dec-13 | |||||
| Percentage change and significance2 | ||||||||
| Number of vehicle-related theft incidents | -79 | * | -56 | * | -37 | * | -6 | |
| Vehicle-related theft incidence rate per 1,000 vehicle-owning households | -83 | * | -60 | * | -39 | * | -7 | |
| Percentage point change and significance2,3 | ||||||||
| Percentage of vehicle-owning households that were victims of vehicle-related theft once or more | -15.7 | * | -5.5 | * | -2.4 | * | -0.3 | |
| Source: Crime Survey for England and Wales, Office for National Statistics | ||||||||
| 1. Appendix table A1, A2, A3 provide detailed footnotes and data for further years. | ||||||||
| 2. Statistically significant change at the 5% level is indicated by an asterisk. | ||||||||
| 3. The percentage point change presented in the tables may differ from subtraction of the 2 percentages due to rounding. | ||||||||
Download this table Table 13b: CSEW vehicle offences - percentage change and statistical significance [1]
.xls (82.9 kB)The police recorded crime category of vehicle offences covers both private and commercial vehicles and shows a fall of 7% in the year ending December 2014, compared with the previous year (Tables 14a and 14b). This follows substantial decreases in this offence group, with a fall of 64% compared with 2003/04, similar to the trend found in the CSEW. The most recent data show that 2 of the 3 categories of police recorded vehicle offences have continued to fall, including theft of a motor vehicle, which fell by 1% in the year ending December 2014, compared with the previous year (Table 14b). Vehicle interference has increased by 56% (from 20,872 to 32,472) in the year ending December 2014 compared with the previous year. This increase is likely to be the result of a change in the guidance within the HOCR with respect to interpreting the motive of the offender in the case of vehicle interference. This change was designed to reduce the burden of recording previously involved in determining which crime category to record the incident within. This is likely to have led to offences that previously might have been recorded as attempted theft of, or from, a vehicle or criminal damage to a vehicle now being recorded as vehicle interference where the motive of the offender was not clear.
The reductions in vehicle-related theft indicated by the CSEW and police recorded crime are in contrast to the number of motor vehicles licensed in Great Britain, which has increased by 40%, from 25.4 million at the end of 1995 to 35.6 million at the end of 2014 (Vehicle Licensing Statistics, 2014)2.
Table 14a: Police recorded vehicle offences - number and rate of offences [1,2,3]
| England and Wales | ||||
| Apr-03 to Mar-04 | Apr-08 to Mar-09 | Jan-13 to Dec-13 | Jan-14 to Dec-14 | |
| Vehicle offences4 | 985,006 | 591,853 | 378,130 | 353,308 |
| Theft of a motor vehicle | 291,858 | 147,238 | 75,658 | 74,985 |
| Theft from a vehicle | 603,256 | 396,976 | 281,600 | 245,851 |
| Vehicle interference | 89,892 | 47,639 | 20,872 | 32,472 |
| Vehicle offences rate per 1,000 population | 19 | 11 | 7 | 6 |
| Source: Police recorded crime, Home Office | ||||
| 1. Police recorded crime data are not designated as National Statistics. | ||||
| 2. Police recorded crime statistics based on data from all 44 forces in England and Wales (including the British Transport Police). | ||||
| 3. Appendix table A4 provides detailed footnotes and data for further years. | ||||
| 4. Includes theft of motor vehicle (including aggravated vehicle taking), theft from a vehicle, and interfering with a motor vehicle. | ||||
Download this table Table 14a: Police recorded vehicle offences - number and rate of offences [1,2,3]
.xls (81.9 kB)
Table 14b: Police recorded vehicle offences - percentage change [1,2,3]
| England and Wales | |||
| Percentage change | |||
| January 2014 to December 2014 compared with: | |||
| Apr-03 to Mar-04 | Apr-08 to Mar-09 | Jan-13 to Dec-13 | |
| Vehicle offences4 | -64 | -40 | -7 |
| Theft of a motor vehicle | -74 | -49 | -1 |
| Theft from a vehicle | -59 | -38 | -13 |
| Vehicle interference | -64 | -32 | 56 |
| Source: Police recorded crime, Home Office | |||
| 1. Police recorded crime data are not designated as National Statistics. | |||
| 2. Police recorded crime statistics based on data from all 44 forces in England and Wales (including the British Transport Police). | |||
| 3. Appendix table A4 provides detailed footnotes and data for further years. | |||
| 4. Includes theft of motor vehicle (including aggravated vehicle taking), theft from a vehicle, and interfering with a motor vehicle. | |||
Download this table Table 14b: Police recorded vehicle offences - percentage change [1,2,3]
.xls (82.4 kB)Notes for theft offences – vehicle
Section 5.2 of the User Guide has more details regarding this crime type.
Based on the total number of licensed vehicles (including both private and commercial vehicles) in England, Scotland and Wales taken from the Driver and Vehicle Licensing Agency (DVLA) database.
13. Theft offences – other theft of property
In addition to burglary and vehicle-related thefts, the Crime Survey for England and Wales (CSEW) and police recorded crime both measure other theft of property, although they cover slightly different offences. In the CSEW this comprises: theft from the person; other theft of personal property; bicycle theft; and other household theft. In police recorded crime there are categories for: theft from the person; bicycle theft; shoplifting; and all other theft offences. There are further offence breakdowns available for all other theft offences listed in Appendix table A4 (486 Kb Excel sheet) .
Theft from the person – CSEW and police recorded crime
Theft from the person involves offences where there is theft of property, while the property is being carried by, or on the person of, the victim. These include snatch thefts (where an element of force may be used to snatch the property away) and stealth thefts (where the victim is unaware of the offence being committed, for example, pick-pocketing). Unlike robbery, these offences do not involve violence or threats to the victim.
In the year ending December 2014 CSEW, of all 478,000 theft from the person offence the majority (48%, 230,000) were made up of stealth thefts; there is more information in Appendix table A1 (486 Kb Excel sheet) . Numbers of snatch thefts were much smaller, accounting for 12% of all theft from the person offences, while attempted snatch and stealth thefts made up the remaining 40%.
The apparent 15% decrease in theft from the person based on interviews in the year ending December 2014 was not statistically significant compared with the previous year (Tables 15a and 15b). Estimates of the volume of theft from the person offences are low and subject to fluctuations from year-to-year in the survey. The CSEW shows an unusually high estimate measured by the 2008/09 survey when there was a significant increase, followed by a significant decrease in 2009/10 (Figure 10). Other than this, CSEW estimates of theft from the person have remained fairly flat.
The police recorded crime category theft from the person accounts for around 2% of overall police recorded crime. Latest figures showed a 23% decrease in the year ending December 2014 compared with the previous year (Tables 16a and 16b). This is in contrast to recent trends, where these offences have been increasing between 2010/11 and 2012/13, which is thought to be driven by theft of smartphones. The latest decrease is driven by a large fall in theft from the person offences in the first 3 quarters – January to September 2014. This may, in part, be explained by improvements to mobile security and theft prevention1.
Further analysis of theft from the person figures by police force area shows a mixed picture, with a small number of forces continuing to show increases while most show decreases. However, as with robbery, theft from the person offences are concentrated in the metropolitan areas, with 39% occurring in the Metropolitan Police force area alone in the year ending December 2014 ( Table P1 (154 Kb Excel sheet) ). The previous overall increases were largely driven by what was happening in London, where theft of smartphones and other portable devices were thought to be behind some of this rise2. The latest figures for the Metropolitan Police force area show a decrease of 31% compared with the previous year ( Table P2 (154 Kb Excel sheet) ). In addition, the British Transport Police (BTP), who cover crimes that occur on railways and on railway platforms and stations, accounted for 7% of the total thefts from the person offences in the year ending December 2014. BTP showed a 28% decrease in theft from the person offences compared with the previous year.
Other household theft – CSEW
This offence group consists of items stolen from outside the victim’s home, and thefts in the victim’s dwelling by someone entitled to be there, for example a tradesperson3. Overall, the year ending December 2014 survey estimated that there were 780,000 incidents of other household theft (Tables 15a and 15b), making up 11% of all CSEW crime.
The apparent 3% decrease in other household theft based on interviews in the year ending December 2014 compared with the previous year was not statistically significant. The latest estimates show levels of other household theft were similar to those seen in the 2007/08 survey, following a period of year-on-year increases between 2007/08 and 2011/12. The current decrease, combined with decreases seen between 1995 and 2007/08, means that the latest figure is now 50% lower than in the 1995 survey (Figure 10).
The large majority of other household thefts are accounted for by theft from outside a dwelling (91%). Generally these incidents are opportunistic in nature involving theft of garden furniture or household items or furniture taken from outside people’s homes4. The latest estimate for theft from a dwelling is 67% lower than the 1995 survey estimate ( Appendix table A1 (486 Kb Excel sheet) ).
Figure 10: Trends in Crime Survey for England and Wales other household theft and theft from the person, 1981 to year ending December 2014

Source: Crime Survey for England and Wales
Notes:
- The data on this chart refer to different time periods: a) 1981 to 1999 refer to crimes experienced in the calendar year (January to December) b) from 2001/02 onwards the estimates relate to crimes experienced in the 12 months before interview, based on interviews carried out in that financial year (April to March) c) the last two data points relate to interviews carried out in the rolling 12 month periods for the latest available two years (January to December).
- The numbers of incidents are derived by multiplying incidence rates by the population estimates for England and Wales.
Download this image Figure 10: Trends in Crime Survey for England and Wales other household theft and theft from the person, 1981 to year ending December 2014
.png (18.0 kB) .xls (76.8 kB)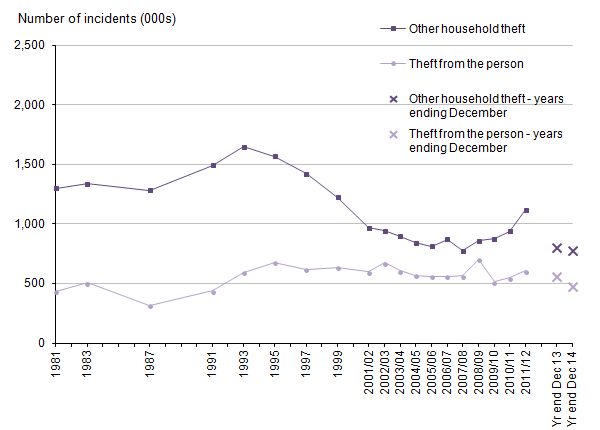
Other theft of personal property – CSEW
Other theft of personal property offences are those which involve items stolen from victims while away from the home, but not being carried on the person (such as theft of unattended property in pubs, restaurants, entertainment venues or workplaces). The CSEW estimates that there were around 768,000 incidents of other theft of personal property in the survey year ending December 2014, a statistically significant decrease of 17% compared with the previous year (Table 15b). Looking at the longer term trend, other theft of personal property saw marked declines between the mid-1990s and the 2004/05 survey after which estimates fluctuated slightly but generally stayed around 1.0 million offences per year. Since the 2012/13 survey estimates have shown small but steady declines, however the latest year-on-year fall was more pronounced than that seen in recent years. Thus the latest estimate is under half the level seen in the 1995 survey (63% lower).
Bicycle theft – CSEW and police recorded crime
The apparent 6% increase in bicycle theft, compared with the previous survey year, was not statistically significant (Tables 15a and 15b). The year ending December 2014 CSEW indicates that around 3% of bicycle owning households were victims of bicycle theft in the previous 12 months, down from 6% in the 1995 survey.This is one of the lower volume CSEW offence groups and can show large fluctuations from year-to-year. Appendix table A1 (486 Kb Excel sheet) shows that, like other household theft, these incidents showed a marked decline between 1995 and the 1999 survey, with both small increases and decreases thereafter. The variability means that short term trends have to be interpreted with caution.
Bicycle thefts recorded by the police showed a small decrease of 2% in the year ending December 2014 compared with the previous year (Tables 16a and 16b), remaining at a similar level seen since 2011/12, and slightly lower than levels seen in the years prior to this. The current level (94,251 offences) is the lowest since the National Crime Recording Standard (NCRS) was first introduced in 2002/03.
Shoplifting – police recorded crime
Shoplifting accounted for 9% of all police recorded crime in the year ending December 2014. The police recorded 325,504 shoplifting offences in this period, a 3% increase compared with the previous year and the highest volume since the introduction of the NCRS in 2002/03. The longer term trend in shoplifting recorded by the police is different from that seen for other theft offences. While most theft offences saw steady declines over much of the last decade, levels of recorded shoplifting showed comparatively little change over this time.
Across England and Wales there were 8,457 more shoplifting offences in the year ending December 2014 when compared with the previous year. There were reported increases in 25 of the 43 territorial police force areas in the year ending December 2014 ( Table P2 (154 Kb Excel sheet) ).
The 2014 Commercial Victimisation Survey provides an alternative measure of shoplifting (referred to in the survey as ‘theft by customers’) which includes crimes not reported to the police as well as those that have been. Latest results from the 2014 survey, published at the same time as this bulletin, provide new evidence to suggest that the rise in shoplifting recorded by the police may not reflect an increase in the actual level of such crimes. Compared with the previous year, the 2014 CVS showed no change in the level of theft by customers (the apparent 29% reduction was not statistically significant5, being based on a relatively small sample of between 1000 and 2000 premises in the wholesale and retail sector). However, the latest estimates were significantly down (36%) compared with the 2012 survey.
The apparent inconsistency between trends in shoplifting recorded by the police and the CVS may reflect an increase in reporting rates by businesses. While the changes were not statistically significant, the estimated proportion of shoplifting incidents that were reported to the police was 44% in 2014 compared with 42% in 2013 and 41% in 2012. The British Retail Consortium (BRC) have also reported6 that some retailers are adopting new policies (like those used by the Cooperative supermarket chain7) leading to a greater proportion of shoplifting offences being reported.
Additionally, increased reporting is consistent with findings from a separate BRC survey which showed that while their members had experienced decreased levels of shoplifting in 2013/14 compared with 2012/13, the average value of losses experienced had risen. While it is still possible that there have been some genuine rises in the incidence of shoplifting the balance of evidence suggests that the increase in offences recorded by the police could reflect a change in reporting behaviour.
All other theft offences – police recorded crime
The remainder of police recorded theft offences fall into the category ’All other theft offences‘, which include offences such as blackmail, theft by an employee, and making off without payment (for example, driving away from a petrol station without paying). Within this overall category, there is also an ‘Other theft’ offence sub-category, which comprises mostly of the theft of unattended items (including both personal property such as wallets or phones, and property from outside peoples’ homes, such as garden furniture). ‘Other theft’ accounts for 3-quarters (73%) of the overall “all other theft offences” category ( Appendix table A4 (486 Kb Excel sheet) ).
The most recent police recorded data showed a 4% decrease in all other theft offences, with 497,260 offences in the year ending December 2014 compared with 518,761 offences in the previous year. This decrease is in contrast with a recent upward trend in all other theft offences between 2009/10 and 2011/12 ( Appendix table A4 (486 Kb Excel sheet) ), following a longer downward trend between 2003/04 and 2009/10 (Figure 11).
In the year ending December 2014 the police recorded 58,833 making off without payment offences, which was a 16% increase compared with the previous year. Previously there had been a steep decline in this particular offence) ( Appendix table A4 (486 Kb Excel sheet) ).
Figure 11: Trends in police recorded all other theft offences in England and Wales, 2002/03 to year ending December 2014
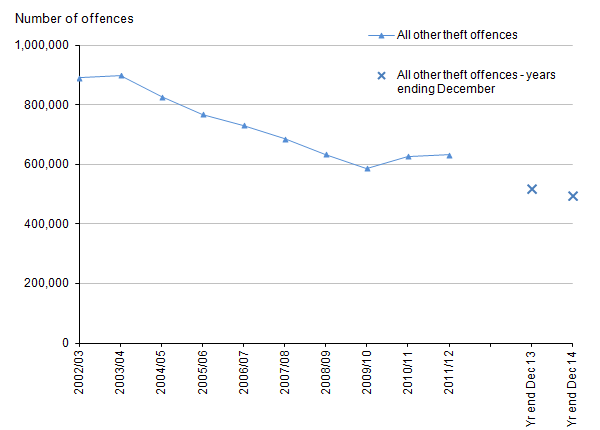
Source: Police recorded crime, Home Office
Notes:
- Police recorded crime data are not designated as National Statistics.
Download this image Figure 11: Trends in police recorded all other theft offences in England and Wales, 2002/03 to year ending December 2014
.png (13.0 kB) .xls (77.3 kB)
As well as theft of unattended items, the police recorded “other theft” subcategory also includes crimes against organisations which are not covered by the CSEW, such as theft of metal or industrial equipment from strategic infrastructure. ‘Other theft’ offences saw a 8% decrease for the year ending December 2014 compared with the previous year ( Appendix table A4 (486 Kb Excel sheet) ). This follows a 13% increase between 2009/10 and 2011/12. This is likely to have been caused, in part, by a surge in metal theft over this period, which corresponds with a spike in metal prices. Evidence suggests that such offences are decreasing and can be linked to the new metal theft legislation. The legislation came into force in May 2013, which increased fines for offences under the Scrap Metal Dealers Act 1964, and introduced a new offence for dealers of paying for scrap metal in cash. The Home Office publication Metal theft, England and Wales, financial year ending March 2013 and Chapter 2 of Focus on: Property Crime, 2013/14 have further information on metal theft.
Table 15a: CSEW other theft of property - number, rate and percentage of incidents [1]
| England and Wales | |||||
| Adults aged 16 and over/households | |||||
| Interviews from: | |||||
| Jan-95 to Dec-95 | Apr-03 to Mar-04 | Apr-08 to Mar-09 | Jan-13 to Dec-132 | Jan-14 to Dec-142 | |
| Number of incidents | Thousands | ||||
| Theft from the person | 680 | 607 | 705 | 560 | 478 |
| Other theft of personal property | 2,069 | 1,276 | 1,069 | 928 | 768 |
| Other household theft | 1,570 | 897 | 862 | 803 | 780 |
| Bicycle theft | 660 | 362 | 515 | 373 | 395 |
| Incidence rate per 1,000 adults/households | |||||
| Theft from the person | 17 | 15 | 16 | 12 | 10 |
| Other theft of personal property | 51 | 31 | 25 | 21 | 17 |
| Other household theft | 76 | 41 | 38 | 34 | 32 |
| Bicycle theft: bicycle-owning households | 71 | 39 | 51 | 30 | 31 |
| Percentage of adults/households who were victims once or more | % | ||||
| Theft from the person | 1.6 | 1.3 | 1.4 | 1.1 | 1.0 |
| Other theft of personal property | 4.1 | 2.6 | 2.1 | 1.8 | 1.5 |
| Unweighted base - number of adults | 16,337 | 37,891 | 46,220 | 36,354 | 32,666 |
| Other household theft | 5.1 | 3.0 | 2.8 | 2.8 | 2.6 |
| Unweighted base - number of households | 16,310 | 37,890 | 46,254 | 36,315 | 32,624 |
| Bicycle theft: bicycle-owning households | 6.1 | 3.4 | 4.4 | 2.7 | 2.7 |
| Unweighted base - bicycle owners | 6,863 | 16,070 | 20,636 | 17,354 | 15,551 |
| Source: Crime Survey for England and Wales, Office for National Statistics | |||||
| Notes: | |||||
| 1. Appendix table A1, A2, A3 provide detailed footnotes and data for further years. | |||||
| 2. Base sizes for data since the years ending December 2013 and December 2014 are smaller than previous years, due to sample size reductions introduced in April 2012. | |||||
Download this table Table 15a: CSEW other theft of property - number, rate and percentage of incidents [1]
.xls (78.3 kB)
Table 15b: CSEW other theft of property - percentage change and statistical significance [1]
| England and Wales | ||||||||
| Adults aged 16 and over/households | ||||||||
| January 2014 to December 2014 compared with: | ||||||||
| Jan-95 to Dec-95 | Apr-03 to Mar-04 | Apr-08 to Mar-09 | Jan-13 to Dec-13 | |||||
| Number of incidents | Percentage change and significance2 | |||||||
| Theft from the person | -30 | * | -21 | * | -32 | * | -15 | |
| Other theft of personal property | -63 | * | -40 | * | -28 | * | -17 | * |
| Other household theft | -50 | * | -13 | * | -10 | * | -3 | |
| Bicycle theft | -40 | * | 9 | -23 | * | 6 | ||
| Incidence rate per 1,000 adults/households | ||||||||
| Theft from the person | -37 | * | -28 | * | -35 | * | -15 | |
| Other theft of personal property | -67 | * | -45 | * | -32 | * | -18 | * |
| Other household theft | -57 | * | -20 | * | -14 | * | -4 | |
| Bicycle theft: bicycle-owning households | -56 | * | -19 | * | -39 | * | 4 | |
| Percentage of adults/households who were victims once or more | Percentage point change and significance2,3 | |||||||
| Theft from the person | -0.7 | * | -0.4 | * | -0.5 | * | -0.2 | |
| Other theft of personal property | -2.6 | * | -1.1 | * | -0.6 | * | -0.3 | * |
| Other household theft | -2.6 | * | -0.4 | * | -0.2 | -0.2 | ||
| Bicycle theft: bicycle-owning households | -3.4 | * | -0.7 | * | -1.7 | * | -0.0 | |
| Source: Crime Survey for England and Wales, Office for National Statistics | ||||||||
| Notes: | ||||||||
| 1. Appendix table A1, A2, A3 provide detailed footnotes and data for further years. | ||||||||
| 2. Statistically significant change at the 5% level is indicated by an asterisk. | ||||||||
| 3. The percentage point change presented in the tables may differ from subtraction of the 2 percentages due to rounding. | ||||||||
Download this table Table 15b: CSEW other theft of property - percentage change and statistical significance [1]
.xls (79.4 kB)
Table 16a: Police recorded other theft - number and rate of offences [1,2,3]
| England and Wales | ||||
| Apr-03 to Mar-04 | Apr-08 to Mar-09 | Jan-13 to Dec-13 | Jan-14 to Dec-14 | |
| Theft from the person | 137,154 | 89,652 | 104,725 | 80,728 |
| Bicycle theft | 105,467 | 104,169 | 96,662 | 94,251 |
| Shoplifting | 303,235 | 320,739 | 317,047 | 325,504 |
| All other theft offences4,5 | 898,772 | 633,583 | 518,761 | 497,260 |
| Rate per 1,000 population | ||||
| Theft from the person | 3 | 2 | 2 | 1 |
| Bicycle theft | 2 | 2 | 2 | 2 |
| Shoplifting | 6 | 6 | 6 | 6 |
| All other theft offences4,5 | 17 | 12 | 9 | 9 |
| Source: Police recorded crime, Home Office | ||||
| Notes: | ||||
| 1. Police recorded crime data are not designated as National Statistics. | ||||
| 2. Police recorded crime statistics based on data from all 44 forces in England and Wales (including the British Transport Police). | ||||
| 3. Appendix table A4 provides detailed footnotes and data for further years. | ||||
| 4. All other theft offences now includes all 'making off without payment' offences recorded since 2002/03. Making off without payment was previously included within the fraud offence group, but following a change in the classification for 2013/14, this change has been applied to previous years of data to give a consistent time series. | ||||
| 5. For full range of offences included in all other theft see Appendix table A4. | ||||
Download this table Table 16a: Police recorded other theft - number and rate of offences [1,2,3]
.xls (83.5 kB)
Table 16b: Police recorded other theft - percentage change [1,2,3]
| England and Wales | |||
| Percentage change | |||
| January 2014 to December 2014 compared with: | |||
| Apr-03 to Mar-04 | Apr-08 to Mar-09 | Jan-13 to Dec-13 | |
| Theft from the person | -41 | -10 | -23 |
| Bicycle theft | -11 | -10 | -2 |
| Shoplifting | 7 | 1 | 3 |
| All other theft offences4,5 | -45 | -22 | -4 |
| Source: Police recorded crime, Home Office | |||
| Notes: | |||
| 1. Police recorded crime data are not designated as National Statistics. | |||
| 2. Police recorded crime statistics based on data from all 44 forces in England and Wales (including the British Transport Police). | |||
| 3. Appendix table A4 provides detailed footnotes and data for further years. | |||
| 4. All other theft offences now includes all 'making off without payment' offences recorded since 2002/03. Making off without payment was previously included within the fraud offence group, but following a change in the classification for 2013/14, this change has been applied to previous years of data to give a consistent time series. | |||
| 5. For full range of offences included in all other theft see Appendix table A4. | |||
Download this table Table 16b: Police recorded other theft - percentage change [1,2,3]
.xls (76.3 kB)Notes for theft offences – other theft of property
The Home Office report Reducing mobile phone theft and improving security has more information.
Based on figures provided by the Metropolitan Police in relation to a freedom of information (FOI) request reported by London Evening Standard – 4 April 2013.
Section 5.2 and Appendix 2 of the User Guide have more details on the offences that constitute CSEW other household theft.
The Nature of Crime tables in Focus on: Property Crime, 2013/14 have more details.
Percentage changes have been calculated based on rates of ‘theft by customers’ per 1000 wholesale and retail premises.
Referred to on page 19 of the British Retail Consortium Retail Crime Survey 2014
As reported in the Nottingham Post, 18 December 2013.
14. Criminal damage
Based on the Crime Survey for England and Wales (CSEW) in the year ending December 2014, there were around 1.4 million incidents of criminal damage of personal and household property. The apparent 8% decrease compared with the previous survey year was not statistically significant (Tables 17a and 17b). Figure 12 shows the long-term trend for criminal damage, which has followed a slightly different pattern compared with most other CSEW crime groups. Criminal damage peaked in the 1993 survey with 3.4 million incidents followed by a series of modest falls (when compared with other CSEW offence types) until the 2003/04 survey (2.4 million offences). There was then a short upward trend until the 2006/07 CSEW (2.9 million offences), after which there were falls to its current level, the lowest since the survey began.
Figure 12: Trends in Crime Survey for England and Wales criminal damage, 1981 to year ending December 2014
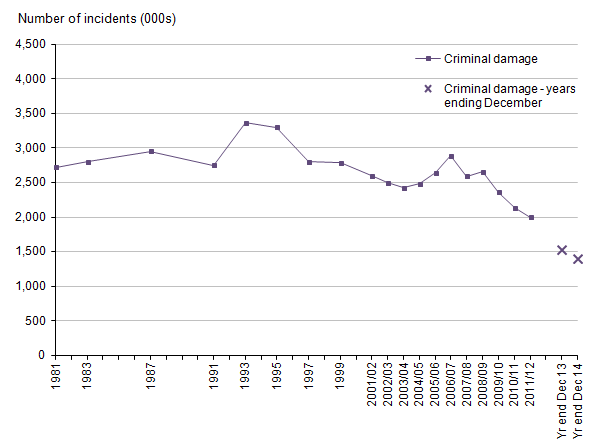
Source: Crime Survey for England and Wales, Office for National Statistics
Notes:
- The data on this chart refer to different time periods: a) 1981 to 1999 refer to crimes experienced in the calendar year (January to December) b) from 2001/02 onwards the estimates relate to crimes experienced in the 12 months before interview, based on interviews carried out in that financial year (April to March) c) the last two data points relate to interviews carried out in the rolling 12 month periods for the latest available two years (January to December).
- The numbers of incidents are derived by multiplying incidence rates by the population estimates for England and Wales.
Download this image Figure 12: Trends in Crime Survey for England and Wales criminal damage, 1981 to year ending December 2014
.png (14.6 kB) .xls (76.8 kB)
Tables 17a and 17b highlight the recent downward trend in this offence group. There were statistically significant decreases when comparing the current figure with those from 5 and 10 years ago. This trend is also reflected in the decline in percentage of households victimised; around 4 in every 100 households were victims of criminal damage in the year ending December 2014, compared with around 10 in every 100 households in 1995.
Table 17a: CSEW criminal damage - number, rate and percentage of incidents [1]
| England and Wales | ||||||
| Households | ||||||
| Interviews from: | ||||||
| Jan-95 to Dec-95 | Apr-03 to Mar-04 | Apr-08 to Mar-09 | Jan-13 to Dec-132 | Jan-14 to Dec-142 | ||
| Number of incidents | Thousands | |||||
| Criminal damage | 3,300 | 2,421 | 2,656 | 1,524 | 1,404 | |
| Criminal damage to a vehicle | 1,790 | 1,403 | 1,766 | 1,050 | 935 | |
| Arson and other criminal damage | 1,510 | 1,018 | 890 | 474 | 469 | |
| Incidence rate per 1,000 households | ||||||
| Criminal damage | 159 | 110 | 116 | 64 | 58 | |
| Criminal damage to a vehicle | 86 | 64 | 77 | 44 | 39 | |
| Arson and other criminal damage | 73 | 46 | 39 | 20 | 20 | |
| Percentage of households that were victims once or more | % | |||||
| Criminal damage | 10.1 | 7.1 | 7.6 | 4.4 | 3.9 | |
| Criminal damage to a vehicle | 6.2 | 4.5 | 5.4 | 3.2 | 2.8 | |
| Arson and other criminal damage | 4.3 | 2.8 | 2.5 | 1.3 | 1.3 | |
| Unweighted base - number of households | 16,310 | 37,890 | 46,254 | 36,354 | 32,666 | |
| Source: Crime Survey for England and Wales, Office for National Statistics | ||||||
| Notes: | ||||||
| 1. Appendix table A1, A2, A3 provide detailed footnotes and data for further years. | ||||||
| 2. Base sizes for data since the years ending December 2013 and December 2014 are smaller than previous years, due to sample size reductions introduced in April 2012. | ||||||
Download this table Table 17a: CSEW criminal damage - number, rate and percentage of incidents [1]
.xls (78.3 kB)
Table 17b: CSEW criminal damage - percentage change and statistical significance [1]
| England and Wales | |||||||||
| Households | |||||||||
| January 2014 to December 2014 compared with: | |||||||||
| Jan-95 to Dec-95 | Apr-03 to Mar-04 | Apr-08 to Mar-09 | Jan-13 to Dec-13 | ||||||
| Number of incidents | Percentage change and significance2 | ||||||||
| Criminal damage | -57 | * | -42 | * | -47 | * | -8 | ||
| Criminal damage to a vehicle | -48 | * | -33 | * | -47 | * | -11 | * | |
| Arson and other criminal damage | -69 | * | -54 | * | -47 | * | -1 | ||
| Incidence rate per 1,000 households | |||||||||
| Criminal damage | -63 | * | -47 | * | -50 | * | -9 | ||
| Criminal damage to a vehicle | -55 | * | -39 | * | -50 | * | -12 | * | |
| Arson and other criminal damage | -73 | * | -58 | * | -50 | * | -2 | ||
| Percentage of households that were victims once or more | Percentage point change and significance2,3 | ||||||||
| Criminal damage | -6.2 | * | -3.2 | * | -3.7 | * | -0.5 | * | |
| Criminal damage to a vehicle | -3.5 | * | -1.7 | * | -2.7 | * | -0.4 | * | |
| Arson and other criminal damage | -3.1 | * | -1.5 | * | -1.3 | * | -0.1 | ||
| Source: Crime Survey for England and Wales, Office for National Statistics | |||||||||
| Notes: | |||||||||
| 1. Appendix table A1, A2, A3 provide detailed footnotes and data for further years. | |||||||||
| 2. Statistically significant change at the 5% level is indicated by an asterisk. | |||||||||
| 3. The percentage point change presented in the tables may differ from subtraction of the 2 percentages due to rounding. | |||||||||
Download this table Table 17b: CSEW criminal damage - percentage change and statistical significance [1]
.xls (78.8 kB)The Crime-recording: making the victim count report, published by Her Majesty’s Inspectorate of Constabulary (HMIC), found that nationally, an estimated 14% of criminal damage and arson offences that should have been recorded as crimes were not; this level of under-recording is better than the national average of 19%. The ‘Accuracy of the statistics’ section has more information.
Police recorded crime also shows reductions in the similar offence group of criminal damage and arson (although this also includes victims beyond the household population, like businesses)1. In the year ending December 2014 there were 499,885 offences recorded, a fall of 2% from the previous year (Tables 18a and 18b). Reductions were seen across most types of criminal damage recorded by the police, however arson increased by 1% in the year ending December 2014 compared with the previous year. ( Appendix table A4 (486 Kb Excel sheet) ). Criminal damage and arson offences have seen a marked fall since 2006/07 whereas the pattern had been fairly flat since 2002/03; this follows a similar trend to the CSEW.
Table 18a: Police recorded criminal damage and arson offences- number and rate of offences [1,2,3]
| England and Wales | ||||
| Apr-03 to Mar-04 | Apr-08 to Mar-09 | Jan-13 to Dec-13 | Jan-14 to Dec-14 | |
| Criminal damage and arson | 1,209,912 | 930,327 | 510,708 | 499,885 |
| Arson | 57,546 | 34,827 | 18,703 | 18,934 |
| Criminal damage | 1,152,366 | 895,500 | 492,005 | 480,951 |
| Criminal damage and arson rate per 1,000 population | 23 | 17 | 9 | 9 |
| Source: Police recorded crime, Home Office | ||||
| Notes: | ||||
| 1. Police recorded crime data are not designated as National Statistics. | ||||
| 2. Police recorded crime statistics based on data from all 44 forces in England and Wales (including the British Transport Police). | ||||
| 3. Appendix table A4 provides detailed footnotes and data for further years. | ||||
Download this table Table 18a: Police recorded criminal damage and arson offences- number and rate of offences [1,2,3]
.xls (74.8 kB)
Table 18b: Police recorded criminal damage and arson offences - percentage change [1,2,3]
| England and Wales | |||
| Percentage change | |||
| January 2014 to December 2014 compared with: | |||
| Apr-03 to Mar-04 | Apr-08 to Mar-09 | Jan-13 to Dec-13 | |
| Criminal damage and arson | -59 | -46 | -2 |
| Arson | -67 | -46 | 1 |
| Criminal damage | -58 | -46 | -2 |
| Source: Police recorded crime, Home Office | |||
| Notes: | |||
| 1. Police recorded crime data are not designated as National Statistics. | |||
| 2. Police recorded crime statistics based on data from all 44 forces in England and Wales (including the British Transport Police). | |||
| 3. Appendix table A4 provides detailed footnotes and data for further years. | |||
Download this table Table 18b: Police recorded criminal damage and arson offences - percentage change [1,2,3]
.xls (81.9 kB)Notes for criminal damage
- Section 5.3 of the User Guide has more details regarding this crime type.
15. Other crimes against society
Other crimes against society are offences recorded by the police which do not generally have a specific identifiable victim. They make up around 11% of all police recorded crime. Trends in such offences tend to reflect changes in police workload and activity rather than in levels of criminality.
The group of offences is made of the following categories:
drug offences
possession of weapons offences
public order offences
miscellaneous crimes against society
Other crimes against society showed an increase of 1% compared with the previous year, with 401,293 offences recorded in the year ending December 2014 (Tables 19a and 19b). Figure 13 shows the trend over time and how each separate offence category contributes to the overall total.
Since 2003/04, the number of other crimes against society increased year on year until it peaked in 2007/08 (542,656 offences). The marked increases in the recording of these offences between 2004/05 and 2007/08 coincide with the priority placed on increasing the numbers of offences brought to justice associated with the previous government’s 2005 to 2008 Public Service Agreement targets. This is particularly reflected in the trend for drug offences and public order offences (the relevant sections have further details).
Between 2007/08 and 2012/13, the number of offences against society recorded decreased year-on-year, mainly driven by reductions in public order offences.
Figure 13: Trends in police recorded other crimes against society in England and Wales, 2002/03 to year ending December 2014
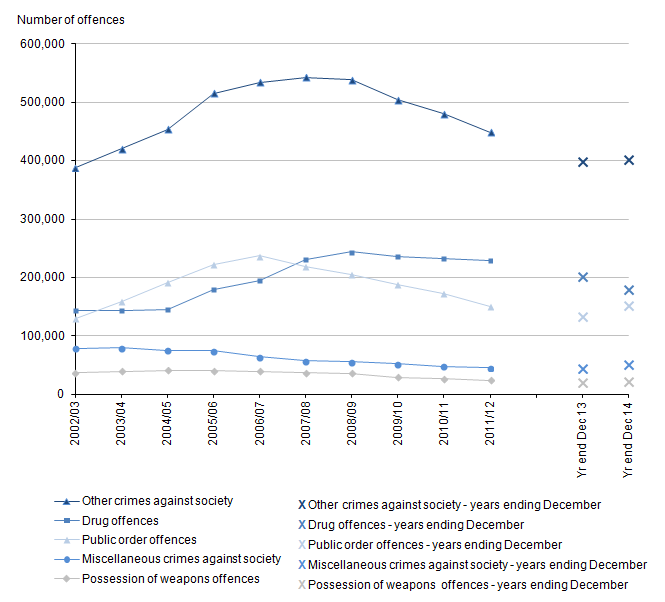
Source: Police recorded crime, Home Office
Notes:
- Police recorded crime data are not designated as National Statistics.
Download this image Figure 13: Trends in police recorded other crimes against society in England and Wales, 2002/03 to year ending December 2014
.png (28.3 kB) .xls (76.8 kB)
Drug offences
The police recorded 178,719 drug offences in the year ending December 2014, a decrease of 11% compared with the previous year. Figure 13 shows the trend over time for drug offences, where the number of drug offences steadily rose from 2004/05 until 2008/09 (peaking at 243,536 offences). They remained fairly consistent at around 230,000 each year until 2011/12, after which they began to fall. Despite recent decreases, the number of drug offences recorded in the year ending December 2014 remains 25% higher than the number recorded in 2003/04 (Table 19b).
The number of drug offences recorded by the police is heavily dependent on police activities and priorities; changes over time may reflect changes in the policing of drug crime, rather than real changes in its incidence. The increases in the recording of drug offences between 2004/05 and 2008/09 coincide with the priority placed Public Service Agreement targets. For example, in the past decade the police have been granted powers to issue:
- warnings on the street (rather than at a police station) for possession of cannabis offences (April 2004)
- penalty notices for disorder for possession of cannabis (January 2009)
In the year ending December 2014, possession of cannabis offences accounted for 66% of all police recorded drug offences; this proportion has remained broadly similar since 2005/06 (between 66% and 70%).
The Crime Survey for England and Wales (CSEW) can also be used to investigate trends in drug use. Relevant figures from the CSEW are compiled and published in an annual report by the Home Office: Drug Misuse: Findings from the 2013 to 2014 Crime Survey for England and Wales. The general trends from the 2013/14 report show that overall illicit drug use in the last year among 16 to 59 year olds has increased in comparison to the previous year, but is back to the same level as in 2011/12.
Public order offences
Public order offences cover circumstances where an offender is behaving in a way that causes, or would be likely to cause, alarm, distress or disorder. If there is an identifiable victim against who physical violence is used (or attempted) then this will be recorded as a violent offence, though public order offences may include some offences where injury is threatened. The offences in this category include public fear, alarm or distress, which has been moved from the violence offence group. Affray is also included in this offence group, a person is guilty of affray they use or threaten unlawful violence towards another and their conduct is such as would cause a “person of reasonable firmness” present at the scene to fear for their personal safety.
The latest figures (151,083 offences) show a 14% increase in public order offences compared with the previous year (Table 19b). The majority of this category (59%) was made up of public fear, alarm or distress offences, which showed an 14% increase in the year ending December 2014 compared with the previous year; a rise that is likely to reflect improvements in recording practices. Racially or religiously aggravated public fear, alarm or distress offences also increased (by 18%) in the year ending December 2014, and other offences against the State or public order have increased by 13% on the previous year. Public order offences rose from 2002/03 and peaked in 2006/07 (236,661 offences) and have since shown year-on-year decreases until this year ( Appendix table A4 (486 Kb Excel sheet) ). Like drug offences, increases shown for this offence can reflect increased police activity and reporting, rather than increasing levels of criminality. Furthermore, as with violent crime, public order offences are more prone to changes in police recording practices.
Possession of weapons offences
This offence category covers only weapons possession offences, where there is no direct victim. Any circumstances in which a weapon has been used against a victim would be covered by other relevant victim-based offences. Information regarding offences where firearms or knives and sharp instruments have been used can be found in the ‘Offences involving firearms’ and ‘Offences involving knives and sharp instruments’ sections of this release.
The police recorded 21,371 possession of weapon offences in the year ending December 2014, a 4% increase compared with the previous year (20,517, Table 19a and 19b). The number of possession of weapons offences increased from 2002/03 and peaked in 2004/05 (40,605 offences). They have since shown year-on-year decreases until 2013/14. The latest increase has been driven by a rise in the possession of knives and other sharp instruments1 (up 9%) and is consistent with a rise of 10% seen in assault with injury offences involving a knife or other sharp instrument (Table 9a).
Miscellaneous crimes against society
‘Miscellaneous crimes against society’ comprises a variety of offences ( Appendix table A4 (486 Kb Excel sheet) has a full list). The largest volume offences include: handling stolen goods, threat to commit criminal damage, obscene publications and perverting the course of justice. This bulletin includes a new category of ‘Wildlife crime’, which was previously included in other notifiable offences, but since the Crime Statistics, year ending June 2014 release has been separated into its own category. ‘Wildlife crime’ is a low volume offence, because the vast majority of wildlife offences are non-notifiable (that is, not recorded by the police) and dealt with at magistrates’ courts by other agencies, such as the National Crime Agency and the Border Force.
The police recorded 50,120 miscellaneous crimes against society offences in the year ending December 2014, an increase of 14% compared with the previous year (Table 19b). The number of offences had previously shown year-on-year decreases since 2003/04 until the increase observed in 2013/14.
The latest increase is, in part, driven by a large rise in the number of obscene publications and protected sexual material offences, which has increased by 50% to 6,383 offences in the year ending December 2014, when compared with the previous year (4,261 offences). This is largely due to an increase in offences related to the making and distribution of indecent photographs or pseudo-photographs (including those of children) via the internet or through mobile technology. It is an offence for a person to take or distribute such indecent photographs. The police service is reporting that they are giving more attention to child sexual exploitation and this is likely to have led to more of these offences being identified. In addition, due to the introduction of fly tipping as an offence in April 2014, there was also a large rise in the number of other indictable or triable either way offences. They increased by 99% to 4,508 in the year ending December 2014, compared with the previous year (2,269).
There was also a rise in threats to commit criminal damage (which includes possession of articles with the intent to commit criminal damage, such as spray paint) which increased by 48% from 5,397 offences in the year ending December 2013 to 7,997 offences in the year ending December 2014 ( Appendix table A4 (486 Kb Excel sheet) ).
Table 19a: Police recorded other crimes against society - number and rate of offences [1,2,3]
| England and Wales | ||||
| Apr-03 to Mar-04 | Apr-08 to Mar-09 | Jan-13 to Dec-13 | Jan-14 to Dec-14 | |
| Other crimes against society | 420,595 | 539,153 | 397,662 | 401,293 |
| Drug offences | 143,511 | 243,536 | 201,172 | 178,719 |
| Trafficking of drugs | 24,628 | 29,885 | 29,592 | 28,021 |
| Possession of drugs | 118,883 | 213,651 | 171,580 | 150,698 |
| Possession of weapons offences | 39,021 | 35,662 | 20,517 | 21,371 |
| Public order offences | 158,178 | 204,289 | 131,971 | 151,083 |
| Miscellaneous crimes against society | 79,885 | 55,666 | 44,002 | 50,120 |
| Rate per 1,000 population | ||||
| Other crimes against society | 8 | 10 | 7 | 7 |
| Drug offences | 3 | 4 | 4 | 3 |
| Possession of weapons offences | 1 | 1 | 0 | 0 |
| Public order offences | 3 | 4 | 2 | 3 |
| Miscellaneous crimes against society | 2 | 1 | 1 | 1 |
| Source: Police recorded crime, Home Office | ||||
| Notes: | ||||
| 1. Police recorded crime data are not designated as National Statistics. | ||||
| 2. Police recorded crime statistics based on data from all 44 forces in England and Wales (including the British Transport Police). | ||||
| 3. Appendix table A4 provides detailed footnotes and data for further years. | ||||
Download this table Table 19a: Police recorded other crimes against society - number and rate of offences [1,2,3]
.xls (82.9 kB)
Table 19b: Police recorded other crimes against society - percentage change [1,2,3]
| England and Wales | |||
| Percentage change | |||
| January 2014 to December 2014 compared with: | |||
| Apr-03 to Mar-04 | Apr-08 to Mar-09 | Jan-13 to Dec-13 | |
| Other crimes against society | -5 | -26 | 1 |
| Drug offences | 25 | -27 | -11 |
| Trafficking of drugs | 14 | -6 | -5 |
| Possession of drugs | 27 | -29 | -12 |
| Possession of weapons offences | -45 | -40 | 4 |
| Public order offences | -4 | -26 | 14 |
| Miscellaneous crimes against society | -37 | -10 | 14 |
| Source: Police recorded crime, Home Office | |||
| Notes: | |||
| 1. Police recorded crime data are not designated as National Statistics. | |||
| 2. Police recorded crime statistics based on data from all 44 forces in England and Wales (including the British Transport Police). | |||
| 3. Appendix table A4 provides detailed footnotes and data for further years. | |||
Download this table Table 19b: Police recorded other crimes against society - percentage change [1,2,3]
.xls (75.3 kB)Notes for other crimes against society
- Recorded under 10D possession of an article with blade or point.
16. Fraud
The extent of fraud is difficult to measure because it is a deceptive crime, often targeted at organisations rather than individuals. Some victims of fraud may be unaware they have been a victim of crime, or that any fraudulent activity has occurred. Others may be reluctant to report the offence to the authorities, feeling embarrassed that they have fallen victim. Fraud is an offence not currently included in the Crime Survey for England and Wales (CSEW) headline estimates, and the level of fraud reported via administrative sources is thought to significantly understate the true level of such crime.
The National Statistician’s Review of Crime Statistics for England and Wales identified fraud as one of the more important gaps in crime statistics and recommended that data from additional sources should be provided alongside existing available data in quarterly crime statistics publications. This section draws on a range of sources including police recorded crime, Action Fraud, the CSEW and the National Fraud Intelligence Bureau (NFIB). No individual source provides a good measure of the overall extend of fraud offences, but together they help to provide a fuller picture. There is more information on the different sources of fraud data in Section 5.4 of the User Guide.
Recent changes to measuring police recorded fraud
There have been a number of changes to the presentation of fraud, which were first introduced in the quarterly bulletin, released in July 2013. Since that time, to reflect changes in operational arrangements for reporting and recording of fraud, data presented in the police recorded crime series include offences recorded by Action Fraud, a public facing national reporting centre that records incidents reported directly to them from the public and other organisations. Data from Action Fraud are collated by the National Fraud Intelligence Bureau (NFIB), a government funded initiative run by the City of London police, who lead national policing on fraud.
Since 1 April 2013, Action Fraud has taken responsibility for the central recording of fraud offences previously recorded by individual police forces1. To allow for piloting and development of the Action Fraud service this transfer had a phased introduction between April 2011 and March 2013. For example, by the end of December 2012, 24 police force areas had transferred responsibility with the remaining forces transferring by the end of March 20132.
From 1 April 2014, all fraud figures included within overall police recorded crime have been sourced from Action Fraud3. However, the comparator year (year ending December 2013) encompasses a mixture of data collections, with 1 quarter of the data collected by some police forces and Action Fraud and 3 quarters solely by Action Fraud. As the proportion of fraud offences recorded by individual forces has diminished (and that by Action Fraud has grown), it is not possible to make like-for-like comparisons between fraud offences recorded during the year ending December 2014 and those in previous years.
Although Action Fraud receives reports of fraud from victims across the UK, data presented in this bulletin cover fraud offences where the victim resides in England or Wales only, based on the victim’s postcode. Currently, Action Fraud data are not included in sub-national tables.
Users of police force area level data should refer to Table 5c in the User Guide for details of when each local force transferred responsibility for recording to Action Fraud. This will allow users to interpret trends in fraud and total recorded crime over time. To provide users with a comparable time series at sub-national level our reference tables include a figure for all police recorded crime excluding fraud4.
Total fraud offences recorded by Action Fraud
In the year ending December 2014, 224,947 fraud offences were recorded in England and Wales (Table 20a), equivalent to 4 offences recorded per 1,000 population. This represents a volume increase of 9% compared with the previous year (Table 20b). However, the move to centralised recording of fraud makes comparisons over time problematic. There are a number of factors that may have contributed to this increase including:
the centralisation of recording fraud and a possible improvement in recording practices resulting from having a specialist team dealing with fraud
a possible increased proportion of victims reporting fraud following publicity around the launch of Action Fraud and the availability of online reporting tools to make it easier to report such offences
a possible increase in the volume of fraud
It isn’t possible to separate out or quantify the scale of each possible factor. It will only be when data for the year ending March 2015 is available (due to be published in July 2015) that the effects of the transition will no longer be a major factor when considering the year-on-year changes. Quarterly analysis of fraud offences shows that during the transition to Action Fraud the level of recorded fraud showed steady increases. However, since the point by which all forces had transferred to Action Fraud (April 2013) levels of fraud remained fairly steady in the first 4 quarters (with the exception of 1 lower quarter – October to December 2013). Data from the latest 2 quarters have shown increases, it is too early to say whether this is the beginning of an emerging upward trend ( Table QT1 (202 Kb Excel sheet) ).
Appendix table A5 (486 Kb Excel sheet) shows a more detailed breakdown of the fraud offences recorded by Action Fraud in the year ending December 2014, and indicates that the largest share of offences (42%) were accounted for by non-investment frauds (95,459 offences), almost half of which specifically relates to frauds involving online shopping and auctions (42,535 offences). There were only 18,412 offences involving cheque, plastic card and online bank accounts, which is likely to reflect that many individuals who had experienced such crime will not report to Action Fraud if their financial services provider reimburses their losses5. In contrast, reports from industry sources to NFIB show there were over 260,000 frauds involving cheque, plastic card and online bank accounts (Table 21). It is known that this significantly understates the level of such crime as ‘Card not present’ fraud, for example fraudulent use of the card online, over the phone or by mail order, is not included within such industry reports.
There is more information on the types of offences within each of the Action Fraud categories in Section 5.4 of the User Guide and Appendix table A5 (486 Kb Excel sheet) .
Table 20a: Fraud offences recorded by the police and Action Fraud - number and rate of offences [1,2]
| England and Wales | |||
| Apr-08 to Mar-09 | Jan-13 to Dec-13 | Jan-14 to Dec-14 | |
| Fraud offences recorded by the police and Action Fraud3,4,5,6 | 72,314 | 207,163 | 224,947 |
| Fraud rate per 1,000 population | 1 | 4 | 4 |
| Source: Police recorded crime, Home Office and Action Fraud, National Fraud Authority | |||
| Notes: | |||
| 1. Police recorded crime and Action Fraud data are not designated as National Statistics. | |||
| 2. Police recorded crime statistics based on all data from all 44 forces in England and Wales (including the British Transport Police). | |||
| 3. Action Fraud have taken over the recording of fraud offences on behalf of individual police forces. This process began in April 2011 and was rolled out to all police forces by March 2013. The offences in this table therefore include those recorded by either the police or Action Fraud individually, or both, depending on the time period specified. | |||
| 4. Due to the change in recording of fraud offences being taken over by Action Fraud, caution should be applied when comparing data over this transitional period and with earlier years. The User Guide provides more details including information on transfer date to Action Fraud for each force. | |||
| 5. From 2012-13, forgery offences have been reclassified under miscellaneous crimes against society. | |||
| 6. 'Making off without payment' was previously included in fraud. Since April 2013, it is included in all other theft offences. | |||
Download this table Table 20a: Fraud offences recorded by the police and Action Fraud - number and rate of offences [1,2]
.xls (82.4 kB)
Table 20b: Fraud offences recorded by the police and Action Fraud - percentage change [1,2]
| England and Wales | ||
| Percentage change | ||
| January 2014 to December 2014 compared with: | ||
| Apr-08 to Mar-09 | Jan-13 to Dec-13 | |
| Fraud offences recorded by the police and Action Fraud3,4,5,6 | 211 | 9 |
| Source: Police recorded crime, Home Office and Action Fraud, National Fraud Authority | ||
| Notes: | ||
| 1. Police recorded crime and Action Fraud data are not designated as National Statistics. | ||
| 2. Police recorded crime statistics based on all data from all 44 forces in England and Wales (including the British Transport Police). | ||
| 3. Action Fraud have taken over the recording of fraud offences on behalf of individual police forces. This process began in April 2011 and was rolled out to all police forces by March 2013. The offences in this table therefore include those recorded by either the police or Action Fraud individually, or both, depending on the time period specified. | ||
| 4. Due to the change in recording of fraud offences being taken over by Action Fraud, caution should be applied when comparing data over this transitional period and with earlier years. The User Guide provides more details including information on transfer date to Action Fraud for each force. | ||
| 5. From 2012-13, forgery offences have been reclassified under miscellaneous crimes against society. | ||
| 6. 'Making off without payment' was previously included in fraud. Since April 2013, it is included in all other theft offences. | ||
Download this table Table 20b: Fraud offences recorded by the police and Action Fraud - percentage change [1,2]
.xls (75.8 kB)Fraud offences reported by industry bodies
In line with recommendations from the National Statistician’s review of crime statistics this bulletin draws on additional sources to provide further context on fraud offences. In addition to the offences recorded by Action Fraud, which are included in the police recorded crime series, the National Fraud Intelligence Bureau (NFIB) also collect data on fraud directly from industry bodies (Table 21).
The NFIB currently receive data from two industry bodies:
CIFAS is a UK-wide fraud prevention service representing around 300 organisations from the public and private sectors. These organisations mainly share data on confirmed cases of fraud, particularly application, identity and first party frauds, via the CIFAS National Fraud Database. Data supplied by CIFAS to the NFIB are recorded in line with the Home Office Counting Rules (HOCR) for recorded crime.
Financial Fraud Action UK (FFA UK) is the name under which the financial services industry co-ordinates its activity on fraud prevention. FFA UK collates information from the payments industry in the UK on fraud relating to cheque, plastic card and online bank accounts. Statistics on these fraud types are published twice yearly by FFA UK. FFA UK also collates intelligence relating to fraud offences through its Fraud Intelligence Sharing System (FISS) database, and this is in turn provided to NFIB.
FISS is an intelligence tool rather than a fraud reporting tool, and its main purpose is to share intelligence about the criminals or entities relating to fraud offences rather than count the number of victims of fraud. As a result, the number of cases presented here is considerably less than the total number reported to FFA UK by its members. There are many cases recorded by FFA UK which are not shared with the NFIB because they hold insufficient information to be of value from an intelligence perspective. In future bulletins we intend to present this additional data on a broader set of fraud offences to give a clearer picture on the full scale of fraud experienced by FFA UK members. These figures are available from FFA UK.
Both sets of industry data relate only to those organisations that are part of the respective membership networks (CIFAS, FFA UK); therefore, coverage can also change as new members join or previous members withdraw. These data are subject to continuing development and ONS is giving consideration as to whether these can be designated as Official Statistics in the future.
In addition, users should also be aware that the NFIB data sourced from industry bodies cover the United Kingdom as a whole, while all other data in this bulletin refer to England and Wales.
In addition to the offences recorded by Action Fraud, the NFIB received 411,590 reports of fraud in the UK in the year ending December 2014 from industry bodies CIFAS and FFA UK (Table 21). This represents a 33% increase from the previous year (309,880 reports). This increase is thought to be largely the result of improvements in the collection of data for intelligence purposes by FFA6 and improvements to administrative systems used for reporting fraud cases to the NFIB7.
Of the fraud offences reported by those bodies, 81% were in the category of ‘banking and credit industry fraud’ (334,135). This category includes fraud involving plastic cards , cheques and online bank accounts which accounted for the majority of the offences recorded in the year ending December 2014. The category also covers payment-related frauds under the subcategory ‘Application Fraud’ which includes offences that occurred outside of the banking sector; for example, fraudulent applications made in relation to hire purchase agreements, as well as to insurance, telecommunications or retail companies, or public sector organisations.
Types of plastic card fraud recorded by the National Fraud Database include fraudulent applications for plastic cards (including ID fraud), fraudulent misuse of plastic card accounts, and takeover of plastic card accounts (for example changing the address and getting new cards issued). CIFAS do not currently collect data on ‘card not present’ fraud, where the cardholder and card are not present at the point of sale, for example, fraudulent use of the card online, over the phone or by mail order. In addition they do not include data on fraud relating to lost or stolen cards and ATM fraud. This means that a high proportion of plastic card fraud is not included in the NFIB figures from industry bodies.
FFA UK data given to NFIB contains intelligence for ‘Mail Not Received (MNR) fraud’, ‘Card ID fraud’ (includes Account Takeover and Application Fraud), ‘Payment fraud’ (includes fraud relating to telephone banking and online banking), ‘Cheque fraud’ (includes forged, altered and counterfeit) and ‘Mule accounts’ (accounts used for laundering the proceeds of fraud). Like CIFAS, FFA UK do not currently feed through to the NFIB data on ‘card not present’ fraud, lost or stolen cards and ATM fraud8. This is because the benefits of sharing these cases from an intelligence perspective are very limited. ‘Card not present’ fraud is thought to represent a significant volume of all plastic card fraud and thus the figures here understate the level of fraud known by industry bodies. However, information relating to financial fraud losses on all payment types is published annually by the FFA UK 9. In future quarterly it is intended that we will present a more comprehensive set of data representing the a broader range of offences experienced by FFA UK members, including data on ‘Card not present’ fraud.
CIFAS and FFA UK provide separate feeds to NFIB via their individual databases, however a proportion of organisations are members of both industry bodies (CIFAS, FFA UK).
It is possible that there may be some double or triple counting between both these sources and the offences recorded via direct reports from victims to Action Fraud. For example, if police are called to a bank and apprehend an offender for a fraud offence, the police may report this crime to Action Fraud in addition to the bank reporting the same crime to CIFAS and/or FFA UK as part of their processes. Experts believe this duplication to be so small as to have an insignificant effect on crime trends, but there is no simple cross-referencing method within NFIB to detect the scale of it.
Table 21: Fraud offences, reported by industry bodies to NFIB, year ending December 2014 [1,2]
| United Kingdom | ||||
| Numbers | ||||
| Fraud Type3 | CIFAS | FFA UK | Total | |
| Banking and credit industry fraud | 199,538 | 134,597 | 334,135 | |
| Cheque, Plastic Card and Online Bank Accounts (not PSP)4 | 133,972 | 134,597 | 268,569 | |
| Application Fraud (excluding Mortgages) | 61,343 | 0 | 61,343 | |
| Mortgage Related Fraud | 4,223 | 0 | 4,223 | |
| Insurance Related Fraud | 8,908 | 0 | 8,908 | |
| Telecom Industry Fraud (Misuse of Contracts)5 | 68,361 | 0 | 68,361 | |
| Business Trading Fraud | 148 | 0 | 148 | |
| Fraudulent Applications for Grants from Charities | 38 | 0 | 38 | |
| Total | 276,993 | 134,597 | 411,590 | |
| Source: National Fraud Intelligence Bureau6 | ||||
| Notes: | ||||
| 1. Fraud data are not designated as National Statistics. | ||||
| 2. From 2012/13, this table presents fraud data collated by NFIB from CIFAS and Financial Fraud Action UK (FFA UK) only and does not include fraud offences recorded by Action Fraud, which are now represented alongside police recorded crime. Data presented here are therefore not comparable with past published NFIB figures. | ||||
| 3. Section 5.4 of the User Guide provides an explanation and examples of fraud offences wihin each category. | ||||
| 4. A PSP is a payment service provider (for example Paypal, World Pay) that is not a bank, dealing in electronic money transfers. Fraud offences perpetrated using PSPs fall under 'Online shopping and auctions' (not collected by industry bodies). | ||||
| 5. The CIFAS Telecom Industry Fraud figure is substantially higher than that seen in the year ending December 2013 bulletin. This is due to a correction of an error that was caused by the NFIB system not correctly picking up certain CIFAS fraud types. | ||||
| 6. Further information on the National Fraud Intelligence Bureau can be found on http://www.nfib.police.uk/ | ||||
Download this table Table 21: Fraud offences, reported by industry bodies to NFIB, year ending December 2014 [1,2]
.xls (77.8 kB)Measuring fraud using the Crime Survey for England and Wales (CSEW)
Fraud is not currently included in the headline CSEW crime estimates. However, the CSEW includes supplementary modules of questions on victimisation across a range of fraud and cyber-crime offences, including plastic card and bank/building society fraud. These are currently reported separately from the headline estimates.
We are currently conducting some work to extend the main victimisation module in the CSEW to cover elements of fraud and cyber-crime. There is more information in the methodological note Work to extend the Crime Survey for England and Wales to include fraud and cyber crime and in Section 5.4 of the User Guide.
Once the new questions are added to the survey it will lead to an increase in the volume of crime measured by it. To give an indication of the scale of including such crimes in the future, a separate piece of analysis was conducted of existing questions from the 2012/13 CSEW. However, this was based on some simple assumptions given the current absence of data on main elements, such as the number of times respondents fell victim within the crime reference period. The analysis showed that together, plastic card fraud and bank and building society fraud could contribute between 3.6 and 3.8 million incidents of crime to the total number of CSEW crimes in that year.
Plastic card fraud
The CSEW main crime estimates don’t include plastic card fraud. However, elements of banking and payment related fraud are the focus of a module of questions in the CSEW, which asks respondents about their experience of plastic card fraud and can be reported on separately.
The year ending December 2014 CSEW showed that 4.8% of plastic card owners were victims of card fraud in the last year, no change from the 4.9% estimated in the year ending December 2013. Before that, there had been small reductions in levels of plastic card fraud over the last few years, following a rise between 2005/06 and 2009/10 surveys (Figure 14). The current level of victimisation remains higher than more established offences, such as theft from the person and other theft of personal property (1.0% and 1.5% respectively, Table 15). Further analysis, based on the 2011/12 CSEW, was published on 9 May 2013 as part of Focus on: Property Crime, 2011/12: Chapter 3 – Plastic card fraud.
Figure 14: Proportion of Crime Survey for England and Wales plastic card users who had been a victim of plastic card fraud in the last year, 2005/06 to year ending December 2014
Source: Crime Survey for England and Wales
Download this chart Figure 14: Proportion of Crime Survey for England and Wales plastic card users who had been a victim of plastic card fraud in the last year, 2005/06 to year ending December 2014
Image .csv .xlsSeparate figures are available from Financial Fraud Action UK (FFA UK) who report on levels of financial fraud losses on UK cards. This totalled £450 million in 2013, a 16% increase compared with 2012 (£388m). Despite this increase, significant decreases in recent years prior to this mean that card fraud losses in 2013 were 26% lower than in 2008 (£610m) when losses were at their peak10.
The industry suggests that a combination of the use of fraud screening detection tools by retailers, banks and the cards industry, the introduction of chip and pin technology, enhanced user and industry awareness, and improved prevention and detection initiatives, have led to the previous decreases in plastic card fraud. More detailed information including a breakdown of plastic card fraud by type in the UK and abroad, is available from FFA UK.
Notes for fraud
Police forces continue to record forgery offences, which fall under ‘Other crimes against society’ and are not included under ‘Fraud offences’. Section 5.4 of the User Guide has more information.
More information regarding the date when each police force transferred responsibility to Action Fraud can be found in Section 5.4 of the User Guide.
The completion of the transition to Action Fraud happened by the end of 2012/13. However, a small number of fraud offences were mistakenly recorded by police forces in early 2013/14. These were corrected in subsequent quarters.
Changes to the way that police record crimes of fraud following the introduction of the Fraud Act 2006 mean that fraud figures from 2007/08 onwards are not directly comparable with figures for earlier years.
Where the bank reiumburses the loss they may report the crime to an industry body such as CIFAS or FFA UK.
FFA UK made an improvement to its data collection for intelligence purposes during 2013, which has resulted in a considerable increase in the number of incidents reported to the NFIB during 2014.
A change to the NFIB fraud database allowed better reporting of fraud cases in the category of Telecom Industry Fraud.
These frauds are reported separately to FFA UK via a fraud reporting mechanism which does not feed through to NFIB, and so do not appear in the figures we publish.
Fraud losses on UK-issued cards between 2003 and 2013 are reported in the ‘Fraud The Facts 2014’ publication.
Fraud losses on UK-issued cards between 2003 and 2013 are reported in the ‘Fraud The Facts 2014’ publication.
17. Crime experienced by children aged 10 to 15
Since January 2009, the Crime Survey for England and Wales (CSEW) has asked children aged 10 to 15 resident in households in England and Wales about their experience of crime in the previous 12 months. Question changes during development of the questionnaire in the first 3 years of the survey should be considered when interpreting the figures. While data presented since the 2011/12 survey year should be comparable, it is difficult to discern a trend as the total number of incidents has shown small fluctuations across the available time series. For this reason no percentage change or statistical significance is presented for any year. Methodological differences also mean that direct comparisons can’t be made between the adult and child data (Millard and Flatley).
Overall level of crime
Based on CSEW interviews in the year ending December 2014, there were an estimated 767,000 crimes experienced by children aged 10 to 15 using the preferred measure1. There were 51% categorised as violent crimes2 (394,000) while most of the remaining crimes were thefts of personal property (312,000; 41%) (Tables 22 to 24). Incidents of criminal damage to personal property experienced by children aged 10 to 15 were less common (62,000; 8% of all crimes experienced by this age group).
An estimated 12% of children aged 10 to 15 were victims of crimes covered by the CSEW in the past year. This includes 6% who have been a victim of a violent crime and 6% who had been a victim of personal theft. While there were more violent incidents than theft offences, violent incidents affected a similar proportion of 10 to 15 year olds as seen for theft offences. This is because they were more likely to have been repeated against the same victim.
Table 22: CSEW offences experienced by children aged 10 to 15 - Preferred measure [1,2]
| England and Wales | |||||
| Children aged 10 to 15 | |||||
| Apr-10 to Mar-11 | Apr-11 to Mar-12 | Apr-12 to Mar-133 | Apr-13 to Mar-143 | Jan-14 to Dec-143 | |
| Number of incidents (thousands) | 918 | 1,066 | 817 | 810 | 767 |
| Percentage who were victims once or more | 11.6 | 15.1 | 12.2 | 12.1 | 11.8 |
| Unweighted base - number of children aged 10 to 15 | 3,849 | 3,930 | 2,879 | 2,933 | 2,405 |
| Source: Crime Survey for England and Wales, Office for National Statistics | |||||
| Notes: | |||||
| 1. Some estimates are based on a small number of children, hence caution should be applied; see User Guide tables UG6, UG7 and UG8 for the margin of error around the estimates. | |||||
| 2. The ‘Preferred measure’ takes into account factors identified as important in determining the severity of an incidence (such as level of injury, value of item stolen or damaged, relationship with the perpetrator) while the ‘Broad measure’ counts all incidents which would be legally defined as crimes and therefore may include low-level incidents between children. | |||||
| 3. Base sizes for data from year ending March 2012 onwards are smaller than previous years, due to sample size reductions introduced. | |||||
Download this table Table 22: CSEW offences experienced by children aged 10 to 15 - Preferred measure [1,2]
.xls (83.5 kB)Violent offences
The CSEW estimates that there were 394,000 violent offences against children aged 10 to 15 in the year ending December 2014 with two-thirds (66%) of these resulting in injury to the victim. This equates to 6% of children aged 10 to 15 experiencing violent crime in the last year; and 4% experiencing violence with injury (Table 23). In the year ending December 2014, 1% of children aged 10 to 15 were victims of robbery in the last year.
Table 23: CSEW violent offences experienced by children aged 10 to 15 - Preferred measure [1,2]
| England and Wales | ||||||
| Children aged 10 to 15 | ||||||
| Apr-10 to Mar-11 | Apr-11 to Mar-12 | Apr-12 to Mar-133 | Apr-13 to Mar-143 | Jan-14 to Dec-143 | ||
| Number of incidents (thousands) | ||||||
| Violence | 602 | 591 | 479 | 445 | 394 | |
| Wounding | 90 | 58 | 92 | 64 | 62 | |
| Assault with minor injury | 337 | 307 | 212 | 218 | 188 | |
| Assault without injury | 118 | 139 | 107 | 110 | 104 | |
| Robbery | 58 | 87 | 68 | 53 | 41 | |
| Violence with injury4 | 461 | 403 | 339 | 300 | 262 | |
| Violence without injury4 | 141 | 188 | 140 | 145 | 132 | |
| Percentage who were victims once or more | ||||||
| Violence | 6.8 | 7.7 | 6.1 | 6.5 | 5.6 | |
| Wounding | 1.1 | 1.0 | 1.0 | 1.1 | 0.9 | |
| Assault with minor injury | 3.7 | 3.6 | 2.9 | 3.3 | 3.0 | |
| Assault without injury | 1.7 | 2.2 | 1.4 | 1.7 | 1.4 | |
| Robbery | 0.9 | 1.3 | 1.0 | 0.7 | 0.7 | |
| Violence with injury4 | 5.0 | 4.8 | 4.2 | 4.5 | 4.0 | |
| Violence without injury4 | 2.1 | 3.1 | 2.1 | 2.2 | 2.0 | |
| Unweighted base - number of children aged 10 to 15 | 3,849 | 3,930 | 2,879 | 2,933 | 2,405 | |
| Source: Crime Survey for England and Wales, Office for National Statistics | ||||||
| Notes: | ||||||
| 1. Some estimates are based on a small number of children, hence caution should be applied; see User Guide tables UG6, UG7 and UG8 for the margin of error around the estimates. | ||||||
| 2. The ‘Preferred measure’ takes into account factors identified as important in determining the severity of an incidence (such as level of injury, value of item stolen or damaged, relationship with the perpetrator) while the ‘Broad measure’ counts all incidents which would be legally defined as crimes and therefore may include low-level incidents between children. | ||||||
| 3. Base sizes for data from year ending March 2012 onwards are smaller than previous years, due to sample size reductions introduced. | ||||||
| 4. 'Violence with injury' includes wounding, assault with minor injury and robbery where injury was sustained. 'Violence without injury' includes assault without injury and robbery where no injury was sustained. | ||||||
Download this table Table 23: CSEW violent offences experienced by children aged 10 to 15 - Preferred measure [1,2]
.xls (79.9 kB)Property offences
There were an estimated 312,000 incidents of theft and 62,000 incidents of damage of personal property experienced by children aged 10 to 15 in the year ending December 2014, according to the CSEW. Around 63% of the thefts were classified as other theft of personal property (197,000 incidents) which includes thefts of property left unattended.
In the last year 6% of children aged 10 to 15 had experienced an incident of personal theft, with other theft of personal property most commonly experienced (4%). Theft from the person (for example, pick-pocketing) was not as common, with 1% of children reporting being victimised. Criminal damage to personal property was experiences by 1% of children.
Table 24: CSEW property offences experienced by children aged 10 to 15 - Preferred measure [1,2]
| England and Wales | |||||||
| Children aged 10 to 15 | |||||||
| Apr-10 to Mar-11 | Apr-11 to Mar-12 | Apr-12 to Mar-133 | Apr-13 toMar-143 | Jan-14 toDec-143 | |||
| Number of incidents (thousands) | |||||||
| Personal theft | 288 | 435 | 304 | 322 | 312 | ||
| Theft from the person | 35 | 55 | 42 | 49 | 60 | ||
| Snatch theft | 19 | 27 | 12 | 35 | 28 | ||
| Stealth theft | 16 | 28 | 30 | 13 | 31 | ||
| Other theft of personal property | 171 | 263 | 208 | 225 | 197 | ||
| Theft from the dwelling/outside the dwelling4 | 25 | 40 | 22 | 18 | 30 | ||
| Bicycle theft4 | 58 | 77 | 32 | 30 | 26 | ||
| Criminal damage to personal property4 | 28 | 40 | 34 | 43 | 62 | ||
| Percentage who were victims once or more | |||||||
| Personal theft | 5.4 | 8.1 | 6.5 | 6.2 | 6.2 | ||
| Theft from the person | 0.7 | 1.2 | 0.9 | 0.7 | 1.0 | ||
| Snatch theft | 0.3 | 0.6 | 0.3 | 0.5 | 0.4 | ||
| Stealth theft | 0.3 | 0.7 | 0.7 | 0.2 | 0.6 | ||
| Other theft of personal property | 3.1 | 4.9 | 4.4 | 4.4 | 4.1 | ||
| Theft from the dwelling/outside the dwelling4 | 0.5 | 0.7 | 0.5 | 0.4 | 0.6 | ||
| Bicycle theft4 | 1.2 | 1.5 | 0.8 | 0.7 | 0.6 | ||
| Criminal damage to personal property4 | 0.4 | 0.8 | 0.8 | 0.9 | 1.4 | ||
| Unweighted base - number of children aged 10 to 15 | 3,849 | 3,930 | 2,879 | 2,933 | 2,405 | ||
| Source: Crime Survey for England and Wales, Office for National Statistics | |||||||
| Notes: | |||||||
| 1. Some estimates are based on a small number of children, hence caution should be applied; see User Guide tables UG6, UG7 and UG8 for the margin of error around the estimates. | |||||||
| 2. The ‘Preferred measure’ takes into account factors identified as important in determining the severity of an incidence (such as level of injury, value of item stolen or damaged, relationship with the perpetrator) while the ‘Broad measure’ counts all incidents which would be legally defined as crimes and therefore may include low-level incidents between children. | |||||||
| 3. Base sizes for data from year ending March 2012 onwards are smaller than previous years, due to sample size reductions introduced. | |||||||
| 4. These offences are designated as 'household' offences for adults on the CSEW (respondents reply on behalf of the household) but are presented here as 'personal' offences when the property stolen or damaged solely belonged to the child respondent. This broadens the scope of personal victimisation but may also result in double-counting of offences on the adult survey; the extent to which this happens will be evaluated in the future. | |||||||
Download this table Table 24: CSEW property offences experienced by children aged 10 to 15 - Preferred measure [1,2]
.xls (73.2 kB)Notes for crime experienced by children aged 10 to 15
More information about the preferred and broad measures of crime against children can be found in the User Guide. Tables for the broad measure of crime are available in the bulletin table spreadsheet, Tables 22 to 24.
The survey of children aged 10 to 15 only covers personal level crime (so excludes household level crime); the majority (75%) of violent crimes experienced in the year ending September 2014 resulted in minor or no injury, so in most cases the violence is low level.
18. Anti-social behaviour
Incidents recorded by the police
Figures recorded by the police relating to anti-social behaviour (ASB) can be considered alongside police recorded (notifiable) crime to provide a more comprehensive view of the crime and disorder that comes to the attention of the police. Any incident of ASB which results in a notifiable offence will be included in police recorded crime figures and so the 2 sets of data don’t overlap.
The police record ASB incidents in accordance with the National Standard for Incident Recording (NSIR); Section 5.7 of the User Guide has further details. These figures are not currently accredited National Statistics. A review by Her Majesty’s Inspectorate of Constabulary (HMIC) in 2012 found significant variation in the recording of ASB incidents across police forces. It is also known that occasionally police forces may be duplicating some occurrences of a singular ASB incident where multiple reports by different callers have been made.
Following the HMIC review in 2012, it was also found that there was a wide variation in the quality of decision making associated with the recording of ASB1. HMIC found instances of:
forces failing to identify crimes, instead wrongly recording them as ASB
reported ASB not being recorded on force systems, for instance if the victim had reported it directly to the neighbourhood team or via email (as opposed to by telephone)
reported ASB being recorded as something else, such as suspicious behaviour
incidents that were not ASB being recorded as ASB
Furthermore, data on ASB incidents before and after 2011/12 are not directly comparable, owing to a change in the classification used for ASB incidents. From April 2012, ASB incidents also include data from the British Transport Police, so direct comparisons can only be made from 2012/13 onwards. The police recorded 2.0 million incidents of ASB in the year ending December 2014. This compares to the 3.8 million notifiable crimes recorded by the police over the same period (Figure 15). The number of ASB incidents recorded by the police and the British Transport Police in the year ending December 2014 decreased by 9%, compared with the previous year.
Figures for the period 2007/08 to 2011/12 also show declines in the number of ASB incidents recorded by the police consistent with recent trends in total police recorded crime.
Figure 15: Police recorded crime and anti-social behaviour incidents in England and Wales, 2007/08 to year ending December 2014

Source: Police recorded crime, Home Office / ASB incidents: 2007/08 - 2009/10 - National Policing Improvement Agency (NPIA); 2010/11 - Her Majesty's Inspectorate of Constabulary (HMIC); from 2011/12 onwards - Home Office
Notes:
- Police recorded crime and ASB incident data are not designated as National Statistics.
- Following a different approach to recording ASB incidents data, figures from 2011/12 onwards are not directly comparable with previous years; see Chapter 5 of the User Guide for more information.
- ASB incidents exclude British Transport Police.
Download this image Figure 15: Police recorded crime and anti-social behaviour incidents in England and Wales, 2007/08 to year ending December 2014
.png (14.3 kB) .xls (73.2 kB)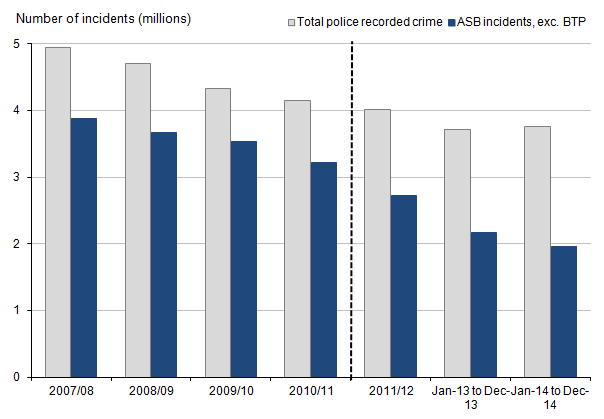
From 2011/12, a new set of 3 simplified categories for ASB was introduced (further details are available in Chapter 5 of the User Guide):
- ‘Nuisance’ captures incidents where an act, condition, thing or person causes trouble, annoyance, irritation, inconvenience, offence or suffering to the local community in general rather than to individual victims.
- ‘Personal’ captures incidents that are perceived as either deliberately targeted at an individual or group, or having an impact on an individual or group rather than the community at large.
- ‘Environmental’ captures incidents where individuals and groups have an impact on their surroundings, including natural, built and social environments.
All forces adopted these new definitions, though in the HMIC report it was found that 35% of all incidents reviewed were incorrectly categorised; this should be taken into account when considering ASB incident figures.
In the year ending December 2014, 67% of the ASB incidents categorised by the police were identified as nuisance; 27% as personal; and 6% as environmental (Figure 16). This distribution may reflect propensity of reporting rather than the actual distribution of ASB by type.
Figure 16: Categories of anti-social behaviour incidents in England and Wales, year ending December 2014
Notes:
- ASB incident data are not designated as National Statistics.
- Figures include British Transport Police.
Download this chart Figure 16: Categories of anti-social behaviour incidents in England and Wales, year ending December 2014
Image .csv .xlsCSEW measures of anti-social behaviour
Questions about respondents’ actual experiences of ASB in their local area were added to the 2011/12 Crime Survey for England and Wales (CSEW) to expand on existing questions about perceived ASB. These questions asked whether the respondent had personally experienced or witnessed ASB in their local area and, if so, what types.
In the year ending December 2014, 28% of adults indicated that they had personally experienced or witnessed at least one of the ASB problems asked about in their local area in the previous year (Table 25), which has not changed from the previous year. This included 10% of adults who experienced or witnessed drink related anti-social behaviour and 8% who witnessed or experienced groups hanging around on the streets.
Table 25: CSEW experiences of anti-social behaviour, years ending December 2013 and December 2014
| England and Wales | |||
| Adults aged 16 and over | |||
| Jan-13 to Dec-13 | Jan-14 to Dec-14 | Statistically significant change, Jan-13 to Dec-13 to Jan-14 to Dec-14 | |
| % | |||
| Personally experienced/witnessed anti-social behaviour in local area | 28.4 | 28.0 | |
| Types of anti-social behaviour experienced/witnessed1 | |||
| Drink related behaviour | 9.4 | 9.7 | |
| Groups hanging around on the streets | 8.9 | 8.3 | |
| Inconsiderate behaviour2 | 5.5 | 5.3 | |
| Loud music or other noise | 5.0 | 5.1 | |
| Litter, rubbish or dog-fouling | 4.0 | 4.3 | |
| Vandalism, criminal damage or graffiti | 3.7 | 3.9 | |
| People being intimidated, verbally abused or harassed | 3.3 | 3.3 | |
| People using or dealing drugs | 2.8 | 3.5 | * |
| Vehicle related behaviour3 | 3.0 | 3.6 | * |
| Nuisance neighbours | 2.8 | 2.8 | |
| Begging, vagrancy or homeless people | 0.8 | 1.0 | |
| Out of control or dangerous dogs | 0.6 | 0.7 | |
| People committing inappropriate or indecent sexual acts in public | 0.2 | 0.3 | |
| Other anti-social behaviour | 2.1 | 1.7 | * |
| Unweighted base | 36,333 | 32,638 | |
| Source: Crime Survey for England and Wales, Office for National Statistics | |||
| Notes: | |||
| 1. Respondents can experience more than one type of anti-social behaviour, so percentages will not sum to the total that experienced/witnessed anti-social behaviour in their local area. | |||
| 2. Includes repeated/inappropriate use of fireworks; youths kicking/throwing balls in inappropriate areas; cycling/skateboarding in pedestrian areas or obstructing pavements; people throwing stones/bottles/eggs, etc. | |||
| 3. Includes inconvenient/illegal parking; abandoned vehicles; speeding cars/motorcycles; car revving; joyriding, etc. | |||
Download this table Table 25: CSEW experiences of anti-social behaviour, years ending December 2013 and December 2014
.xls (71.2 kB)The CSEW also contains a separate set of questions asking respondents about perceptions of problems with different types of ASB in their local area; 7 of these are used to provide an overall index of perceived ASB. In the year ending December 2014 CSEW, 11% of adults perceived there to be a high level of ASB in their local area, a decrease of 1 percentage point since the previous year (Table 26).
Since 2003/04 the CSEW has consistently estimated that around a quarter of adults perceive a problem in their local area with “people using or dealing drugs” and almost a third perceive “rubbish or litter lying around” as a problem in their local area. Other anti-social behaviour indicators have tended to show declines over this time period, with the most pronounced decline for the ‘Abandoned or burnt-out cars’ category, which peaked at 24% in 2002/03 and has subsequently fallen each year down to 2% in the year ending December 2014.
Table 26: CSEW trends in the anti-social behaviour indicators, 1996 to year ending December 2014 [1]
| England and Wales | ||||||
| Adults aged 16 and over | ||||||
| Jan-96 to Dec-96 | Apr-03 to Mar-04 | Apr-08 to Mar-09 | Jan-13 to Dec-13 | Jan-14 to Dec-14 | Statistically significant change, Jan-13 to Dec-13 to Jan-14 to Dec-14 | |
| % | ||||||
| High level of perceived anti-social behaviour2 | : | 16.3 | 16.5 | 12.2 | 10.8 | * |
| Percentage saying there is a very/fairly big problem in their area | ||||||
| Rubbish or litter lying around | 26.0 | 29.0 | 30.3 | 28.5 | 28.3 | |
| People using or dealing drugs | 20.9 | 25.1 | 27.5 | 24.9 | 23.9 | |
| Teenagers hanging around on the streets | 23.5 | 27.2 | 30.2 | 20.3 | 17.4 | * |
| People being drunk or rowdy in public places2 | : | 19.1 | 26.2 | 19.3 | 18.0 | |
| Vandalism, graffiti and other deliberate damage to property | 24.3 | 28.1 | 26.8 | 16.9 | 15.7 | |
| Noisy neighbours or loud parties | 7.7 | 8.8 | 10.4 | 10.8 | 11.1 | |
| Abandoned or burnt-out cars2 | : | 15.2 | 5.8 | 2.4 | 2.3 | |
| Unweighted base3,4 | 7,625 | 36,116 | 44,010 | 8,821 | 8,041 | |
| Source: Crime Survey for England and Wales, Office for National Statistics | ||||||
| Notes: | ||||||
| 1. The Annual trend and demographic table D9 contains further years data. | ||||||
| 2. The question on abandoned or burn-out cars was introduced in 2000 and the question on people being drunk or rowdy in public places was introduced in 2001. | ||||||
| 3. Unweighted bases refer to the question relating to people using or dealing drugs. Other bases will be similar. | ||||||
| 4. From April 2011 the number of respondents asked questions about their perceptions of problems in the local area was reduced (from a full sample) to a half sample and from April 2012 was reduced to a quarter sample. | ||||||
Download this table Table 26: CSEW trends in the anti-social behaviour indicators, 1996 to year ending December 2014 [1]
.xls (78.8 kB)It is difficult to directly compare the two CSEW measures (perceptions of and experiences of ASB) since the list of ASB categories used in the experience-based questions is more expansive than those asked of respondents in relation to their perceptions. They also measure different things; actual experiences and perceptions. It is likely someone can experience an ASB incident without necessarily believing that it is part of a problem in their local area, if it was an isolated occurrence, for example. The frequency or number of incidents experienced, coupled with the perceived extent and seriousness of a problem, will also vary from person to person.
More detailed analysis on ASB as measured by the CSEW has been published in the 'Short Story on Anti-Social Behaviour, 2011/12' release.
Notes for anti-social behaviour
- The HMIC report: A step in the right direction: The policing of anti-social behaviour has further details.
19. Other non-notifiable crimes
The police recorded crime series is restricted to offences which are, or can be, tried at a Crown Court and a few additional closely related summary offences1. A range of non-notifiable offences may be dealt with by the police issuing an out of court disposal or by prosecution at court. Offences dealt with at court may also include some offences that have been identified by other agencies – for example, prosecutions by TV Licensing or by the Driver and Vehicle Licensing Agency (DVLA) for vehicle registration offences.
Data on these offences provide counts of offences where action has been brought against an offender and guilt has either been ascertained in court, or the offender has admitted culpability through acceptance of a penalty notice. These offences generally only come to light through the relevant authorities looking to identify offending behaviour. These figures help fill a gap in the coverage of the main Crime Survey for England and Wales (CSEW) and police recorded crime statistics.
The most recent data available on non-notifiable crimes are for the year ending September 2014.
Key findings include the following:
- cases brought to court in the year ending September 2014 resulted in close to 1.0 million convicted non-notifiable offences, down 4% from the previous year and continuing the downward trend since 2002/03 (Tables 27a and 27b)2
- around 30,000 Penalty Notices for Disorder were issued for non-notifiable offences in the year ending September 2014 (Table 27a); around 4 in 5 of these were for being drunk and disorderly3
Table 27a: Non-notifiable crimes dealt with by the courts/Penalty Notices for Disorder - number and rate
| England and Wales | ||||
| Apr-03 to Mar-04 | Apr-08 to Mar-09 | Oct-12 to Sep-13 | Oct-13 to Sep-14 | |
| Non-notifiable convictions (thousands)1 | 1,840 | 1,223 | 996 | 959 |
| Incidence rate (per 1,000 population)2,3 | 35 | 22 | 18 | 17 |
| Non-notifiable Penalty Notices for Disorder (thousands)4,5,6 | : | 59 | 36 | 30 |
| Incidence rate (per 1,000 population)2,3 | : | 1 | 1 | 1 |
| Source: Ministry of Justice Criminal Justice Statistics Quarterly Update to Sept 2014 (Tables Q1.3, Q2.1, Q4e) | ||||
| Notes: | ||||
| 1. Figures for non-notifiable convictions apply to offenders aged 10 and over. | ||||
| 2. The year to September 2014 incidence rate is calculated using ONS mid-2012 census based population estimates. Other figures are also calculated using mid-year population estimates from previous years. | ||||
| 3. Numbers will be affected by the size of the resident population relative to the transient or visiting populations and may therefore over-represent the number of crimes relative to the real population of potential offenders. | ||||
| 4. Penalty Notices for Disorder, both higher and lower tier offences, issued to offenders aged 16 and over. | ||||
| 5. Piloted in 2002 and introduced nationally in 2004. | ||||
| 6. Includes British Transport Police from 2011. | ||||
Download this table Table 27a: Non-notifiable crimes dealt with by the courts/Penalty Notices for Disorder - number and rate
.xls (76.3 kB)
Table 27b: Non-notifiable crimes dealt with by the courts/Penalty Notices for Disorder - percentage change
| England and Wales | |||
| Percentage change | |||
| October 2013 to September 2014 compared with: | |||
| Apr-03 to Mar-04 | Apr-08 to Mar-09 | Oct-12 to Sep-13 | |
| Non-notifiable convictions1 | -48 | -22 | -4 |
| Incidence rate2,3 | -52 | -25 | -4 |
| Non-notifiable Penalty Notices for Disorder4,5,6 | : | -49 | -17 |
| Incidence rate2,3 | : | -51 | -17 |
| Source: Ministry of Justice Criminal Justice Statistics Quarterly Update to Sept 2014 (Tables Q1.3, Q2.1, Q4e) | |||
| Notes: | |||
| 1. Figures for non-notifiable convictions apply to offenders aged 10 and over. | |||
| 2. The year to September 2014 incidence rate is calculated using ONS mid-2012 census based population estimates. Other figures are also calculated using mid-year population estimates from previous years. | |||
| 3. Numbers will be affected by the size of the resident population relative to the transient or visiting populations and may therefore over-represent the number of crimes relative to the real population of potential offenders. | |||
| 4. Penalty Notices for Disorder, both higher and lower tier offences, issued to offenders aged 16 and over. | |||
| 5. Piloted in 2002 and introduced nationally in 2004. | |||
| 6. Includes British Transport Police from 2011. | |||
Download this table Table 27b: Non-notifiable crimes dealt with by the courts/Penalty Notices for Disorder - percentage change
.xls (76.3 kB)The police and, increasingly, local authorities, have powers to issue penalty notices for a range of traffic offences; the police issued 1.3 million Fixed Penalty Notices (over half of which related to speeding) in 20124.
Notes for other non-notifiable crimes
- The Notifiable Offence List includes all indictable and triable-either-way offences (that is, offences which could be tried at a Crown Court) and a few additional closely related summary offences (which would be dealt with by magistrates’ courts). Appendix 1 of the User Guide has more information on the classifications used for notifiable crimes recorded by the police.
- The latest figures available from the Ministry of Justice (MoJ) relate to all offences for the year ending June 2014 and thus lag the CSEW and police recorded series by 3 months but are included to give a fuller picture.
- Figures from the MoJ’s Criminal Justice Statistics Quarterly Update to September 2014 (Tables Q1.3, Q2.1, Q4e).
- Figures from the Home Office’s Police Powers and Procedures 2012/13 publication.
20. Commercial victimisation survey
In order to address the significant gap in crime statistics that existed for crimes against businesses, the National Statistician’s review of crime statistics (National Statistician, 2011), recommended that the Home Office continue to implement its plans for a telephone survey of businesses.
The 2014 Commercial Victimisation Survey (CVS)1 provided information on the volume and type of crime committed against business premises in England and Wales across three sectors: ‘Wholesale and retail’; ‘Accommodation and food’; and ‘Agriculture, forestry and fishing’. Between them, these three sectors accounted for just under a third of all business premises in England and Wales in 2014.
The 2013 and 2012 CVS’s covered a slightly different set of business sectors. For 20132 the same sectors as 2014 were covered with the addition of ‘Arts, entertainment and recreation’. The 20123 CVS also included ‘Wholesale and retail’; ‘Accommodation and food’; and additionally ‘Manufacturing’; and ‘Transportation and storage’.
Headline figures for the number of crimes against businesses premises in the sectors covered by the CVS are included in this bulletin.
In the 2014 CVS there were an estimated total of 4,123,000 crimes experienced by business premises in the wholesale and retail sector. The apparent decrease of 30% compared with the 2013 CVS (5,915,000 crimes) was not statistically significant. However, comparing the 2014 CVS with the 2012 CVS there was a 47% statistically significant decrease. Between the 2012 and 2014 surveys estimated levels of shoplifting and burglary showed statistically significant decreases.
In the accommodation and food sector, the 2014 CVS estimated a total of 565,000 crimes against premises. The apparent 2% fall compared with the 2013 CVS (575,000 crimes) was not statistically significant. However, comparing the 2014 CVS with the 2012 CVS (985,000 crimes) there was a 43% statistically significant decrease over this time period. Between the 2012 and 2014 surveys estimated levels of theft and burglary showed statistically significant decreases.
In the 2014 CVS there were an estimated total of 95,000 crimes experienced by business premises in the agriculture, forestry and fishing sector. The apparent decrease of 29% compared with the 2013 CVS (133,000 crimes) was not statistically significant. This sector was not included in the 2012 CVS.
Of the three sectors surveyed in 2014, the highest levels of victimisation were seen for ‘Wholesale and retail’ premises (41%of premises experienced crime) and least prevalent in ‘Agriculture, forestry and fishing’ premises (26% of premises experienced crime in the 2014 CVS).
Table 28: Crime experienced by businesses, by industry sector, 2012, 2013 and 2014 CVS
| England and Wales | |||
| All CVS crime1 (numbers of incidents, 000s) | All CVS crime (rate per 1,000 premises) | All CVS crime (% of premises that experienced crime) | |
| 2012 | |||
| Wholesale and retail | 7,708 | 19,701 | 53 |
| Accommodation and food | 985 | 7,361 | 43 |
| Transportation and storage | 324 | 5,824 | 40 |
| Manufacturing | 164 | 1,500 | 30 |
| 2013 | |||
| Wholesale and retail | 5,915 | 17,261 | 45 |
| Accommodation and food | 575 | 4,565 | 42 |
| Arts, entertainment and recreation | 196 | 4,660 | 45 |
| Agriculture, forestry and fishing | 133 | 1,475 | 30 |
| 2014 | |||
| Wholesale and retail | 4,123 | 13,070 | 41 |
| Accommodation and food | 565 | 4,677 | 37 |
| Agriculture, forestry and fishing | 95 | 1,131 | 26 |
| Source: 2012, 2013 and 2014 Commercial Victimisation Survey, Home Office | |||
| Notes: | |||
| 1. Data may not sum to totals shown due to rounding. | |||
Download this table Table 28: Crime experienced by businesses, by industry sector, 2012, 2013 and 2014 CVS
.xls (84.0 kB)Notes for Commercial Victimisation Survey
- The Home Office’s 2014 findings: Crimes against businesses: Findings from the 2014 Commercial Victimisation Survey
- The Home Office’s 2013 findings: Headline findings from the 2013 Commercial Victimisation Survey and Detailed findings from the 2013 Commercial Victimisation Survey
- The Home Office 2012 findings: Headline findings from the 2012 Commercial Victimisation Survey and Detailed findings from the 2012 Commercial Victimisation Survey
21. Data sources – coverage and coherence
Crime Survey for England and Wales
The Crime Survey for England and Wales (CSEW) is a face-to-face survey in which people resident in households in England and Wales are asked about their experiences of crime in the 12 months prior to the interview. It covers both children aged 10-15 and adults aged 16 and over, but does not cover those living in group residences (such as care homes, student halls of residence and prisons), or crimes against commercial or public sector bodies. Respondents are interviewed in their own homes by trained interviewers using a structured questionnaire that is administered on a laptop computer using specialist survey software. The questions asked do not use technical terms or legal definitions, but are phrased in plain English language.
The information collected during the interview is later reviewed by a team of specialist coders employed by the survey contractors (currently TNS-BMRB) who determine whether or not what was reported amounts to a crime in law and, if so, what offence has been experienced. This ‘offence coding’ aims to reflect the Home Office Counting Rules for recorded crime that govern how the police record offences reported to them. The CSEW is able to capture all offences experienced by those interviewed, not just those that have been reported to, and recorded by, the police. It covers a broad range of victim-based crimes experienced by the resident household population. However, there are some serious but relatively low volume offences, such as homicide and sexual offences, which are not included in its main estimates. The survey also currently excludes fraud and cyber crime though there is ongoing development work to address this gap, described in the methodological note Work to extend the Crime Survey for England and Wales to include fraud and cyber crime. This infographic sets out what is and is not covered by the CSEW.
Since it began, the CSEW has been conducted by an independent (from government or the police) survey research organisation using trained interviewers to collect data from sampled respondents. The interviewers have no vested interest in the results of the survey. For the crime types and population groups it covers, the CSEW has a consistent methodology and is unaffected by changes in levels of public reporting to the police, recording practice or police activity. As such, the survey is widely seen to operate as an independent reality-check of the police figures. The independence of the survey has been further strengthened by the transfer of responsibility from the Home Office to us in April 2012.
The CSEW has a higher number of reported offences than police recorded crime as the survey is able to capture all offences by those interviewed, not just those that have been reported to the police and then recorded. However, it does cover a narrower range of offences than the police recorded crime collection.
The CSEW has necessary exclusions from its main count of crime (for example, homicide, crimes against businesses and other organisations, and drug possession). The survey also excludes sexual offences from its main crime count given the sensitivities around reporting this in the context of a face-to-face interview. However, at the end of the main interview there is a self-completion element (via a computer), where adults aged 16 to 59 are asked about their experience of domestic and sexual violence, and these results are reported separately1.
Since the survey started in 1982 (covering crime experienced in 1981) a core module of victimisation questions has asked about a range of offences experienced either by the household (such as burglary) or by the individual respondent (such as robbery). The offences covered by this core module have remained unchanged since the survey started.
The offence of fraud, whether committed in traditional or newer ways (such as over the internet), is not part of this core module. Other offences which are committed online (such as harassment) are also not covered by the existing questions. However, supplementary modules of questions are included in the survey in an attempt to better understand the nature of these newer types of crime. In addition, methodological work is ongoing to explore the feasibility of adding questions to the core module to cover newer types of crime2.
The survey is based on a sample of the population, and therefore estimates have a margin of quantifiable (and non quantifiable) error associated with them. The latter includes:
- when respondents have recalled crimes in the reference period that actually occurred outside that period (‘telescoping’)
- crimes that did occur in the reference period that were not mentioned at all (either because respondents failed to recall a fairly trivial incident or, conversely, because they did not want to disclose an incident, such as a domestic assault)
- respondents saying they reported a crime to the police when they did not (a ‘socially desirable’ response)
- some incidents reported during the interview being miscoded (‘interviewer/coder error’)
In 2009, the CSEW was extended to cover children aged 10 to 15, and this release also incorporates results from this element of the survey. However, the main analysis and commentary is restricted to adults and households due to the long time series for which comparable data are available.
The CSEW has a nationally representative sample of around 35,000 adults and 3,000 children (aged 10 to 15 years) per year. The response rates for the survey in 2013/14 were 75% for adults and 68% for children. The survey is weighted to adjust for possible non-response bias and to ensure the sample reflects the profile of the general population. The CSEW technical report has more details of the methodology.
Police recorded crime and other sources of crime statistics
Police recorded crime figures are supplied by the 43 territorial police forces of England and Wales, plus the British Transport Police, via the Home Office, to us. The coverage of police recorded crime is defined by the Notifiable Offence List3, which includes a broad range of offences, from murder to minor criminal damage, theft and public order offences. However, there are some, mainly less serious offences, that are excluded from the recorded crime collection. These ‘non-notifiable’ crimes include many incidents that might generally be considered to be anti-social behaviour, but that may also be crimes in law (including by-laws) such as littering, begging and drunkenness. Other non-notifiable offences include driving under the influence of alcohol, parking offences and TV licence evasion. These offences are not covered in either of the main two series and are separately reported on in this release to provide additional context.
Police recorded crime is the primary source of sub-national crime statistics and for relatively serious, but low volume, crimes that are not well measured by a sample survey. It covers victims (including, for example, residents of institutions and tourists as well as the resident population) and sectors (for example, commercial bodies) excluded from the CSEW sample. Recorded crime has a wider coverage of offences, for example covering homicide, sexual offences, and crimes without a specific, identifiable victim (referred to as ‘Other crimes against society’) not included in the main CSEW crime count. Police recorded crime also provides good measures of well-reported crimes, but does not cover any crimes that are not reported to, or discovered by, the police. It is also affected by changes in reporting and recording practices. Like any administrative data, police recorded crime will be affected by the rules governing the recording of data, by the systems in place, and by operational decisions in respect of the allocation of resources.
As well as the main police recorded crime series, there are additional collections providing detail on offences involving the use of knives and firearms, which are too low in volume to be measured reliably by the CSEW.
This quarterly statistical bulletin also draws on data from other sources to provide a more comprehensive picture. These include incidents of anti-social behaviour recorded by the police (which fall outside the coverage of notifiable offences), non-notifiable crimes dealt with by the courts (also outside the coverage of recorded crime or the CSEW), crime reports from the National Fraud Intelligence Bureau and the results of the Commercial Victimisation Surveys (based on a nationally representative sample of business premises in selected sectors each year).
More details of these sources can be found in the User Guide to Crime Statistics for England and Wales. Information on UK and international comparisons can be found in the ‘International and UK comparisons’ section.
Strengths and limitations of the CSEW and police recorded crime
| Survey for England and Wales | |
| Strengths | Large nationally representative sample survey which provides a good measure of long-term trends for the crime types and the population it covers (that is, those resident in households) |
| Consistent methodology over time | |
| Covers crimes not reported to the police and is not affected by changes in police recording practice; therefore is a more reliable measure of long term trends | |
| Coverage of survey extended in 2009 to include children aged 10 to 15 resident in households | |
| Independent collection of crime figures | |
| Limitations | Survey is subject to error associated with sampling and respondents recalling past events |
| Excludes crimes against businesses and those not resident in households (for example, residents of institutions and visitors) | |
| Headline estimates exclude offences that are difficult to estimate robustly (such as sexual offences) or that have no victim who can be interviewed (for example, homicides, and drug offences) | |
| Excludes fraud and cyber crime | |
| Police recorded crime | |
| Strengths | Has wider offence coverage and population coverage than the CSEW |
| Good measure of offences that are well-reported to the police | |
| Is the primary source of local crime statistics and for lower-volume crimes (for example, homicide) | |
| Provides whole counts (rather than estimates that are subject to sampling variation) | |
| Time lag between occurrence of crime and reporting results tends to be short, providing an indication of emerging trends | |
| Limitations | Excludes offences that are not reported to, or not recorded by, the police and does not include less serious offences dealt with by magistrates courts (for example, motoring offences) |
| Trends can be influenced by changes in recording practices or police activity | |
| There are concerns about the quality of recording – crimes may not be recorded consistently across police forces and so the true level of recorded crime may be understated | |
| Not possible to make long-term comparisons due to fundamental changes in recording practice introduced in 1998 and 2002/034 | |
Download this table Strengths and limitations of the CSEW and police recorded crime
.xls (84.5 kB)Notes for data sources – coverage and coherence
- Focus on: Violent Crime and Sexual Offences, 2012/13 has more detailed information.
- Discussion paper on the coverage of crime statistics has more information.
- The Notifiable Offence List includes all indictable and triable-either-way offences (offences which could be tried at a crown court) and a few additional closely related summary offences (which would be dealt with by magistrates’ courts). Appendix 1 of the User Guide has more information on the classifications used for notifiable crimes recorded by the police.
- Section 3.3 of the User Guide has more information.
22. Accuracy of the statistics
Being based on a sample survey, Crime Survey for England and Wales (CSEW) estimates are subject to a margin of error. Unless stated otherwise, all changes in CSEW estimates described in the main text are statistically significant at the 5% level. Since the CSEW estimates are based on a sample survey, it is good practice to publish confidence intervals alongside them; these provide a measure of the reliability of the estimates. Details of where these are published, including further information on statistical significance can be found in Chapter 8 of the User Guide.
Police recorded crime figures are a by-product of a live administrative system which is continually being updated as incidents are logged as crimes and subsequently investigated. Some incidents initially recorded as crime may, on further investigation, be found not to be a crime (described as being “no crimed”). Other justifications for a previously recorded crime being “no crimed” include, an incident being recorded in error, or transferred to another force. Some offences may change category, for example from theft to robbery (Section 3.2 of the User Guide has further details of the process involved from recording a crime to the production of statistics). The police return provisional figures to the Home Office on a monthly basis and each month they may supply revised totals for previously supplied months. The Home Office Statistics Unit undertake a series of validation checks on receipt of the data and query outliers with forces who may then re-submit data. Details of these validation checks are given in Section 3.3 of the User Guide, and the differences in data published between the current and preceding publications can be found in Table QT1a (202 Kb Excel sheet) .
Police recording practice is governed by the Home Office Counting Rules (HOCR) and the National Crime Recording Standard (NCRS). The HOCR have existed in some form since the 1920s, with substantial changes in 1998.
The NCRS was introduced in April 2002 following a critical report from Her Majesty’s Inspectorate of Constabulary (HMIC) in 2000 (Povey, 2000), which showed there was a problem with differing interpretation of the HOCR that resulted in inconsistent recording practices across forces.
The Audit Commission carried out regular independent audits of police data quality between 2003/04 and 2006/07. In their final assessment, published in September 2007 (Audit Commission, 2007), they commented that “The police have continued to make significant improvements in crime recording performance and now have better quality crime data than ever before”.
However, both the UK Statistics Authority (2010) and the National Statistician (2011) have highlighted concerns about the absence of such periodic audits. A HMIC quality review in 2009 into the way in which police forces record the most serious violence (which at the time was part of a central government target) found some variation in recording, which they partly attributed to the lack of independent monitoring of crime records. In line with a recommendation by the National Statistician, HMIC carried out a review of police crime and incident reports in all forces in England and Wales during 2011 (HMIC, 2012) and a full national inspection of crime data integrity was undertaken during 2014 (HMIC, 2014).
ONS analysis published in January 2013 (175.4 Kb Pdf) used a ‘comparable’ sub-set of offences covered by both the CSEW and police recorded crime in order to compare the relationship between the two series. This analysis showed that between 2002/03 and 2006/07 the reduction in the volume of crime measured by the two series was similar, but between 2006/07 and 2011/12 the gap between the two series widened, with the police recorded crime series showing a faster rate of reduction. A possible explanation for this is a gradual erosion of compliance with the NCRS, such that a growing number of crimes reported to the police are not being captured in crime recording systems. The Analysis of Variation in Crime trends methodological note has more details.
Statistics based on police recorded crime data don’t currently meet the required standard for designation as National Statistics.
Additionally, as part of the inquiry by the Public Administration Select Committee (PASC) into crime statistics allegations of under-recording of crime by the police have been made. In the PASC inquiry, the Chief Inspector of Constabulary, Sir Tom Winsor, outlined how HMIC would be undertaking an inspection of the integrity of police recorded crime during 2014. Findings from the inspections of crime recording processes and practices have helped provide further information on the level of compliance across England and Wales.
HMIC’s inspection methodology involved audits of a sample of reports of crime received either through incidents reported by the public, crimes directly reported to a police crime bureau, and those reports referred by other agencies directly to specialist departments within a force. HMIC’s aim was to check whether correct crime recording decisions were made in each case. Inspections were carried out between December 2013 and August 2014; a total of 10,267 reports of crime recorded between November 2012 and October 2013 across all 43 police forces in England and Wales were reviewed.
The final report on findings from the HMIC inspections, Crime-recording: making the victim count, was published on 18 November 2014 and separate crime data integrity force reports for each of the 43 police forces in England and Wales were published on 27 November 2014.
Based on an audit of a large sample of records, HMIC concluded that, across England and Wales as a whole, an estimated 1 in 5 offences (19%) that should have been recorded as crimes were not. The greatest levels of under-recording were seen for violence against the person offences (33%) and sexual offences (26%). However, there was considerable variation in the level of under-recording across the different offence types investigated. For other crime types: an estimated 14% of criminal damage and arson offences that should have been recorded as crimes were not; 14% of robbery offences; 11% of burglary offences; and 17% of other offences (excluding fraud).
The final HMIC report outlines several recommendations to strengthen recording practices in forces including improved training for those involved in crime recording, better auditing and tightening of recording processes. More detail can be found in the User Guide.
Potential future increases in police recorded crime data are likely due to the implementation of the HMIC recommendations, rather than a genuine increase in the levels of crime, so trends should be interpreted with caution.
Further evidence suggesting that there has been a recent improvement in compliance with the NCRS can be seen from updated analysis comparing trends in the CSEW and police recorded crime (presented in Section 4.2 of the User Guide). This shows that the gap between the two series is narrowing; suggesting that improvements to recording practices may be partly responsible for increases in recorded crime.
Interpreting data on police recorded crime
The renewed focus on the quality of crime recording means that caution is needed when interpreting statistics on police recorded crime. While we know that it is likely that improvements in compliance with the NCRS have led to increases in the number of crimes recorded by the police it is not possible to quantify the scale of this, or assess how this effect varied between different police forces. Police recorded crime for England and Wales as a whole has increased by 2% when compared with the previous year, and 21 police forces have recorded overall increases in levels of crime.
Apparent increases in police force area data may reflect a number of factors including tightening of recording practice, increases in reporting by victims and also genuine increases in the levels of crime1.
It is thought that incidents of violence are more open to subjective judgements about recording and thus more prone to changes in police practice. A number of forces have also shown large increases in sexual offences, which are likely to be due to the ‘Yewtree effect’, although improved compliance with recording standards for sexual offences is also likely to have been a factor.
Notes for accuracy of the statistics
- Further information on possible explanations of increasing police recorded crime levels can be found in Chapter 3 of the User Guide.
23. Users of crime statistics
There is significant interest in crime statistics and a diverse range of users. These include elected national and local representatives (such as MPs, Police and Crime Commissioners and local councillors), police forces, those delivering support or services to victims of crime, lobby groups, journalists, academic researchers, teachers and students.
These statistics are used by central and local government and the police service for planning and monitoring service delivery and for resource allocation. The statistics are also used to inform public debate about crime and the public policy response to it. Further information about the uses of crime statistics is available in the Crime Statistics Quality and Methodology Information report.
From November 2014 to January 2015 we conducted a user engagement exercise to help assess the extent to which police recorded crime statistics meet users’ needs in light of concerns over the quality of the data raised by Her Majesty's Inspectorate of Constabulary (HMIC) in its recent report Crime Recording: making the victim count. We asked users if the findings would affect how people used the data, and how we might improve the statistics to better meet user needs. Feedback from users who took part indicated that:
- The majority will continue to use Police Recorded Crime Statistics, despite some concerns over their accuracy.
- Many said that it was now more important to continue to have clear commentary in statistical bulletins to highlight the limitations of the data.
- Many said they would use the data more cautiously in future and apply more caveats.
- The majority used Police Recorded Crime data, because it is the best source available or the only data that fulfils their purpose.
- The majority thought it was very important or fairly important to have an improved level of accuracy for them to continue using the statistics.
A fuller report detailing responses to the user engagement exercise will be published in May 2015.
Back to table of contents24. International and UK comparisons
There are currently no recognised international standards for crime recording. International comparisons are limited due to the differing legal systems that underpin crime statistics and processes for collecting and recording crimes.
Crimes recorded by the police
The system for recording crime in England and Wales by the police is widely recognised by international standards to be one of the best in the world. Few other jurisdictions have attempted to develop such a standardised approach to crime recording and some of those that have base their approach on the England and Wales model (for example, Australia, Northern Ireland). Therefore, it is difficult to make international comparisons of levels of recorded crime given the lack of consistency in definitions, legal systems and police or criminal justice recording practices.
The legal system in Northern Ireland is based on that of England and Wales and the Police Service for Northern Ireland (PSNI) has the same notifiable offence list for recorded crime as used in England and Wales. In addition, the PSNI has adopted the National Crime Recording Standard (NCRS) and Home Office Counting Rules for recorded crime that applies in England and Wales. Therefore there is broad comparability between the recorded crime statistics in Northern Ireland and England and Wales.
However, recorded crime statistics for England and Wales are not directly comparable with those in Scotland. The recorded crime statistics for Scotland are collected on the basis of the Scottish Crime Recording Standard, which was introduced in 2004. Like its counterpart in England and Wales, it aims to give consistency in crime recording. The main principles of the Scottish Crime Recording Standard are similar to the National Crime Recording Standard for England and Wales with regard to when a crime should be recorded.
However, there are differences between the respective counting rules. For example, the ‘Principal Crime Rule’ in England and Wales states that if a sequence of crimes in an incident, or alternatively a complex crime, contains more than 1 crime type, then the most serious crime should be counted. For example, an incident where an intruder breaks into a home and assaults the sole occupant would be recorded as 2 crimes in Scotland, while in England and Wales it would be recorded as 1 crime.
Differences in legislation and common law have also to be taken into account when comparing the crime statistics for England/Wales and Scotland.
Victimisation surveys
A number of countries run their own national victimisation surveys and they all broadly follow a similar model to the Crime Survey for England and Wales (CSEW) in attempting to obtain information from a representative sample of the population resident in households about their experience of criminal victimisation. The US National Crime and Victimisation Survey (NCVS) is the longest running, established in 1973 and there are similar surveys in other countries including Australia, Canada, Finland, France, Germany, the Netherlands, Sweden and New Zealand. However, while these surveys have a similar objective they are not conducted using a standard methodology. Sampling (frames and of households/individuals) and modes of interview (for example face-to-face interviewing, telephone interviewing, self-completion via the web) differ, as do the crime reference periods (last 5 years, last 12 months, last calendar year) over which respondents are asked about their victimisation experience. Similarly, there is a lack of standardisation in question wording and order. Response rates vary considerably across the world, as do methods to adjust for any resulting possible non-response bias; therefore, it becomes extremely difficult to make valid comparisons between the surveys.
There have been attempts in the past to run international surveys on a standard basis and the International Crime and Victimisation Survey (ICVS) was initiated by a group of European criminologists with expertise in national crime surveys. The survey aimed to produce estimates of victimisation that could be used for international comparisons. The first survey was run in 1989 and was repeated in 1992, 1996 and 2004/5. All surveys were based upon a 2,000 sample of the population, and in most countries, surveys were carried out with computer-assisted telephone interviewing. A pilot ICVS-2, intended to test alternative and cheaper modes of data collection including self-completion via the web, was carried out in a limited number of countries in 2010.
However, despite the attempt to obtain a standardised and comparable approach to all of the surveys, this was never successfully achieved. While a standard questionnaire was used in all countries, alongside a standard mode of interviewing, important differences remained in the approach to sampling, translation of questions into different national languages, interview lengths and response rates which make comparisons problematic.
Both Scotland and Northern Ireland have their own separate victimisation surveys that, like the CSEW, complement their recorded crime figures.
The Northern Ireland Crime Survey (NICS) closely mirrors the format and content of the CSEW, using a very similar methodology with continuous interviewing and a face-to-face interview with a nationally representative sample of adults (16 years and over), using a similar set of questions. Thus, results from the two surveys are broadly comparable.
The Scottish Crime and Justice Survey (SCJS) also follows a similar format to the CSEW, having a shared antecedence in the British Crime Survey (whose sample during some rounds of the survey in the 1980s covered Scotland, south of the Caledonian Canal). There are differences in the crimes/offence classifications to reflect the differing legal systems, but the results from the surveys are broadly comparable.
Back to table of contents