Table of contents
- Main points
- About this release
- Upcoming changes to the Quarterly Survey of Capital Expenditure and other methodological information
- Adjustments, revisions and response rates
- Economic background
- Gross fixed capital formation and business investment
- Summary tables
- Where to find more of our data
- Background notes
- Methodology
1. Main points
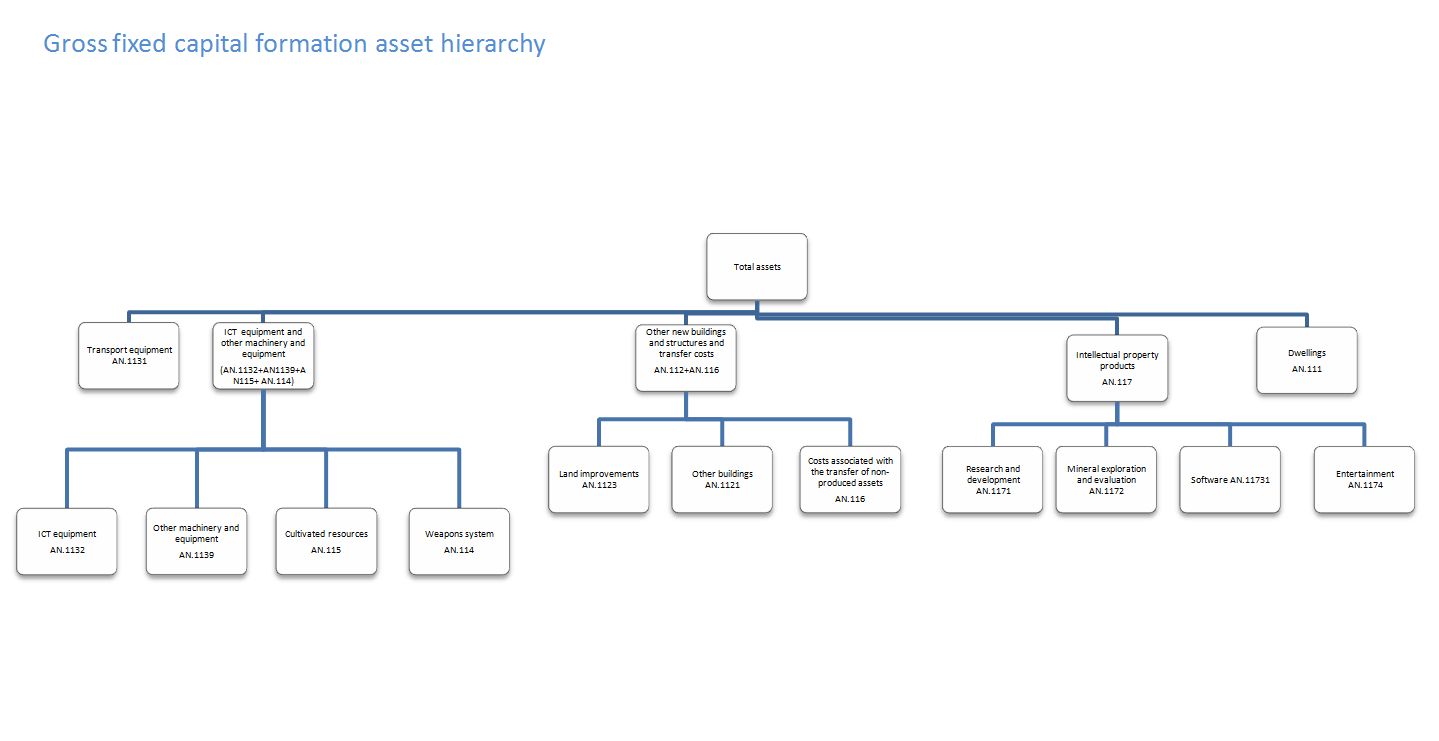
The estimates in this release are short-term indicators of investment in assets, such as dwellings, transport equipment, machinery, buildings and intangible assets. This release covers not only business investment, but asset breakdowns of total gross fixed capital formation (GFCF), of which business investment is a component
All investment data referred to in this bulletin are estimates of seasonally adjusted chained volume measures. The earliest period being revised in this release is Quarter 1 (Jan to Mar) 2014
In Quarter 4 (Oct to Dec) 2014, GFCF was estimated to have decreased to £73.6 billion compared with Quarter 3 (July to Sept) 2014. This is a decrease of £0.5 billion (0.6%), the first decrease for GFCF since Quarter 3 (July to Sept) 2012. Business investment decreased to £45.0 billion compared with the previous quarter, an estimated fall of £0.4 billion (0.9%)
In Quarter 4 (Oct to Dec) 2014 GFCF was estimated to have increased by 5.1% compared with Quarter 4 (Oct to Dec) 2013 whilst business investment increased by an estimated 3.7% compared with Quarter 4 (Oct to Dec) 2013. This was the 19th consecutive quarter of growth compared with the same quarter of the previous year
In 2014, GFCF increased by an estimated 7.8% since 2013, to £292.8 billion. Business investment increased by an estimated 7.5% since 2013, to an estimated £179.7 billion, the highest level in the published time series
In 2014, ICT equipment and other machinery and equipment was at its highest annual level in the published time series (£67.7 billion), 14.8% higher than in 2013
2. About this release
The estimates in this release are short-term indicators of investment in assets in the UK, such as dwellings, transport equipment, machinery, buildings and intellectual property products. This release covers not only business investment, but asset and sector breakdowns of total gross fixed capital formation (GFCF), of which business investment is a component.
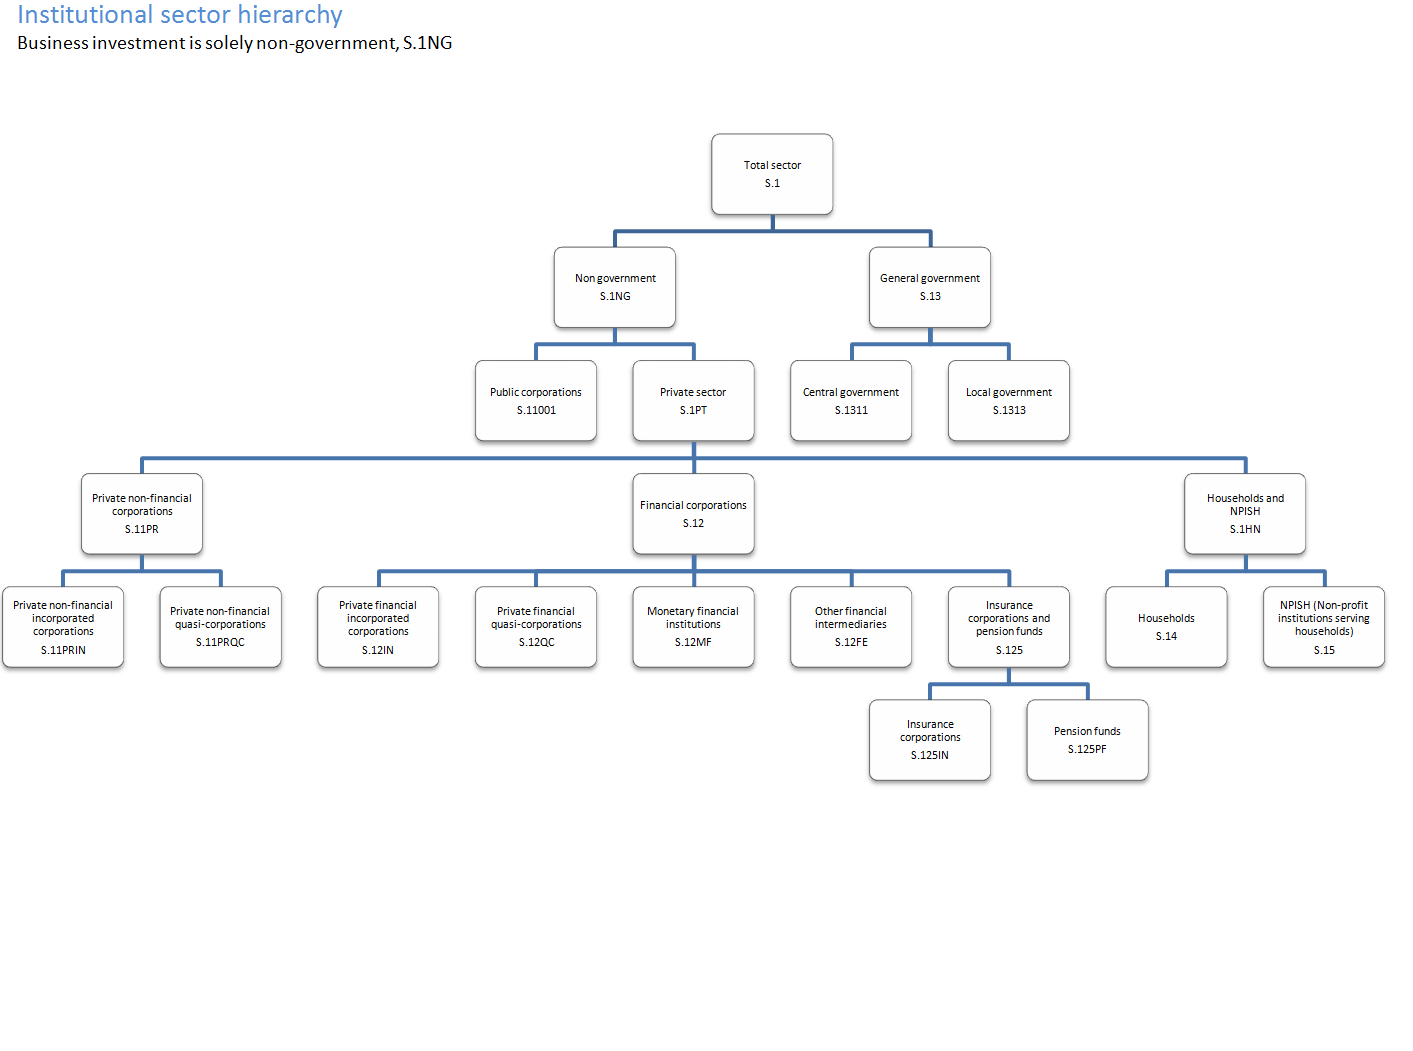
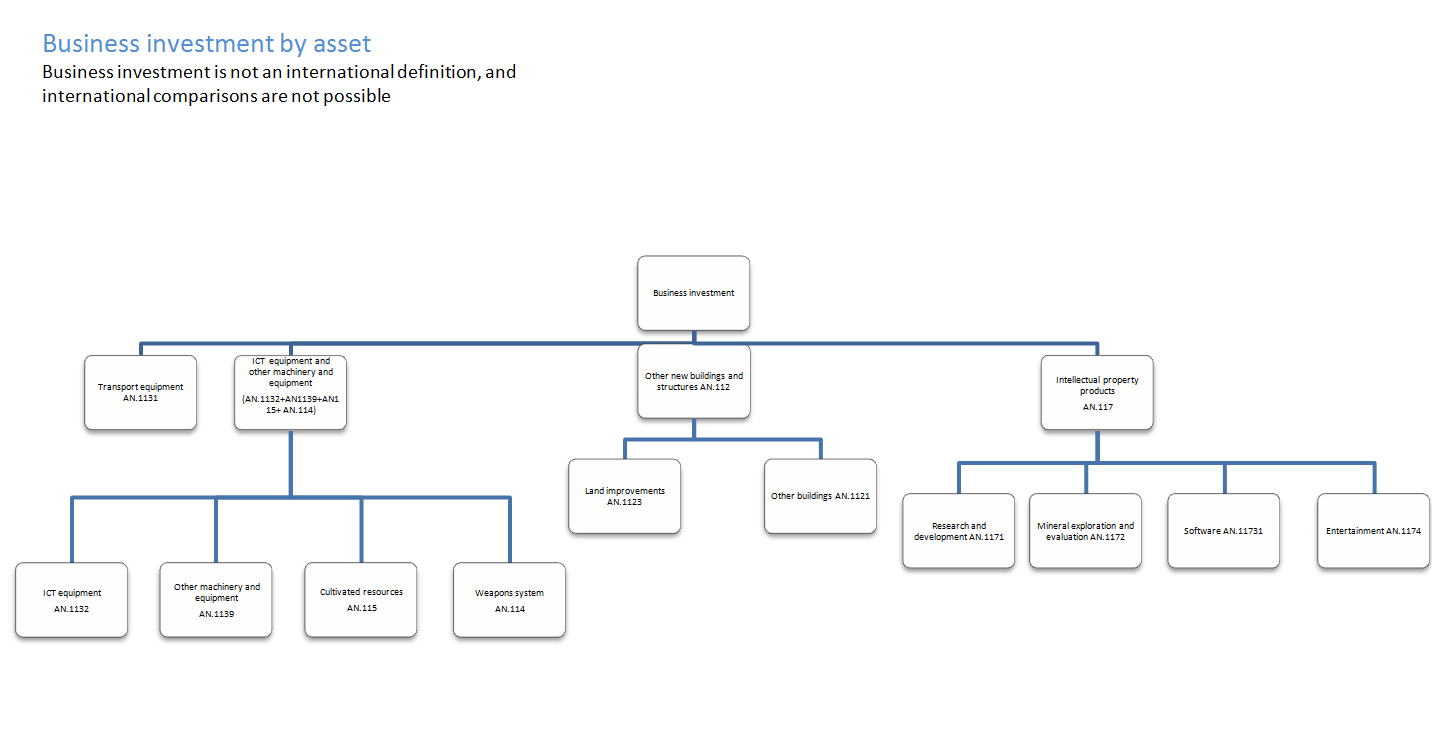
Business investment is net investment by the private sector and public corporations, in transport, information, technology and communications (ICT) equipment, other machinery and equipment, cultivated assets, intellectual property products (IPP, which includes investment in software, research and development, artistic originals and mineral exploration), and buildings and other structures. It doesn’t include investment by central or local government, investment in dwellings or the costs associated with the transfer of non-produced assets (such as land). A full sector and asset hierarchy can be found in the background notes. It should be noted that business investment is not an international concept, and therefore it shouldn’t be used to make international comparisons.
All investment data referred to in this bulletin are estimates of seasonally adjusted chained volume measures.
Back to table of contents3. Upcoming changes to the Quarterly Survey of Capital Expenditure and other methodological information
Changes to the Quarterly Survey of Capital Expenditure in Quarter 1 (Jan to Mar) 2015
We will be implementing changes to the Quarterly Survey of Capital Expenditure (Capex) from Quarter 1 (Jan to Mar) 2015. These include changes that are legally required under the European System of Accounts 2010 (ESA 2010) and improvements to the questionnaire design. The changes that will be implemented in the estimates of gross fixed capital formation (GFCF) and its components, from Quarter 1 (Jan to Mar) 2015, include:
removal of the lower limit of £500 in reporting GFCF
the inclusion of small tools used in production within the definition of GFCF
improvements to the questionnaire design through question testing with respondents
a change of name, from Capex, to the Quarterly Acquisitions and Disposals of Capital Assets Survey (QCAS), which states the purpose of the survey more clearly, in line with good practice
The impact of these changes will not be known until the data are collected. The impact will be monitored, and further information will be available in the Business Investment, Quarter 1 (Jan to Mar) 2015 Provisional Results release on 28th May 2015.
The changes to the questionnaire also include some new questions. Data from these new questions will not be included in estimates of GFCF and its components until 2017, when 2 years of data are available for quality assurance. The article Changes to the Annual Business Survey, the Quarterly Survey of Capital Expenditure and the Survey into Business Spending on Capital Items, in 2015 (114.3 Kb Pdf) has more detail on these changes.
Further methodological information including upcoming changes for Blue Book 2015
Estimates in this release have been compiled under ESA 2010, in compliance with the UK’s legal obligations in producing the national accounts. Articles are available describing the methodology used to estimate GFCF and the impact of the changes implemented for ESA10 in September 2014.
An article was published on 26 March 2015, describing improvements to the deflation of the software asset, which will be implemented in the UK National Accounts (Blue Book) 2015, to be published in October 2015. This article includes an indicative impact assessment.
Changes to National Accounts for Blue Book 2015: the deflation of investment in software (522.5 Kb Word document) 26 March 2015
Investment - impact analysis of changes to the estimation of gross fixed capital formation and business investment for Blue Book 2014 (918.4 Kb Pdf) 30 September 2014
Gross Fixed Capital Formation and Business Investment – Impact of ESA10 Changes on Volume Measures (195.6 Kb Pdf) 30 June 2014
How Construction Price Indices are Used in Construction Statistics and Gross Fixed Capital Formation (80.7 Kb Pdf) 19 June 2014
Construction price indices: improvements 19 June 2014
Measuring and capitalising research and development in the UK National Accounts (349.1 Kb Pdf) 10 June 2014
Implementation framework for Research and Development in the United Kingdom National Accounts (206.7 Kb Pdf) 10 June 2014
Impact of ESA10 changes on current price GDP estimates 10 June 2014
Transition to ESA10: capitalising government spending on military weapons (179 Kb Pdf) 10 June 2014
Gross Fixed Capital Formation (Investment) - Changes for Blue Book 2014 (excluding ESA10) (157.8 Kb Pdf) 29 May 2014
Impact of ESA95 changes on current price GDP estimates 29 May 2014
Revised methodology and sources as a result of addressing Gross National Income reservations (105.1 Kb Pdf) 29 May 2014
Back to table of contents4. Adjustments, revisions and response rates
Adjustments
The largest component of the data collected to produce estimates of gross fixed capital formation (GFCF) and business investment comes from our Quarterly Survey of Capital Expenditure (Capex), which has a sample size of 27,500. Large capital expenditure tends to be reported later in the data collection period than smaller expenditure. This means that larger expenditures are often included in the revised (month 3) results, but are not reported in time for the provisional (month 2) results, leading to a tendency towards upwards revisions in the later estimates for business investment and GFCF. Following investigation of the impact of this effect, from Quarter 3 (July to Sept) 2013, we introduced a bias adjustment to Capex, and hence to GFCF and its components, in the provisional estimates.
A bias adjustment of £850 million was included in the provisional (month 2) release for Quarter 4 (Oct to Dec) 2014. This has been removed for the revised (month 3) release.
Forecast data
In this release, estimates of investment in research and development and in artistic originals have been forecast.
Revisions
The periods revised in this release are Quarter 1 (Jan to Mar) to Quarter 4 (Oct to Dec) 2014.
Revisions in this release are because of revisions to the source data, including:
revisions to Capex data due to an increased response rate
revisions to public corporations data
revisions to estimates of investment in new dwellings and improvements to dwellings
government investment data replacing forecasts
The most significant component of the upwards revisions to GFCF and business investment in this release is the revision to the Capex data, which impacted the Quarter 3 (July to Sept) and Quarter 4 (Oct to Dec) aggregates.
Survey response rates
Table 1 presents the revised (month 3) response rates for the Quarterly Survey of Capital Expenditure. The estimates in this release are based on the Quarter 4 (Oct to Dec) 2014 month 3 (revised) survey results.
Table 1: Response rates for Quarterly Survey of Capital Expenditure
| At month two (Provisional) | At month three (Revised) | ||||
| Period | Survey response rates / % | Period | Survey response rates / % | ||
| 2013 | Q4 | 80.0 | 2013 | Q4 | 91.9 |
| 2014 | Q1 | 76.2 | 2014 | Q1 | 90.7 |
| Q2 | 79.5 | Q2 | 91.3 | ||
| Q3 | 78.7 | Q3 | 91.7 | ||
| Q4 | 80.1 | Q4 | 87.6 | ||
| Source: Office for National Statistics | |||||
Download this table Table 1: Response rates for Quarterly Survey of Capital Expenditure
.xls (24.1 kB)5. Economic background
In Quarter 4 (Oct to Dec) 2014, business investment fell by 0.9% to £45.0 billion compared with Quarter 3 (July to Sept) 2014, when it was £45.4 billion. However, the annual level for 2014 is the highest in the published time series. It grew by 7.5% to £179.7 billion.
Gross fixed capital formation (GFCF) also fell in Quarter 4 (Oct to Dec) 2014, by 0.6% compared with Quarter 3 (July to Sept) 2014 to £73.6 billion. The annual level grew by 7.8% in 2014, to £292.8 billion, the highest annual level since 2007 (£294.9 billion).
Annually, net investment (acquisitions minus disposals) in ICT equipment and other machinery and equipment was at the highest level in the published time series, at £67.7 billion. It grew by 14.8% since 2013 (£59.0 billion). Investment in intellectual property products was also at its highest level in 2014, £66.0 billion, growing by 4.5% since 2013.
Asset and industry data collected from the Quarterly Survey of Capital Expenditure (Capex), are bench marked to the annual results from the Annual Business Survey (ABS). This makes up nearly two-thirds of business investment in current prices and can be used for a more detailed analysis of investment. There are 6 asset classes: hardware, software, transport equipment, mineral exploration and evaluation, other buildings and structures, and other machinery and equipment. The Capex estimates are in current prices, not seasonally adjusted.
Figure 1a shows the annual contribution to growth of each of the Capex assets (bench marked to ABS) from 2005 to 2014, in current prices. It shows that annual net investment grew by 8.0% in 2014, to £115.5 billion. This was the fifth consecutive year of annual growth. Other machinery and equipment was one of the main contributors to growth, accounting for 3.0 percentage points. The only asset with a higher contribution was other buildings and structures (3.1 percentage points). Investment in hardware and mineral exploration fell slightly, contributing negatively to the overall growth rate.
Figure 1a: Contributions to growth of net investment by asset (Capex benched to ABS), current prices
Coverage: UK
Source: Quarterly Survey of Capital Expenditure - Office for National Statistics
Download this chart Figure 1a: Contributions to growth of net investment by asset (Capex benched to ABS), current prices
Image .csv .xlsFigure 1b shows the annual Capex estimates for other machinery and equipment (current prices). Net annual investment in other machinery and equipment in 2014 was at its highest level since 2000, at £41.8 billion. In the quarterly estimates, net investment was also at a peak in Quarter 4 (Oct to Dec) 2014, £11.5 billion, the highest value since Quarter 4 (Oct to Dec) 2000 (current prices, not seasonally adjusted).
Annual growth in 2014 for other machinery and equipment was 8.3%, up from 1.8% in 2013, reaching a level of £41.8 billion in 2014 (Capex, current prices). The electricity, gas, steam and air conditioning supply industry contributed most to the annual growth. It accounted for 29% of the annual growth. The rental and leasing activities industry made up 17% of total other machinery and equipment growth and was the highest annual value on record for the industry, £1.8 billion. Annual net investment (Capex, current prices) in both of these industries fell in 2012 and 2013.
Figure 1b: Annual levels and growth rates of net investment in other machinery and equipment (Capex benched to ABS), current prices
Coverage: UK
Source: Quarterly Survey of Capital Expenditure - Office for National Statistics
Download this chart Figure 1b: Annual levels and growth rates of net investment in other machinery and equipment (Capex benched to ABS), current prices
Image .csv .xlsCapex estimates of net investment in mineral exploration in current prices are shown in figure 1c. In 2014, annual net investment in mineral exploration by the extraction of crude petroleum and natural gas industry fell by 18.7% to £1.0 billion; this is the second consecutive annual fall, and the steepest annual fall since 2006. Total net investment for all assets within the same industry fell by 0.3% between 2013 and 2014 to £12.2 billion. In Quarter 4 (Oct to Dec) 2014, total net investment by the industry fell by 7.4% to £3.0 billion (Capex, current prices, not seasonally adjusted).
Figure 1c: Annual levels and growth rates of net investment in mineral exploration (Capex benched to ABS), current prices
Coverage: UK
Source: Quarterly Survey of Capital Expenditure - Office for National Statistics
Download this chart Figure 1c: Annual levels and growth rates of net investment in mineral exploration (Capex benched to ABS), current prices
Image .csv .xlsThe weak investment in this asset was also noted by the Agents’ Summary of Business Conditions for December, which reported that UK oil and gas investment had shown tentative signs of weakening due to falling oil prices and high exploration costs, partly arising because of the reduction of oil reserves in the North Sea. As a consequence of this latter effect, the output of this industry has been on a long term downwards trend. The Index of Production for January shows that oil and gas extraction fell by 2.4% in 2014.
The data used in this analysis, including a full breakdown of net investment by industry sector and asset, can be found at: Net investment by industry sector and asset, from the Quarterly Survey of Capital Expenditure (Capex) estimates, benched to the Annual Business Survey, Quarter 1 (Jan to Mar) 1997 to Quarter 4 (Oct to Dec) 2014.
Back to table of contents6. Gross fixed capital formation and business investment
Figure 2: Annual gross fixed capital formation chained volume measures
Reference year: 2011, Coverage: UK
Source: Quarterly Survey of Capital Expenditure - Office for National Statistics
Download this chart Figure 2: Annual gross fixed capital formation chained volume measures
Image .csv .xls
Figure 3: Quarterly gross fixed capital formation chained volume measures
Reference year: 2011, Seasonal adjustment: seasonally adjusted, Coverage: UK
Source: Quarterly Survey of Capital Expenditure - Office for National Statistics
Download this chart Figure 3: Quarterly gross fixed capital formation chained volume measures
Image .csv .xls
Figure 4: Annual business investment chained volume measures
Reference year: 2011, Coverage: UK
Source: Quarterly Survey of Capital Expenditure - Office for National Statistics
Download this chart Figure 4: Annual business investment chained volume measures
Image .csv .xls
Figure 5: Quarterly business investment chained volume measures
Reference year: 2011, Seasonal adjustment: seasonally adjusted, Coverage: UK
Source: Quarterly Survey of Capital Expenditure - Office for National Statistics
Download this chart Figure 5: Quarterly business investment chained volume measures
Image .csv .xlsFigure 5 shows a large spike in business investment Quarter 2 (Apr to June) 2005. This is due to the transfer of British Nuclear Fuels Ltd (BNFL). In April 2005, nuclear reactors were transferred from BNFL to the Nuclear Decommissioning Authority (NDA). BNFL is classified as a public corporation in National Accounts, while the NDA is a central government body. The business investment series includes investment by public corporations but not government spending, with the positive spike therefore reflecting the £15.6 billion transfer. More information on the transfer of BNFL can be found in the background notes under section 3, ‘Further information on methodology’.
Back to table of contents7. Summary tables
Total GFCF decreased by an estimated £451m (0.6%) in Quarter 4 (Oct to Dec) 2014 compared with the previous quarter, but is still 5.1% higher than Quarter 4 (Oct to Dec) 2013. All sectors show positive growth of at least 3.0% compared with Quarter 4 (Oct to Dec) 2013. In Quarter 4 (Oct to Dec) 2014, net investment by general government saw the biggest increase compared with the previous quarter, rising by an estimated £173 million (1.7%). This was offset by an estimated decrease in business investment of £420 million (0.9%) and an estimated decrease in private sector dwellings of £199 million (1.4%).
Table 2a: Total gross fixed capital formation by institutional sector
| % change | £ million | |||
| Most recent quarter on previous quarter | Most recent quarter on a year earlier | Most recent level ** | Level change from previous quarter | |
| Gross fixed capital formation | -0.6 | 5.1 | 73,618 | -451 |
| Business investment | -0.9 | 3.7 | 44,967 | -420 |
| General government | 1.7 | 9.7 | 10,372 | 173 |
| Public corporations dwellings | -0.7 | 8.9 | 831 | -6 |
| Public corporations cost of ownership transfer on non-produced assets | -4.2 | 3.6 | -114 | 5 |
| Private sector dwellings | -1.4 | 6.6 | 13,873 | -199 |
| Private sector cost of ownership transfer on non-produced assets | -0.1 | 3.0 | 3,689 | -4 |
| Source: Office for National Statistics | ||||
| Notes: | ||||
| 1. ** Series may not sum to totals due to rounding | ||||
Download this table Table 2a: Total gross fixed capital formation by institutional sector
.xls (33.8 kB)Net investment in intellectual property products increased by an estimated £490 million (3.0%) in Quarter 4 (Oct to Dec) 2014, compared with the previous quarter. This was offset by a decrease in both transport equipment (£431 million, 12.1%) and ICT equipment and other machinery (£384 million, 2.2%) compared with Quarter 3 (July to Sept) 2014.
However, in 2014, net investment in ICT equipment and other machinery and equipment was at its highest annual level since 1997 (£67.7 billion), 14.8% higher than in 2013. Net investment in intellectual property products (IPP) was also at its highest annual level since 1997, at £66.0 billion, an increase of 4.5% since 2013. The largest component of this increase in IPP came from investment in software.
Table 2b: Total gross fixed capital formation by asset
| % change | £ million | |||
| Most recent quarter on previous quarter | Most recent quarter on a year earlier | Most recent level ** | Level change from previous quarter | |
| Gross fixed capital formation | -0.6 | 5.1 | 73,618 | -451 |
| Transport equipment | -12.1 | -7.7 | 3,141 | -431 |
| ICT equipment and other machinery and equipment | -2.2 | 15.6 | 17,050 | -384 |
| Dwellings | -1.4 | 6.9 | 14,743 | -205 |
| Other buildings and structures and transfer costs | 0.4 | 0.0 | 22,010 | 79 |
| Intellectual property products | 3.0 | 3.5 | 16,674 | 490 |
| Source: Office for National Statistics | ||||
| Notes: | ||||
| 1. ** Series may not sum to totals due to rounding | ||||
Download this table Table 2b: Total gross fixed capital formation by asset
.xls (39.4 kB)8. Where to find more of our data
Gross fixed capital formation by detailed industry and asset (508 Kb Excel sheet) Detailed annual breakdown of gross fixed capital formation in current prices, chained volume measures, non-seasonally adjusted and seasonally adjusted for 1997 to 2013. Consistent with the UK Annual National Accounts (Blue Book) 2014.
UK National Accounts (Blue Book) Chapter 9 Gross fixed capital formation by institutional sectors and assets, in current prices, chained volume measures, non-seasonally adjusted and seasonally adjusted. Annually from 1987 to 2014, total gross fixed capital formation data is available back to 1948. Quarterly from Quarter 1 (Jan to Mar)1997 to Quarter 4 (Oct to Dec) 2014.
Business investment by industry and asset Detailed breakdown of business investment by industry and asset, in current prices, chained volume measures, non-seasonally adjusted and seasonally adjusted. Annually for 1997 to 2014 and quarterly for Quarter 1 (Jan to Mar) 1997 to Quarter 4 (Oct to Dec) 2014.
UK Economic Accounts Gross fixed capital formation by institutional sector in current prices, not seasonally adjusted and seasonally adjusted. Annually for 1997 to 2014 and quarterly for Quarter 1 (Jan to Mar) 1997 to Quarter 4 (Oct to Dec) 2014.
We also publish additional analyses of gross fixed capital formation, business investment, and the Quarterly Survey of Capital Expenditure, which have been created in response to ad hoc user requests. These are available to download free from our website. Below is a list of the most recent ad hoc requests, together with a link to the web pages from which they can be downloaded. Enquiries about ad hoc requests may be made to gcf@ons.gov.uk.
Note: all datasets below have been updated from Quarter 1 (Jan to Mar) 1997 to be consistent with the UK Annual National Accounts (Blue Book) 2014.
Research and development price index for gross fixed capital formation (33 Kb Excel sheet) This time series is derived from the Research and Development dataset and is based on actual current price values up to and including 2012, all periods subsequent have been forecast using X-13-ARIMA-SEATS. The base year for this analysis is 2005. This price index (deflator) is calculated using a weighted labour, capital and material prices and excludes a productivity adjustment. Data is consistent with Business Investment Quarter 4 (Oct to Dec) 2014 Revised Results.
Regional gross fixed capital formation, 2000-2012 (110 Kb Excel sheet) Regional gross fixed capital formation by industry sector at NUTS1 and NUTS2 regional breakdown levels. Annually from 2000 to 2012.
Gross fixed capital formation quarterly weapons analysis (181.5 Kb Excel sheet) Quarterly gross fixed capital formation data relating to spending on weapons systems. Quarter 1 (Jan to Mar) 1997 to Quarter 4 (Oct to Dec) 2014. Consistent with Business Investment Quarter 4 (Oct to Dec) 2014 Provisional Results.
Private sector investment in computer hardware (38 Kb Excel sheet) A time series of investment in computer hardware by the private sector broken down by industry; current price, not seasonally adjusted for Quarter 1 (Jan to Mar) 1997 to Quarter 4 (Oct to Dec) 2014. Consistent with Business Investment Quarter 4 (Oct to Dec) 2014 Provisional Results.
Total business investment and general government data excluding British Nuclear Fuels Ltd (BNFL) in Quarter 2 (Apr to June) 2005 (48 Kb Excel sheet) Gross fixed capital formation estimates for total business investment and general government, excluding British Nuclear Fuels Ltd (BNFL) in Quarter 2 (Apr to June) 2005; current price, chained volume measure, seasonally adjusted, not seasonally adjusted, for Quarter 1 (Jan to Mar) 1997 to Quarter 4 (Oct to Dec) 2014. Consistent with Business Investment Quarter 4 (Oct to Dec) 2014 Provisional Results.
Quarterly capital expenditure and survey populations by employment size bands (32.5 Kb Excel sheet) Estimates from the Quarterly Survey of Capital Expenditure broken down by employment size bands for manufacturing and non-manufacturing industries. A breakdown of survey populations by employment size bands is also included. Current price, not seasonally adjusted, for Quarter 1 (Jan to Mar) 2012 to Quarter 3 (July to Sept) 2014. Consistent with Business Investment Quarter 3 (July to Sept) 2014 Revised Results.
Total gross fixed capital formation industry split for purchased software, own-account software, mineral exploration and artistic originals (1.01 Mb Excel sheet) Gross fixed capital formation estimates for purchased software, own-account software, mineral exploration and artistic originals; current price, not seasonally adjusted, for Quarter 1 (Jan to Mar) 1997 to Quarter 4 (Oct to Dec) 2014. Consistent with Business Investment Quarter 4 (Oct to Dec) 2014 Provisional Results.
Gross fixed capital formation asset ‘private sector dwellings’ broken down to its components ‘dwellings new’ and ‘dwellings improvements’ (45.5 Kb Excel sheet) Gross fixed capital formation estimates for private sector new dwellings and private sector new dwellings and private sector improvements to dwellings; current price, chained volume measure, seasonally adjusted, for Quarter 1 (Jan to Mar) 1997 to Quarter 4 (Oct to Dec) 2014. Consistent with Business Investment Quarter 4 (Oct to Dec) 2014 Provisional Results.
Gross fixed capital formation assets new dwellings (excluding land) and transfer costs of non-produced assets for households and non-profit institutions serving households sectors (32 Kb Excel sheet) Gross fixed capital formation data for new dwellings (excluding land) and costs associated with the transfer of non-produced assets for the households and non-profit institutions serving households sector. The series is in current price, not seasonally adjusted terms, for Quarter 1 (Jan to Mar) 1997 to Quarter 3 (July to Sept) 2014. Consistent with Business Investment Quarter 3 (July to Sept) 2014 Revised Results.
Capital expenditure (Capex) investment made by energy industries (35.5 Kb Excel sheet) Total net (acquisitions less disposals) investment by industry for energy industries in current price, not seasonally adjusted terms, for Quarter 1 (Jan to Mar) 2006 to Quarter 3 (July to Sept) 2014. Consistent with Business Investment Quarter 3 (July to Sept) 2014 Revised Results.
Quarterly capital expenditure estimates, by industry sector and sizeband (131.5 Kb Excel sheet) Quarterly estimates from the Quarterly Survey of Capital Expenditure, net expenditure, current prices, not seasonally adjusted for Quarter 1 (Jan to Mar) 2011 to Quarter 3 (July to Sept) 2014. Consistent with Business Investment Quarter 3 (July to Sept) 2014 Revised Results.
Net investment by industry sector and asset from the quarterly survey of capital expenditure (107 Kb Excel sheet) Quarterly estimates from the Quarterly Survey of Capital Expenditure, bench marked to the Annual Business Survey results for net investment by asset and industry sector. Current prices, not seasonally adjusted, for Quarter 1 (Jan to Mar) 1997 to Quarter 4 (Oct to Dec) 2014. Consistent with Business Investment Quarter 4 (Oct to Dec) 2014 Provisional Results.
Back to table of contents

