Table of contents
1. Main points
The estimates in this release are short-term indicators of investment in assets, such as dwellings, transport equipment, machinery, buildings and intangible assets. This release covers not only business investment, but asset breakdowns of total gross fixed capital formation (GFCF), of which business investment is one component
All investment data referred to in this bulletin are estimates of seasonally adjusted chained volume measures. The earliest period being revised in this release is Q1 2014
In Quarter 1 2015, GFCF was estimated to have increased by £1.5 billion (2.0%) to £76.1 billion compared with the previous quarter. This is the highest level which has been recorded for this series since it began in Quarter 1 1997
In Quarter 1 2015, business investment was estimated to have increased by £0.9 billion (2.0%) to £46.5 billion compared with the previous quarter
In Quarter 1 2015, GFCF was estimated to have increased by 5.0% compared with Q1 2014
In Quarter 1 2015, business investment increased by 5.7% compared with Q1 2014
Changes have been made to the Quarterly Survey of Capital Expenditure for Q1 2015. Clearer instructions have led contributors to indicate some historic misreporting in the asset breakdown. Adjustments have therefore been included to keep the asset series consistent with the asset split of the previous survey
The incorporation of the new interim construction price deflators has led to upward revisions to the levels of GFCF from Quarter 1 of 2014
2. About this release
The estimates in this release are short-term indicators of investment in non-financial assets in the UK, such as dwellings, transport equipment, machinery, buildings and intellectual property products. This release covers not only business investment, but asset and sector breakdowns of total gross fixed capital formation (GFCF), of which business investment is one component.
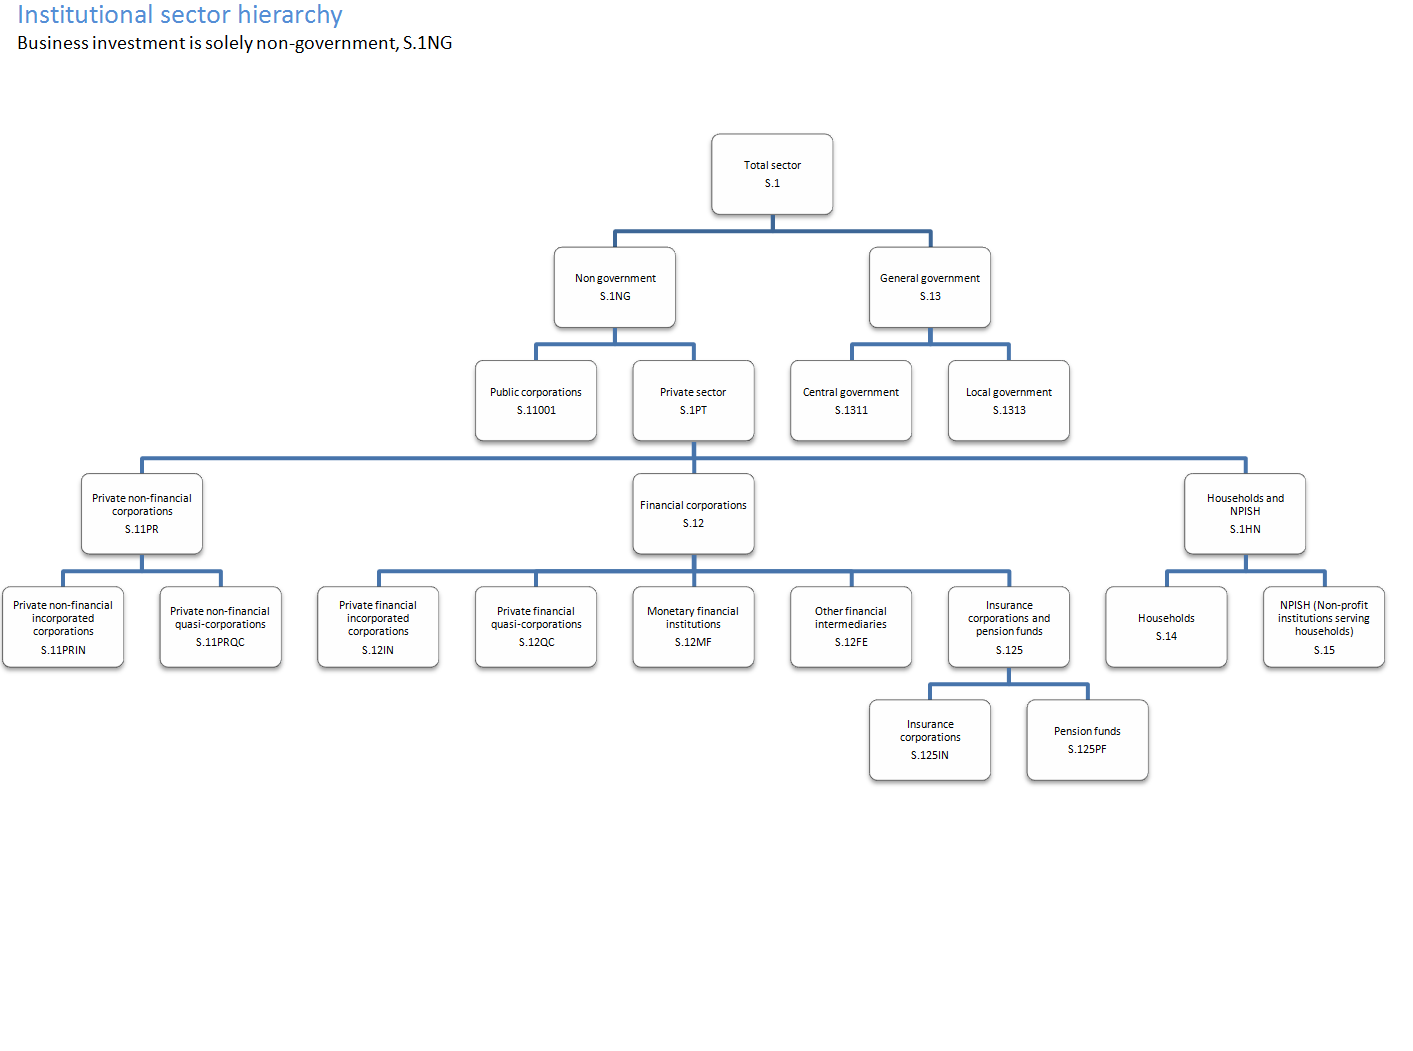
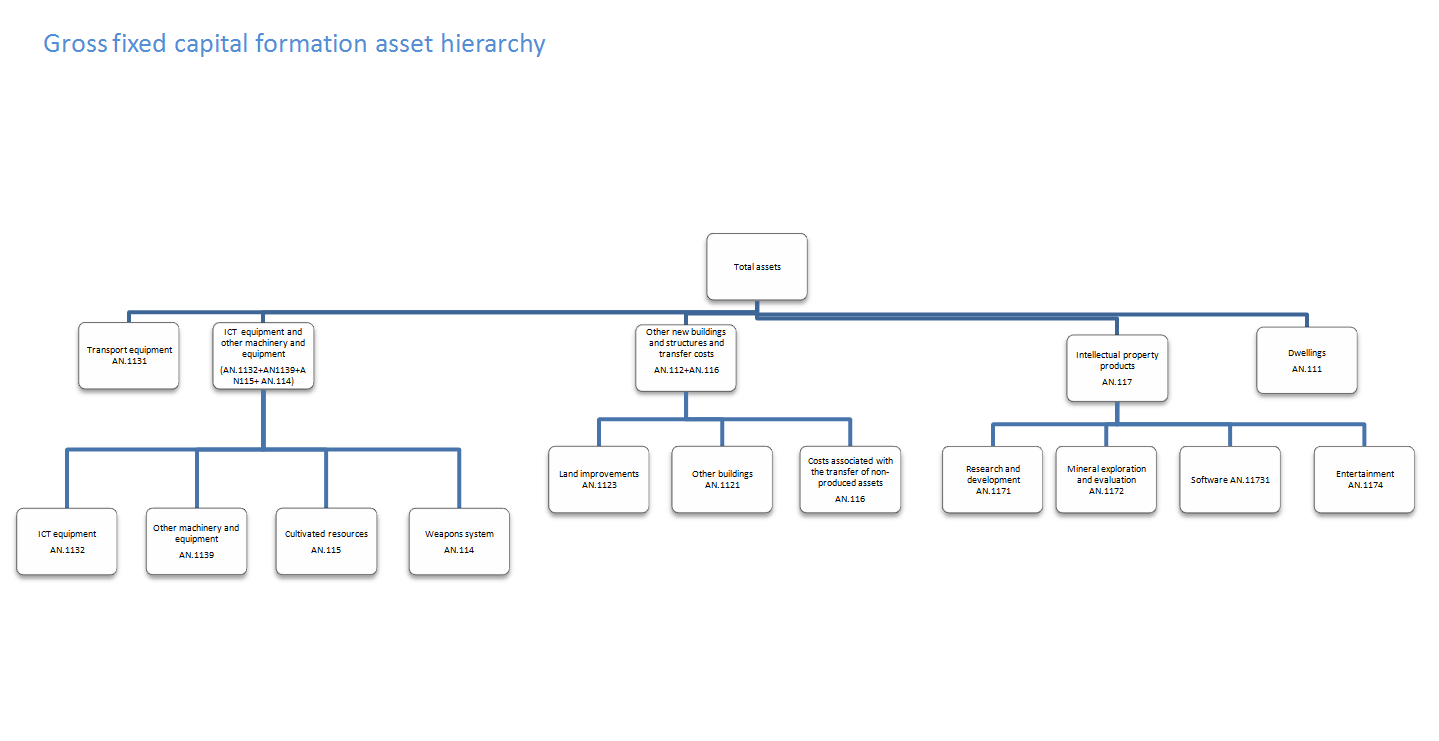
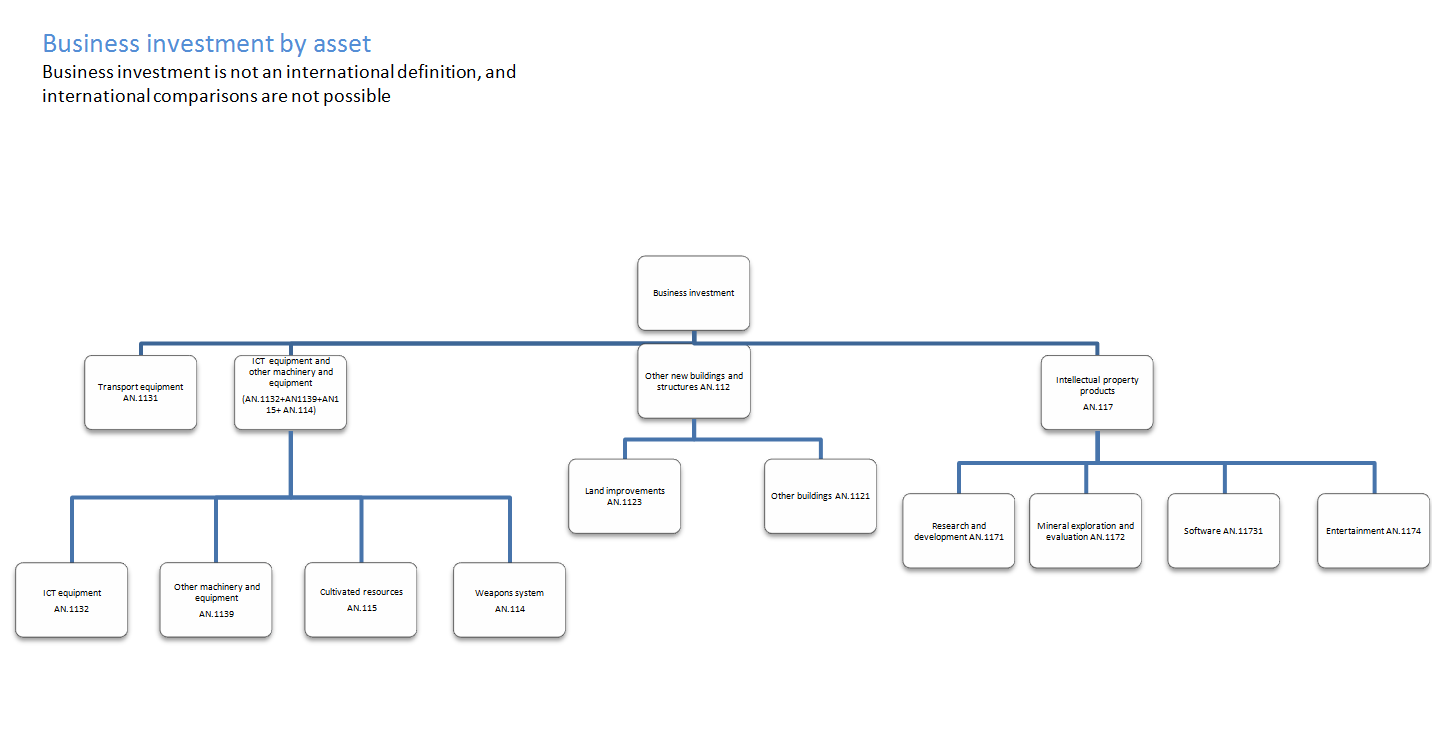
Business investment is net investment by private and public corporations in transport, information, technology and communications (ICT) equipment, other machinery and equipment, cultivated assets, intellectual property products (IPP, which includes investment in software, research and development, artistic originals and mineral exploration), and buildings and other structures. It does not include investment by central or local government, investment in dwellings or the costs associated with the transfer of non-produced assets (such as land). A full sector and asset hierarchy can be found in the background notes. It should be noted that business investment is not an internationally recognised concept and therefore it should not be used to make international comparisons.
All investment data referred to in this bulletin are estimates of seasonally adjusted chained volume measures.
Back to table of contents3. Changes to the Quarterly Survey of Capital Expenditure and other methodological information
Changes to the Quarterly Survey of Capital Expenditure in Q1 2015
As described in the Business Investment, Q4 2014 Revised Results bulletin and the article Changes to the Annual Business Survey, the Quarterly Survey of Capital Expenditure and the Survey into Business Spending on Capital Items, in 2015 (114.3 Kb Pdf) , we have migrated to the Quarterly Acquisitions and Disposals of Capital Assets Survey (QCAS) from the Quarterly Survey of Capital Expenditure (CAPEX) in this release. The main reasons for the changes to the survey are to move to the updated European System of Accounts (ESA) 2010 manual, the international guidance for national accounts.
Several presentational issues have been addressed but the main changes to the survey are:
new questions have been added to improve the quality of our estimates and to meet the latest European legislation requirements (ESA 2010)
the lower limit of £500 for the value of reported assets has been removed, so all relevant assets (even those below businesses’ Asset Register threshold) should be reported
small tools used in production have been included within the definition of GFCF
improvements have been made to the questionnaire’s layout with new sections and headings, designed to make completing the questionnaire easier
The data from the new questions will not be included in estimates of GFCF and its components until 2017, when 2 years of data will be available for quality assurance.
Further methodological information including upcoming changes for Blue Book 2015
Estimates in this release have been compiled under ESA 2010 concepts and definitions, in compliance with the UK’s legal obligations in producing the National Accounts. Articles are available describing the methodology used to estimate GFCF and the impact of the changes implemented for ESA10 in September 2014.
Several articles explaining the changes that will be implemented in the UK National Accounts (Blue Book) 2015, (to be published in October 2015), were published on 19 May 2015. These articles describe changes related to ongoing work to meet ESA 1995 requirements. The changes that impact GFCF and its components are spending on repairs and maintenance of dwellings and exhaustiveness. A comprehensive list of all published articles relating to changes to the UK National Accounts (Blue Book) can be found on our website. This list will be updated as new articles are published.
Impact of Blue Book 2015 changes on Current Price Gross Domestic Product Estimates, 1997 to 2010 12 June 2015
Interim solution for construction output price indices, Quarter 1 (January to March) 2015 12 June 2015
Impact of ESA 1995 Changes on Current Price Gross National Income Estimates, 2002 to 2010 19 May 2015
Methodological improvements to National Accounts for Blue Book 2015: Exhaustiveness (225.9 Kb Pdf) 19 May 2015
Gross Fixed Capital Formation and Business Investment – Impact of ESA10 Changes on Volume Measures (195.6 Kb Pdf) 30 June 2014
How Construction Price Indices are Used in Construction Statistics and Gross Fixed Capital Formation (80.7 Kb Pdf) 19 June 2014
Construction price indices: improvements 19 June 2014
Measuring and capitalising research & development in the UK National Accounts (349.1 Kb Pdf) 10 June 2014
Implementation framework for Research and Development in the United Kingdom National Accounts (206.7 Kb Pdf) 10 June 2014
Impact of ESA10 changes on current price GDP estimates 10 June 2014
Transition to ESA10: capitalising government spending on military weapons (179 Kb Pdf) 10 June 2014
Gross Fixed Capital Formation (Investment) - Changes for Blue Book 2014 (excluding ESA10) (157.8 Kb Pdf) 29 May 2014
Impact of ESA95 changes on current price GDP estimates 29 May 2014
Revised methodology and sources as a result of addressing Gross National Income reservations (105.1 Kb Pdf) 29 May 2014
Notes for Changes to the Quarterly Survey of Capital Expenditure and other methodological information
- Q1 = Quarter 1 (January to March), Q2 = Quarter 2 (April to June), Q3 = Quarter 3 (July to September), Q4 = Quarter 4 (October to December)
4. Adjustments, revisions and response rates
Adjustments
As a result of the changes to the survey and the timing of Easter, response has been lower than expected at 83%, when compared with an average of 92% when revised data were previously published.
Large capital expenditure tends to be reported later in the data collection period than smaller expenditure. This means that larger expenditures are often included in the revised (month 3) results, but are not reported in time for the provisional (month 2) results, leading to a tendency towards upwards revisions in the later estimates for business investment and Gross fixed Capital Formation (GFCF). Following investigation of the impact of this effect, from Q3 2013, a bias adjustment was introduced to GFCF and its components in the provisional estimate.
A bias adjustment of £0.4 billion for Q1 2015 has been included in this release, a reduction from £1.5bn in the provisional estimate. This is for later returns of larger capital items and the lower survey response rate. This adjustment will be removed when the survey response rates improve. Users should note that the bias adjustment is a best estimate of the Quarterly Acquisitions and Disposals of Capital Assets Survey (QCAS) and the estimate may still be revised either up or down. Therefore, GFCF and business investment will be subject to further revision. The bias adjustment is intended to reduce the average size of revisions over time. It is not possible to ascertain the direction of any such revisions.
In improving the survey through clearer instructions, contributors have indicated that there has been some historic misreporting in the asset breakdown. Adjustments have therefore been included to keep the asset series continuous. In the provisional Quarter 1 (January to March) 2015 Business Investment release, we stated that it would be completing further work into the asset breakdown, as initial feedback from some respondents indicated that they had been misreporting their asset breakdown and were correcting this on the new questionnaire, as it provided clearer completion instructions. We have now further analysed the impact of this feedback on the higher response and made some adjustments to the assets in the current price series in Q1 2015 to make them consistent with the asset split of the previous survey. Survey responses indicated that some respondents in the past were reporting new construction work (NCW) as other capital equipment (OCE). With the clearer notes on the Q1 2015 forms they were now reporting more in new construction work at the expense of other capital equipment. Therefore we have included quality adjustments on asset buildings (negative £1.5bn) and Other Machinery (positive £1.5bn). These adjustments will be reviewed as the survey response increases.
Forecast data
In this release, estimates of investment in research and development and artistic originals have been forecast.
Revisions
The periods revised in this release are Q1 2014 to Q1 2015.
Revisions in this release include revisions to source data and the incorporation of new interim construction deflators. The current price (not seasonally adjusted) data set is mainly revised by revisions to the source data. The chained volume measure (seasonally adjusted) are mainly revised due to the new construction deflators. These new construction price indices have resulted in revisions to the volume of investment in dwellings and other buildings and structure which have increased the level total gross fixed capital formation and business investment. Further analysis and explanation can be found in Changes to National Accounts: Gross fixed Capital Formation and Business Investment – Quarter 1 (January to March) 2015.
Survey response rates
Table 1 presents the revised (month 3) response rates for the QCAS. The estimates in this release are based on the Q1 2015 month 3 (revised) survey results.
Table 1: Response rates for Quarterly Survey of Capital Expenditure
| UK, quarter 1 (Jan to Mar) 2014 to quarter 1 (Jan to Mar) 2015 | |||
| At month 2 (Provisional) | At month 3 (Revised) | ||
| Period | Survey response rates / % | Period | Survey response rates / % |
| 2014 Q1 | 76.2 | 2014 Q1 | 90.7 |
| 2014 Q2 | 79.5 | 2014 Q2 | 91.3 |
| 2014 Q3 | 78.7 | 2014 Q3 | 91.7 |
| 2014 Q4 | 80.1 | 2014 Q4 | 94.4 |
| 2015 Q1 | 67.3 | 2015 Q1 | 83.3 |
Download this table Table 1: Response rates for Quarterly Survey of Capital Expenditure
.xls (53.8 kB)Notes for adjustments, revisions and response rates
- Q1 = Quarter 1 (January to March), Q2 = Quarter 2 (April to June), Q3 = Quarter 3 (July to September), Q4 = Quarter 4 (October to December)
5. Economic background
Business investment grew by 2.0% in Q1 2015, an increase from 0.3% growth in the previous quarter. Business Investment grew by 5.7% in Q1 2015 compared to the corresponding quarter of the previous year. GFCF also grew robustly by 2.0% in Q1 2015. The strength of business investment is consistent with external business confidence indicators.
On the quarter, by asset class GFCF was driven by transport. In Q1 2015, transport equipment grew by 21.0% and the other main driver of growth was dwellings which grew by 3.2% on the quarter. By sector, GFCF was driven by dwellings – both public and private – that grew by 2.1% and 3.2% respectively. The strength of investment in dwellings is reflected in the construction output data which show that construction output grew by 1.5% in the year to April 2015.
Latest quarter on corresponding quarter of the previous year shows the drivers of growth by asset class were dwellings which increased by 9.7% and transport equipment which grew by 24.8%. By sector, the main drivers of growth were dwellings, both public and private, whereas general government exerted downward pressure on GFCF.
Although investment growth has eased since the first half of 2014, GFCF remains strong. One factor that may be supporting investment is business confidence. The British Chambers of Commerce Quarterly Economic Survey shows that business confidence for services and manufacturing remains high despite easing in recent quarters. The Bank of England's Inflation Report for May noted that financial conditions remain supportive of business investment, as low interest rates and low yields on corporate bonds are likely to have made the return on capital spending more attractive.
Notes for Economic background
- Q1 = Quarter 1 (January to March), Q2 = Quarter 2 (April to June), Q3 = Quarter 3 (July to September), Q4 = Quarter 4 (October to December)
6. Gross fixed capital formation and business investment
Figure 1: Annual gross fixed capital formation chained volume measures
Reference year: 2011 Coverage: UK
Source: Quarterly Acquisitions and Disposals of Capital Assets Survey - Office for National Statistics
Download this chart Figure 1: Annual gross fixed capital formation chained volume measures
Image .csv .xls
Figure 2: Quarterly gross fixed capital formation chained volume measures
Reference year: 2011 Seasonal adjustment: seasonally adjusted Coverage: UK
Source: Quarterly Acquisitions and Disposals of Capital Assets Survey - Office for National Statistics
Notes:
- Q1 = Quarter 1 (January to March), Q2 = Quarter 2 (April to June), Q3 = Quarter 3 (July to September), Q4 = Quarter 4 (October to December)
Download this chart Figure 2: Quarterly gross fixed capital formation chained volume measures
Image .csv .xls
Figure 3: Annual business investment chained volume measures
Reference year: 2011 Coverage: UK
Source: Quarterly Acquisitions and Disposals of Capital Assets Survey - Office for National Statistics
Download this chart Figure 3: Annual business investment chained volume measures
Image .csv .xls
Figure 4: Quarterly business investment chained volume measures
Reference year: 2011 Seasonal adjustment: seasonally adjusted Coverage: UK
Source: Quarterly Acquisitions and Disposals of Capital Assets Survey - Office for National Statistics
Notes:
- Q1 = Quarter 1 (January to March), Q2 = Quarter 2 (April to June), Q3 = Quarter 3 (July to September), Q4 = Quarter 4 (October to December
Download this chart Figure 4: Quarterly business investment chained volume measures
Image .csv .xlsFigure 4 shows a large spike in business investment Q2 2005. This is due to the transfer of British Nuclear Fuels Ltd (BNFL). In April 2005, nuclear reactors were transferred from BNFL to the Nuclear Decommissioning Authority (NDA). BNFL is classified as a public corporation in National Accounts, while the NDA is a central government body. The business investment series includes investment by public corporations but not government spending, with the positive spike therefore reflecting the £15.6 billion transfer. More information on the transfer of BNFL can be found in the background notes under section ‘3. Further information on "methodology".
Summary tables
Total gross fixed capital formation increased by an estimated £1.5 billion (2.0%) in Q1 2015 compared with the previous quarter. In Q1 2015, business investment also saw an increase of 2.0%, rising by an estimated £0.9 billion. Private sector dwellings increased by £0.5bn in Q1 2015.
Table 2a: Total gross fixed capital formation by institutional sector
| UK, quarter 1 (Jan to Mar) 2015 | ||||
| % change | £ million | |||
| Most recent quarter on previous quarter | Most recent quarter on a year earlier | Most recent level ** | Level change from previous quarter | |
| Gross fixed capital formation | 2.0 | 5.0 | 76,099 | 1,471 |
| Business investment | 2.0 | 5.7 | 46,470 | 897 |
| General government | 1.2 | -4.1 | 9,991 | 121 |
| Public corporations dwellings | 2.1 | 7.5 | 887 | 18 |
| Public corporations cost of ownership transfer on non-produced assets | 1.9 | -1.8 | -110 | -2 |
| Private sector dwellings | 3.2 | 9.6 | 15,275 | 474 |
| Private sector cost of ownership transfer on non-produced assets | -1.0 | 4.5 | 3,586 | -37 |
| Source: Office for National Statistics | ||||
| Notes: | ||||
| 1. ** Series may not sum to totals due to rounding | ||||
Download this table Table 2a: Total gross fixed capital formation by institutional sector
.xls (26.6 kB)In Q1 2015, transport equipment saw the largest level increase rising by an estimated £0.6 billion (21.0%), the highest level since Q4 2010. Dwellings saw the second highest level increase of an estimated £0.5 billion (3.2%). These increases were partially offset by a decrease in other buildings and structures and transfer costs of an estimated £0.2 billion (0.9%). All assets showed positive growth of at least 1.0% compared with the same quarter of the previous year.
Table 2b: Total gross fixed capital formation by asset
| UK, quarter 1 (Jan to Mar) 2015 | ||||
| % change | £ million | |||
| Most recent quarter on previous quarter | Most recent quarter on a year earlier | Most recent level ** | Level change from previous quarter | |
| Gross fixed capital formation | 2.0 | 5.0 | 76,099 | 1,471 |
| Transport equipment | 21.0 | 24.8 | 3,625 | 629 |
| ICT equipment and other machinery and equipment | 2.2 | 3.7 | 16,667 | 362 |
| Dwellings | 3.2 | 9.7 | 16,161 | 498 |
| Other buildings and structures and transfer costs | -0.9 | 3.2 | 22,973 | -212 |
| Intellectual property products | 1.2 | 1.0 | 16,673 | 194 |
| Source: Office for National Statistics | ||||
| Notes: | ||||
| 1. ** Series may not sum to totals due to rounding | ||||
Download this table Table 2b: Total gross fixed capital formation by asset
.xls (33.8 kB)Notes for Gross fixed capital formation and business investment
- Q1 = Quarter 1 (January to March), Q2 = Quarter 2 (April to June), Q3 = Quarter 3 (July to September), Q4 = Quarter 4 (October to December)
7. Where to find more of our data
Gross fixed capital formation by detailed industry and asset (245.5 Kb Excel sheet) Detailed annual breakdown of gross fixed capital formation in current prices, chained volume measures, non-seasonally adjusted and seasonally adjusted for 1997 to 2014. Consistent with the UK Annual National Accounts (Blue Book) 2014.
UK National Accounts (Blue Book) Chapter 9 (113.5 Kb Excel sheet) Gross fixed capital formation by institutional sectors and assets, in current prices, chained volume measures, non-seasonally adjusted and seasonally adjusted. Annually from 1987 to 2014, total gross fixed capital formation data is available back to 1948. Quarterly from Q1 1997 to Q4 2014.
Business investment by industry and asset Detailed breakdown of business investment by industry and asset, in current prices, chained volume measures, non-seasonally adjusted and seasonally adjusted. Annually for 1997 to 2014 and quarterly for Q1 1997 to Q4 2014.
UK Economic Accounts Gross fixed capital formation by institutional sector in current prices, not seasonally adjusted and seasonally adjusted annually for 1997 to 2014 and quarterly for Q1 1997 to Q4 2014.
ONS also publishes additional analyses of gross fixed capital formation, business investment, and the Quarterly Survey of Capital Expenditure, which have been created in response to ad hoc user requests. These are available to download free from our website. Below is a list of the most recent ad hoc requests, enquiries about ad hoc requests may be made to gcf@ons.gov.uk.
Note: all datasets below have been updated from Q1 1997 to be consistent with the UK Annual National Accounts (Blue Book) 2014.
Research and development price index for gross fixed capital formation (33 Kb Excel sheet) This time series is derived from the Research and Development dataset and is based on actual current price values up to and including 2012, all subsequent periods have been forecasted using X-13-ARIMA-SEATS, a seasonal adjustment model. The base year for this analysis is 2005. This price index (deflator) is calculated using a weighted labour, capital and material prices and excludes a productivity adjustment. Data has been extracted from the Q4 2014 dataset.
Regional gross fixed capital formation, 2000-2012 (110 Kb Excel sheet) Regional gross fixed capital formation by industry sector at NUTS1 and NUTS2 regional breakdown levels. The Nomenclature of Units for Territorial Statistics (NUTS) was created by the European Office for Statistics (Eurostat) as a single hierarchical classification of spatial units used for statistical production across the European Union (EU). NUTS1 consists of Wales, Scotland, Northern Ireland and nine English regions. NUTS2 consists of 37 areas which are mainly groups of counties and unitary authorities. Annually from 2000 to 2012.
Gross fixed capital formation quarterly weapons analysis (183 Kb Excel sheet)
Quarterly GFCF data relating to spending on weapons systems. Q1 1997 to Q1 2015. Consistent with Business Investment Q1 2015 Provisional Results.
Private sector investment in computer hardware (38 Kb Excel sheet)
A time series of investment in computer hardware by the private sector broken down by industry; current price, not seasonally adjusted. Q1 1997 to Q1 2015. Consistent with Business Investment Q1 2015 Provisional Results.
Total business investment and general government data excluding British Nuclear Fuels (BNFL) in 2005 Q2 (56 Kb Excel sheet) Gross fixed capital formation estimates for total Business Investment and General Government, excluding British Nuclear Fuels (BNFL) in Q2 2005; current price, chained volume measure, seasonally adjusted, not seasonally adjusted. Q1 1997 – Q1 2015. Consistent with Business Investment – Q1 2015 Provisional Results.
Quarterly capital expenditure and survey populations by employment size bands (33.5 Kb Excel sheet) Estimates from the Quarterly Survey of Capital Expenditure broken down by employment size bands for manufacturing and non-manufacturing industries. A breakdown of survey populations by employment size bands is also included. Current price, not seasonally adjusted. Q1 2012 to Q4 2014. Consistent with Business Investment Q4 2014 Revised Results.
Total gross fixed capital formation industry split for purchased software, own-account software, mineral exploration and artistic originals (1.02 Mb Excel sheet) Gross fixed capital formation estimates for total GFCF industry split for purchased software, own-account software, mineral exploration and artistic originals; current price, not seasonally adjusted. Q1 1997 to Q1 2015. Consistent with Business Investment Q1 2015 Provisional Results.
Gross fixed capital formation asset ‘private sector dwellings’ broken down to its components ‘dwellings new’ and ‘dwellings improvements’ (53.5 Kb Excel sheet) Gross fixed capital formation estimates for private sector new dwellings and private sector new dwellings and private sector improvements to dwellings; current price, chained volume measure, seasonally adjusted. Q1 1997 to Q1 2015. Consistent with Business Investment Q1 2015 Provisional Results.
Gross fixed capital formation assets new dwellings (excluding land) and transfer costs of non-produced assets for households and non-profit institutions serving households sectors (53.5 Kb Excel sheet) Gross fixed capital formation data for new dwellings (excluding land) and costs associated with the transfer of non-produced assets for the households and non-profit institutions serving households sector. The series is in current price, not seasonally adjusted terms. Q1 1997 to Q4 2014. Consistent with Business Investment - Q4 2014 Revised Results.
Capital expenditure (Capex) investment made by energy industries (35 Kb Excel sheet) Total net (acquisitions less disposals) investment by industry for energy industries in current price, not seasonally adjusted terms. Quarterly from Q1 2006 to Q4 2014. Consistent with Business Investment Q4 2014 Revised Results.
Quarterly capital expenditure estimates, by industry sector and sizeband (139.5 Kb Excel sheet) Quarterly estimates from the Quarterly Survey of Capital Expenditure, net expenditure, current prices, not seasonally adjusted. Q1 2011 to Q4 2014. Consistent with Business Investment Q4 2014 Revised Results.
Net investment by industry sector and asset from the quarterly survey of capital expenditure (130 Kb Excel sheet) Quarterly estimates from the Quarterly Survey of Capital Expenditure, bench marked to the Annual Business Survey results for net investment by asset and industry sector. Current prices, not seasonally adjusted. Q1 1997 to Q4 2014. Consistent with Business Investment Q4 2014 Revised Results.
Quarterly capital expenditure; acquisitions and disposals by industry and major asset type (1.49 Mb Excel sheet) A time series of estimates from the Quarterly Survey of Capital Expenditure, broken down by industry, asset and acquisitions/disposals; current price not seasonally adjusted.
Quarterly Survey of Capital Expenditure – proportion of businesses in the survey sample which were foreign subsidiaries, 2011-2015 (30.5 Kb Excel sheet) The percentage of businesses in the Quarterly Survey of Capital Expenditure (Capex) which are foreign subsidiaries, 2011 to 2015.
Notes for where to find more of our data
- Q1 = Quarter 1 (January to March), Q2 = Quarter 2 (April to June), Q3 = Quarter 3 (July to September), Q4 = Quarter 4 (October to December)