1. Key points
In April 2014 median gross weekly earnings for full-time employees were £518, up 0.1% from £517 in 2013. This is the smallest annual growth since 1997, the first year for which ASHE data are available. Growth has been slower since the economic downturn, with the annual increase averaging around 1.4% per year between 2009 and 2014
Adjusted for inflation, weekly earnings decreased by 1.6% compared to 2013. The largest decrease was between 2010 and 2011, but inflation-adjusted earnings have continued to decrease every year since 2008, to levels last seen in the early 2000s
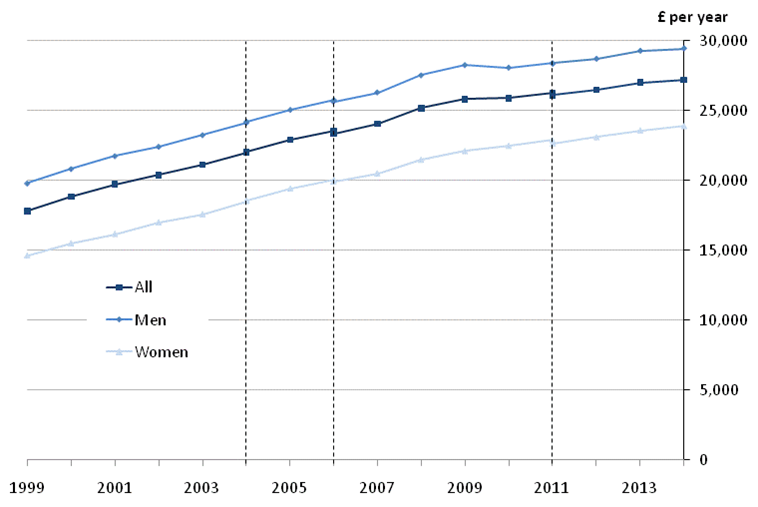
For the year ending 5 April 2014 median gross annual earnings for full-time employees (who had been in the same job for at least 12 months) were £27,200, an increase of 0.7% from the previous year
The gender pay gap has narrowed, to 9.4% compared with 10.0% in 2013. This is the lowest since records began in 1997, and despite a relatively large increase between 2012 and 2013, there is an overall downward trend, from 17.4% in 1997
In April 2014 the bottom 10% of full-time employees earned less than £288 per week. At the other end of the distribution, the top 10% of full-time employees earned more than £1,024. Since 1997, earnings at the 90th percentile have remained consistently at around 3.5 times earnings at the 10th percentile
Median gross weekly earnings for full-time employees increased by 1.0% in the public sector, and by 0.7% in the private sector. The gap has closed slightly over the long term, but private sector earnings have remained consistently at around 85% of public sector earnings since 2009
2. Introduction
This bulletin presents analyses from the Annual Survey of Hours and Earnings (ASHE), which is the ONS’s most detailed and comprehensive source of information on:
levels of earnings (for both full-time and part-time employees and for gender);
make-up of total earnings (split between basic pay and other components); and
distribution of earnings (the extent to which earnings are dispersed around the median)
ONS’s headline measure of earnings from ASHE is median weekly earnings for full-time employees. This measure is therefore the main focus of this article but discussion of the mean, hourly earnings, annual earnings and earnings for part-time employees is also included for comparison. Figures are presented in terms of gross pay in current prices (unless otherwise stated).
This bulletin contains provisional estimates from the 2014 survey and revised estimates for the 1997 to 2013 back series. The full suite of results tables from the 2014 ASHE and from all previous years back to 1997 are available on the ONS website.
This year, we have produced new interactive content on earnings by occupation, and we have continued to produce a thematic map showing earnings by local authority and an animated bar chart showing earnings by region. We have also added time series tables for key series back to 1997.
An explanation of definitions used in this article and further methodological information can be found in the background notes.
In 2013 the coverage of the database from which the ASHE sample is drawn was broadened. The impact is considered to be negligible for the estimates presented here. More information is provided in the background notes.
We constantly aim to improve our ASHE outputs and associated commentary. Please contact us via earnings@ons.gov.uk with any feedback or questions.
Back to table of contents3. Average earnings
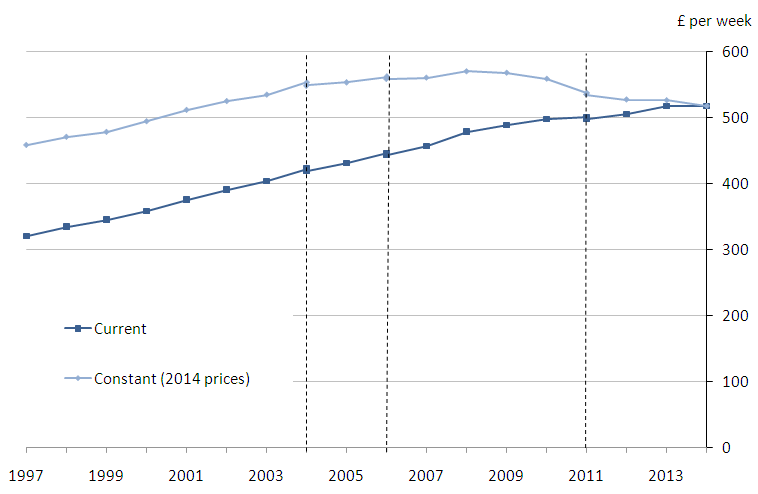
In April 2014, median gross weekly earnings for full-time employees were £518, up 0.1% from £517 in 2013. This is the smallest annual growth since April 1997, the first year for which ASHE data are available. Up until 2008, growth was fairly steady, averaging at around 4% each year. However, since the start of the economic downturn growth has been slower, with the annual increase averaging around 1.4% per year between 2009 and 2014.
To understand changes in earnings in the context of inflation, historic data are adjusted using the Consumer Prices Index (CPI). This gives a measure of the ‘real’ value of earnings, with a decrease meaning that earnings growth is below inflation.
Adjusted for inflation, weekly earnings decreased by 1.6% compared with 2013, a slightly larger drop than that seen in the previous two years. The largest decrease was between 2010 and 2011, but inflation-adjusted earnings have continued to decrease every year since 2008, to levels last seen in the early 2000s.
Figure 1: Median full-time gross weekly earnings in current and constant (2014) prices, UK, April 1997 to 2014

Source: Annual Survey of Hours and Earnings (ASHE) - Office for National Statistics
Notes:
- Employees on adult rates, pay unaffected by absence
- Full-time defined as employees working more than 30 paid hours per week (or 25 or more for the teaching professions)
- CPI figures are based on the All Items Consumer Prices Index of inflation for April
- Dashed lines represent discontinuities in 2004, 2006 and 2011 ASHE estimates
- 2014 data are provisional
Download this image Figure 1: Median full-time gross weekly earnings in current and constant (2014) prices, UK, April 1997 to 2014
.png (21.8 kB) .xls (60.4 kB)The composition of the labour market changes from year to year. For example, when new jobs are created at the lower end of the earnings distribution, or when highly-paid jobs are lost, this acts to reduce the median. Looking only at jobs in which the employee had been in post for at least one year removes these compositional effects. This approach shows consistently higher growth rates, and in April 2014 earnings for this group grew by 4.1% compared with April 2013.
Figure 2: Annual percentage change in median full-time gross weekly earnings for all employees and those in continuous employment, UK, April 2005 to 2014
Source: Annual Survey of Hours and Earnings (ASHE) - Office for National Statistics
Notes:
- Employees on adult rates, pay unaffected by absence
- Full-time defined as employees working more than 30 paid hours per week (or 25 or more for the teaching professions)
- CPI figures are based on the All Items Consumer Prices Index of inflation for April
- 2014 data are provisional
Download this chart Figure 2: Annual percentage change in median full-time gross weekly earnings for all employees and those in continuous employment, UK, April 2005 to 2014
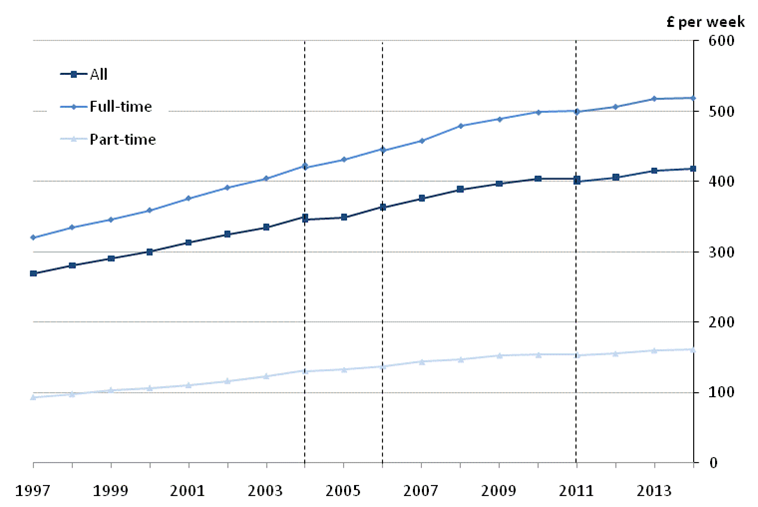
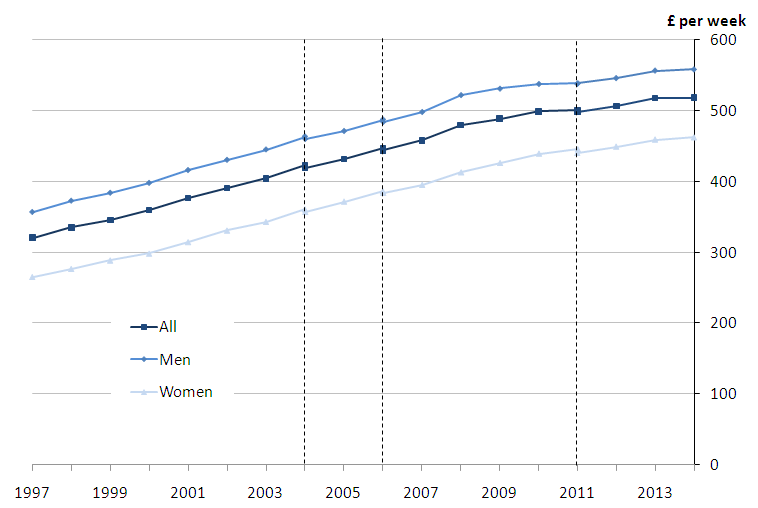
Image .csv .xlsMen working full-time earned more than women (£558 per week in April 2014 compared with £462), with both seeing small increases compared to 2013 (0.3% and 0.6% respectively). The gap between men’s and women’s earnings from 1997 to 2014 has remained relatively consistent at around £100 (see Figure 2), but this corresponds to a faster rate of increase for women than men over this period (a 74% increase compared with 56% respectively), meaning that the gap has been closing in percentage terms.
While these results provide a useful measure of earnings trends for men and women, ONS’s preferred measure of the ‘gender pay gap’ uses hourly earnings excluding overtime. This is discussed in the gender pay gap section.
Figure 3: Median full-time gross weekly earnings by sex, UK, 1997 to 2014

Source: Annual Survey of Hours and Earnings (ASHE) - Office for National Statistics
Notes:
- Employees on adult rates, pay unaffected by absence
- Full-time defined as employees working more than 30 paid hours per week (or 25 or more for the teaching professions)
- Dashed lines represent discontinuities in 2004, 2006 and 2011 ASHE estimates
- 2014 data are provisional
- The slow growth this year is also seen for part-time jobs, with an increase of 0.8% compared with 2013
Download this image Figure 3: Median full-time gross weekly earnings by sex, UK, 1997 to 2014
.png (27.1 kB) .xls (48.1 kB)
Figure 4: Median gross weekly earnings, UK, April 2014
Source: Annual Survey of Hours and Earnings (ASHE) - Office for National Statistics
Notes:
- Employees on adult rates, pay unaffected by absence
- Full-time defined as employees working more than 30 paid hours per week (or 25 or more for the teaching professions)
- Dashed lines represent discontinuities in 2004, 2006 and 2011 ASHE estimates
- 2014 data are provisional
Download this image Figure 4: Median gross weekly earnings, UK, April 2014
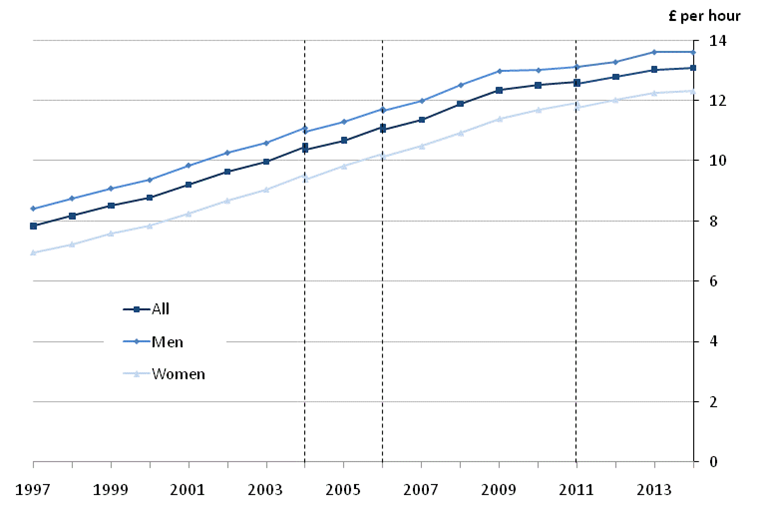
.png (68.4 kB) .xls (46.6 kB)Annual earnings (averaging around £27,200) and hourly earnings excluding overtime (£13.08) also showed slow growth this year. Notably, men’s hourly earnings decreased very slightly, by 0.1%.
Figure 5: Median full-time gross annual earnings by sex, UK, 1999 to 2014
Source: Annual Survey of Hours and Earnings (ASHE) - Office for National Statistics
Notes:
- Employees on adult rates who have been in the job for more than one year
- Full-time defined as employees working more than 30 paid hours per week (or 25 or more for the teaching professions)
- Earnings for tax year ending 5 April
- Dashed lines represent discontinuities in 2004, 2006 and 2011 ASHE estimates
- 2014 data are provisional
Download this image Figure 5: Median full-time gross annual earnings by sex, UK, 1999 to 2014
.png (69.3 kB) .xls (47.6 kB)
Figure 6: Median full-time hourly earnings, excluding overtime, by sex, UK, 1997 to 2014
Source: Annual Survey of Hours and Earnings (ASHE) - Office for National Statistics
Notes:
- Employees on adult rates, pay unaffected by absence
- Full-time defined as employees working more than 30 paid hours per week (or 25 or more for the teaching professions)
- Dashed lines represent discontinuities in 2004, 2006 and 2011 ASHE estimates
- 2014 data are provisional
Download this image Figure 6: Median full-time hourly earnings, excluding overtime, by sex, UK, 1997 to 2014
.png (63.3 kB) .xls (47.6 kB)4. Distribution of earnings
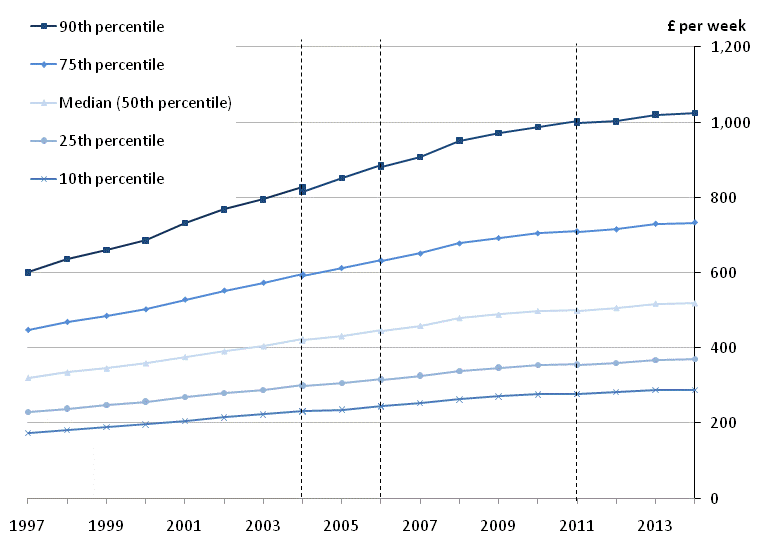
Focusing solely on the median hides some interesting trends for low- and high-earning employees. Figure 7 displays the distribution of weekly earnings among full-time employees for the years 1997 to 2014.
For 2014, at the bottom of the distribution, 10% of full-time employees earned less than £288 per week, whereas at the other end of the scale 10% earned more than £1,024 per week. Each year since 1997 earnings at the 90th percentile have remained consistently at around 3.5 times that of the 10th percentile.
Figure 7: Distribution of full-time gross weekly earnings, UK, April 1997 to 2014

Source: Annual Survey of Hours and Earnings (ASHE) - Office for National Statistics
Notes:
- Employees on adult rates, pay unaffected by absence
- Full-time defined as employees working more than 30 paid hours per week (or 25 or more for the teaching professions)
- Dashed lines represent discontinuities in 2004, 2006 and 2011 ASHE estimates
- 2014 data are provisional
Download this image Figure 7: Distribution of full-time gross weekly earnings, UK, April 1997 to 2014
.png (33.2 kB) .xls (52.7 kB)5. Gender pay differences
While there is no single measure which adequately deals with the complex issue of the differences between men’s and women’s pay, ONS prefers to use median hourly earnings (excluding overtime) for full-time employees. Including overtime can skew the results because men work relatively more overtime than women, and using hourly earnings better accounts for the fact that men work on average more hours than women.
It should be noted that although median hourly pay provides a useful comparison of men’s and women’s earnings, it does not reveal differences in rates of pay for comparable jobs. This is because it does not highlight the different employment characteristics of men and women, such as the proportion of each gender in different occupations and their length of time in service.
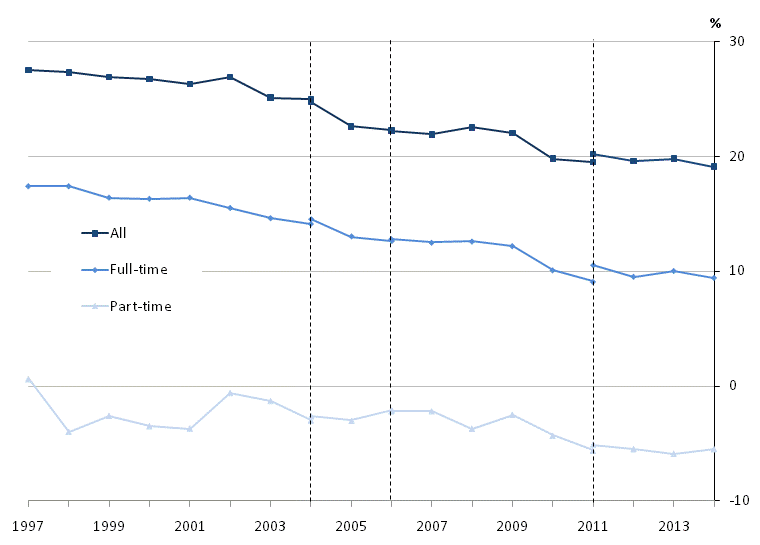
The gender pay gap, based on median hourly earnings excluding overtime, has narrowed for full-time employees, to 9.4% compared with 10.0% in 2013. This is the lowest on record, and despite a relatively large increase between 2012 and 2013, there is an overall downward trend, from 17.4% in 1997
The gap for all employees (full-time and part-time) was also the lowest on record at 19.1%, down from 19.8% in 2013. The gap has also decreased in the long-term, from 27.5% in 1997
For part-time employees, the higher rate of pay for women than men results in a ‘negative’ gender pay gap. Although the trend is more volatile than for full-time employees, there is evidence that the gap has widened in the long-term. It has, however, remained relatively stable in recent years, standing at 5.5% in April 2014
Figure 8: Gender pay gap for median gross hourly earnings (excluding overtime), UK, April 1997 to 2014

Source: Annual Survey of Hours and Earnings (ASHE) - Office for National Statistics
Notes:
- Employees on adult rates, pay unaffected by absence
- Figures represent the difference between men's and women's hourly earnings as a percentage of men's earnings
- Full-time defined as employees working more than 30 paid hours per week (or 25 or more for the teaching professions)
- Dashed lines represent discontinuities in 2004, 2006 and 2011 ASHE estimates
- 2014 data are provisional
Download this image Figure 8: Gender pay gap for median gross hourly earnings (excluding overtime), UK, April 1997 to 2014
.png (24.9 kB) .xls (47.6 kB)Figure 9 shows gender pay differences by age group. The gap is relatively small up to, and including, the 30-39 age group (with the exception of the 16-17 age group). In fact, the gap is negative for the 22-29 and 30-39 age groups, meaning that women earn on average more than men. Thereafter, there is a relatively large positive gap. This is likely to be connected with the fact that many women have children and take time out of the labour market.
Figure 9: Gender pay gap for median full-time gross hourly earnings (excluding overtime) by age group, UK, April 2014
Source: Annual Survey of Hours and Earnings (ASHE) - Office for National Statistics
Notes:
- Employees on adult rates, pay unaffected by absence
- Figures represent the difference between men's and women's hourly earnings as a percentage of men's earnings
- Full-time defined as employees working more than 30 paid hours per week (or 25 or more for the teaching professions)
- Dashed lines represent discontinuities in 2004, 2006 and 2011 ASHE estimates
- 2014 data are provisional
Download this chart Figure 9: Gender pay gap for median full-time gross hourly earnings (excluding overtime) by age group, UK, April 2014
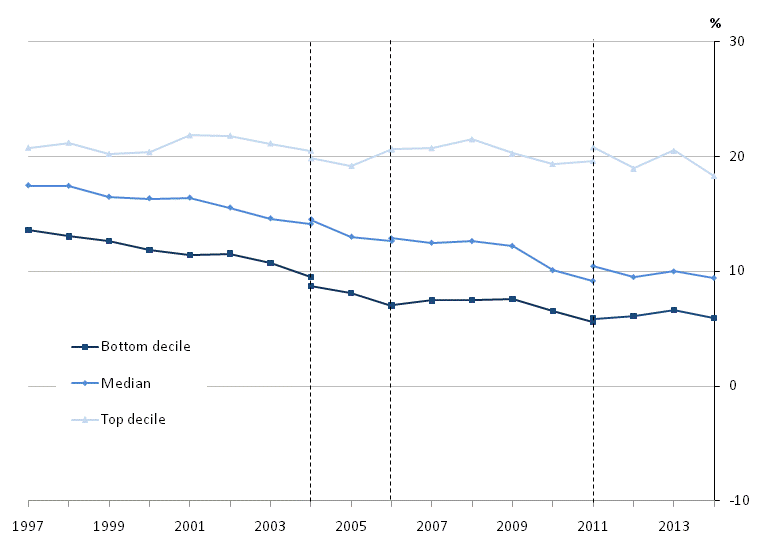
Image .csv .xlsFigure 10 examines the gender pay gap for high and low earners. It is of note that at the 90th percentile (higher earners), the gap is the lowest since the series began (18.3%), although over time this has remained largely consistent, fluctuating around 20%. For lower earners the gap has narrowed over the long term, to 5.9% in April 2014.
Figure 10: Gender pay gap for median gross hourly earnings (excluding overtime) at selected deciles, UK, April 1997 to 2014
Source: Annual Survey of Hours and Earnings (ASHE) - Office for National Statistics
Notes:
- Employees on adult rates, pay unaffected by absence
- Figures represent the difference between men's and women's hourly earnings as a percentage of men's earnings
- Full-time defined as employees working more than 30 paid hours per week (or 25 or more for the teaching professions)
- Dashed lines represent discontinuities in 2004, 2006 and 2011 ASHE estimates
- 2014 data are provisional
Download this image Figure 10: Gender pay gap for median gross hourly earnings (excluding overtime) at selected deciles, UK, April 1997 to 2014
.png (25.9 kB) .xls (48.6 kB)Figure 11 further examines the earnings distribution by gender, for full- and part-time employees separately.
Figure 11: Distribution of gross hourly earnings (excluding overtime), UK, April 2014
Source: Annual Survey of Hours and Earnings (ASHE) - Office for National Statistics
Notes:
- Employees on adult rates, pay unaffected by absence
- Full-time defined as employees working more than 30 paid hours per week (or 25 or more for the teaching professions)
- 2014 data are provisional
Download this chart Figure 11: Distribution of gross hourly earnings (excluding overtime), UK, April 2014
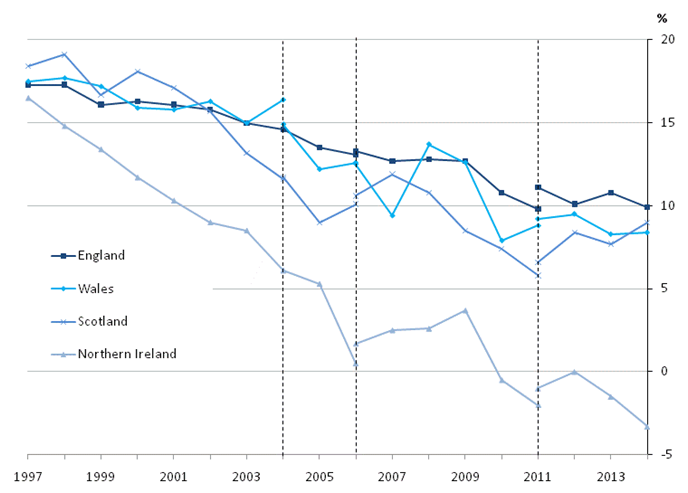
Image .csv .xlsFigure 12 shows the gender pay gap for each UK country. The small ‘negative’ gender pay gap in Northern Ireland is, in part, due to a higher proportion of public sector jobs here than in the rest of the UK. There are more women employed in this sector than men and these jobs tend to be higher paid, in general, than in the private sector.
Figure 12: Gender pay gap for median full-time hourly earnings (excluding overtime) by country, April 1997 to 2014
Source: Annual Survey of Hours and Earnings (ASHE) - Office for National Statistics
Notes:
- Employees on adult rates, pay unaffected by absence
- Full-time defined as employees working more than 30 paid hours per week (or 25 or more for the teaching professions)
- Gender pay gap is defined as the difference between men’s and women’s hourly earnings as a percentage of men’s earnings
- Dashed lines represent discontinuities in 2004, 2006 and 2011 ASHE estimates
- 2014 data are provisional
Download this image Figure 12: Gender pay gap for median full-time hourly earnings (excluding overtime) by country, April 1997 to 2014
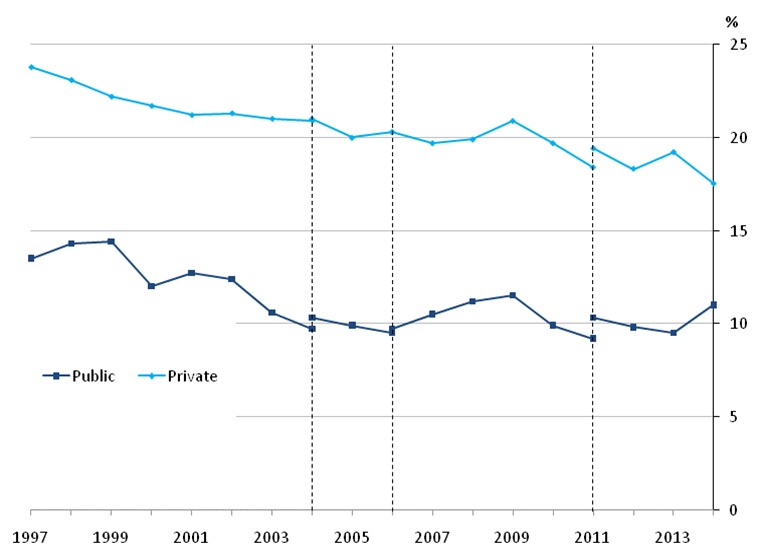
.png (72.8 kB) .xls (60.9 kB)In April 2014, the gender pay gap for the private sector decreased from 19.2% to 17.5%, the lowest since the series began in 1997. The gap in the public sector increased from 9.5% to 11%, although it is of note that this has been relatively stable over the longer term, fluctuating around 10% since 2003. The gap in the private sector has consistently been greater than for the public sector. Note that the composition of the public and private sectors changes from year to year, and this will influence the figures presented. For example, in a given sector, creation of jobs in higher paying occupations with a high proportion of female employees would act to reduce the gap.
Figure 13: Gender pay gap for median full-time hourly earnings (excluding overtime) for public and private sectors, April 1997 to 2014

Source: Annual Survey of Hours and Earnings (ASHE) - Office for National Statistics
Notes:
- Employees on adult rates, pay unaffected by absence
- Gender pay gap is defined as the difference between men’s and women’s hourly earnings as a percentage of men’s earnings
- Full-time defined as employees working more than 30 paid hours per week (or 25 or more for the teaching professions)
- Dashed lines represent discontinuities in 2004, 2006 and 2011 ASHE estimates
- 2014 data are provisional
Download this image Figure 13: Gender pay gap for median full-time hourly earnings (excluding overtime) for public and private sectors, April 1997 to 2014
.png (52.9 kB) .xls (51.2 kB)The gender pay gap also varies by occupation. The gap is positive for all the main occupation groups, ranging from around 3% for sales and customer service, to almost 25% for skilled trades occupations.
Figure 14: Gender pay gap for median full-time hourly earnings (excluding overtime), by major occupation group, UK, April 2014
Source: Annual Survey of Hours and Earnings – Office for National Statistics
Notes:
- Employees on adult rates, pay unaffected by absence
- Gender pay gap is defined as the difference between men’s and women’s hourly earnings as a percentage of men’s earnings
- Full-time defined as employees working more than 30 paid hours per week (or 25 or more for the teaching professions)
- Occupations as defined by the Standard Occupational Classification 2010
- 2014 data are provisional
Download this chart Figure 14: Gender pay gap for median full-time hourly earnings (excluding overtime), by major occupation group, UK, April 2014
Image .csv .xls6. Public and private sector pay
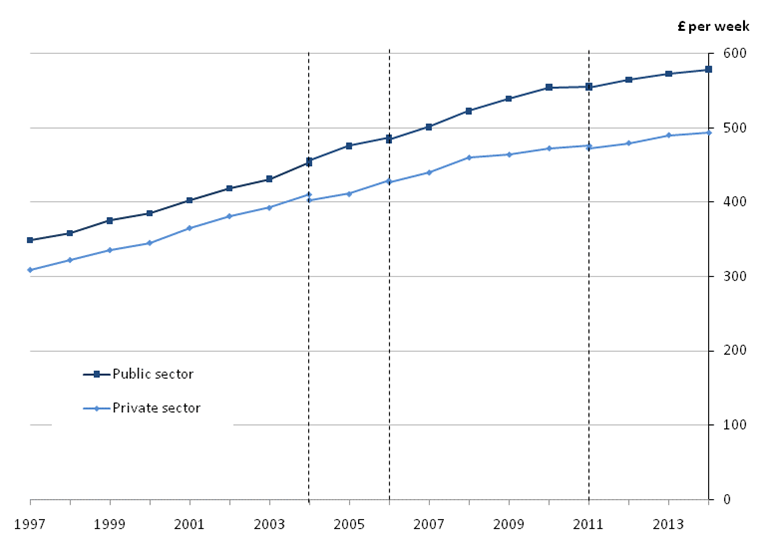
Median full-time weekly earnings for public sector employees have been higher than for private sector employees since the start of the series in 1997. Private sector median weekly earnings were £493 in April 2014 and public sector earnings were £579. The gap has closed slightly over the long term, but private sector earnings have remained consistently at around 85% of public sector earnings since 2008.
The public and private sectors have workforces which are composed quite differently. Consequently, differences in weekly earnings do not reveal differences in rates of pay for comparable jobs. For example, many of the lowest paid occupations, such as bar and restaurant staff, hairdressers, elementary sales occupations and cashiers, exist primarily in the private sector, while there are a larger proportion of graduate-level and professional occupations in the public sector.
Figure 15: Median full-time gross weekly earnings for public and private sectors, UK, April 1997 to 2014
Source: Annual Survey of Hours and Earnings (ASHE) - Office for National Statistics
Notes:
- Employees on adult rates, pay unaffected by absence
- Full-time defined as employees working more than 30 paid hours per week (or 25 or more for the teaching professions)
- Dashed lines represent discontinuities in 2004, 2006 and 2011 ASHE estimates
- 2014 data are provisional
Download this image Figure 15: Median full-time gross weekly earnings for public and private sectors, UK, April 1997 to 2014
.png (52.7 kB) .xls (59.9 kB)The composition of the public and private sectors changes from year to year. For example, when new jobs are created at the lower end of the earnings distribution, or when highly-paid jobs are lost, this acts to reduce the median. Looking only at jobs in which the employee had been in post for at least one year (thereby removing the influence of the changes in the composition of the labour market), growth rates are consistently higher. For the public sector, the annual increase in weekly earnings becomes 3.7% (compared with 1.0%) and for the private sector it becomes 4.1% (compared with 0.7%).
Figure 16a: Annual percentage change in median full-time gross weekly earnings for all employees and those in continuous employment, public and private sectors, UK, April 2005 to 2014
Public sector
Source: Annual Survey of Hours and Earnings (ASHE) - Office for National Statistics
Notes:
- Employees on adult rates, pay unaffected by absence
- Full-time defined as employees working more than 30 paid hours per week (or 25 or more for the teaching professions)
- 2014 data are provisional
Download this chart Figure 16a: Annual percentage change in median full-time gross weekly earnings for all employees and those in continuous employment, public and private sectors, UK, April 2005 to 2014
Image .csv .xls
Figure 16b: Annual percentage change in median full-time gross weekly earnings for all employees and those in continuous employment, public and private sectors, UK, April 2005 to 2014
Private sector
Source: Annual Survey of Hours and Earnings (ASHE) - Office for National Statistics
Notes:
- Employees on adult rates, pay unaffected by absence
- Full-time defined as employees working more than 30 paid hours per week (or 25 or more for the teaching professions)
- 2014 data are provisional
Download this chart Figure 16b: Annual percentage change in median full-time gross weekly earnings for all employees and those in continuous employment, public and private sectors, UK, April 2005 to 2014
Image .csv .xls7. Regional earnings
In April 2014, London topped the regional list for median earnings for full-time employees, at £660 per week. Employees here earned £119 more per week than the next highest, the South East (£541) and £143 more than the median for the whole of the UK (£518). The high pay in London is largely due to a high proportion of its labour force being employed in high-paying industries and occupations, and also because many employees are entitled to allowances for working in the capital.
The regional pattern has remained fairly consistent since the series began in 1997, with London and the South East consistently topping the list.
At the local authority level, earnings vary significantly. In April 2014 full-time employees working in the City of London had the highest median gross weekly earnings (£928) and those working in Rother had the lowest (£379). To explore these geographic differences further an interactive map showing earnings by local authority and an animated chart showing changes in weekly earnings by region over time are available. Screenshots are shown below.
It should be noted that earnings comparisons take no account of variations in prices for goods and services between regions and therefore do not necessarily indicate differences in the standard of living. Neither do they take account of differences in the regional composition of the workforce, meaning that like-for-like comparisons may not be appropriate. For example, a region might have a lower level of median earnings than another if it has a higher proportion of employees in industries or occupations with relatively low earnings.
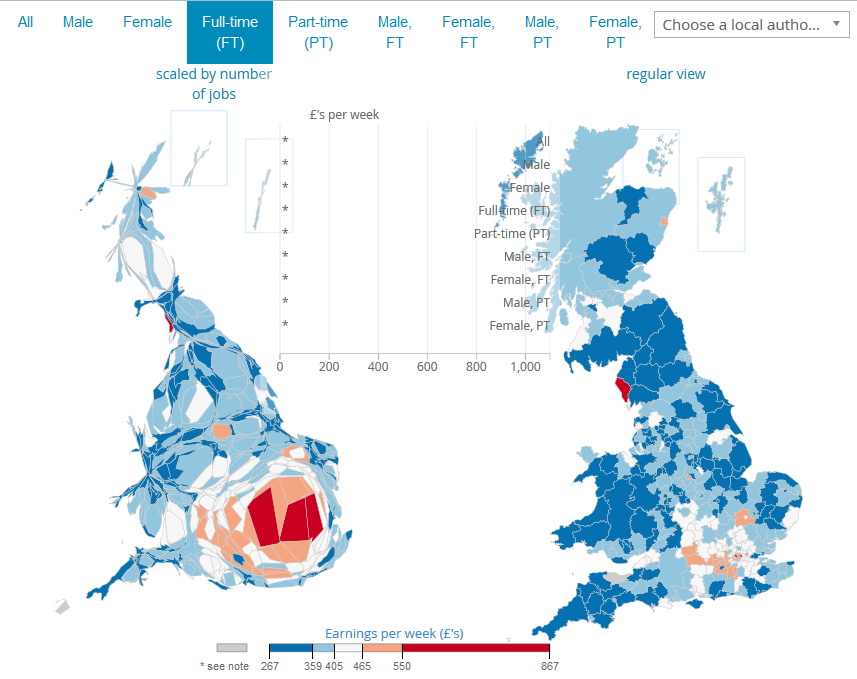
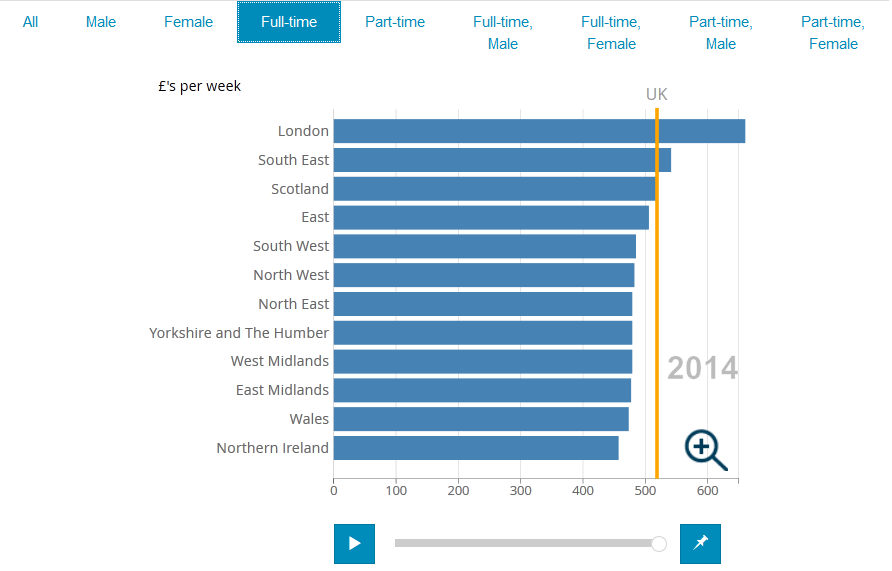
Figure 17: Median full-time gross weekly earnings by region, UK, April 2014
Source: Annual Survey of Hours and Earnings – Office for National Statistics
Notes:
- Employees on adult rates, pay unaffected by absence
- Full-time defined as employees working more than 30 paid hours per week (or 25 or more for the teaching professions)
- 2014 data are provisional
Download this chart Figure 17: Median full-time gross weekly earnings by region, UK, April 2014
Image .csv .xls8. Earnings by age group
Median weekly earnings for full-time employees reach a maximum in the 40-49 age group for men and in the 30-39 age group for women.
Figure 18: Median full-time gross weekly earnings by sex and age group, UK, April 2014
Source: Annual Survey of Hours and Earnings (ASHE) - Office for National Statistics
Notes:
- All employees aged 16-17 and employees aged 18 and over on adult rates, pay unaffected by absence
- Full-time defined as employees working more than 30 paid hours per week (or 25 or more for the teaching professions)
- 2014 data are provisional
Download this chart Figure 18: Median full-time gross weekly earnings by sex and age group, UK, April 2014
Image .csv .xls9. Earnings by occupation
Changes in occupation classifications restrict the ability to analyse trends over time so April 2014 data are the focus here.
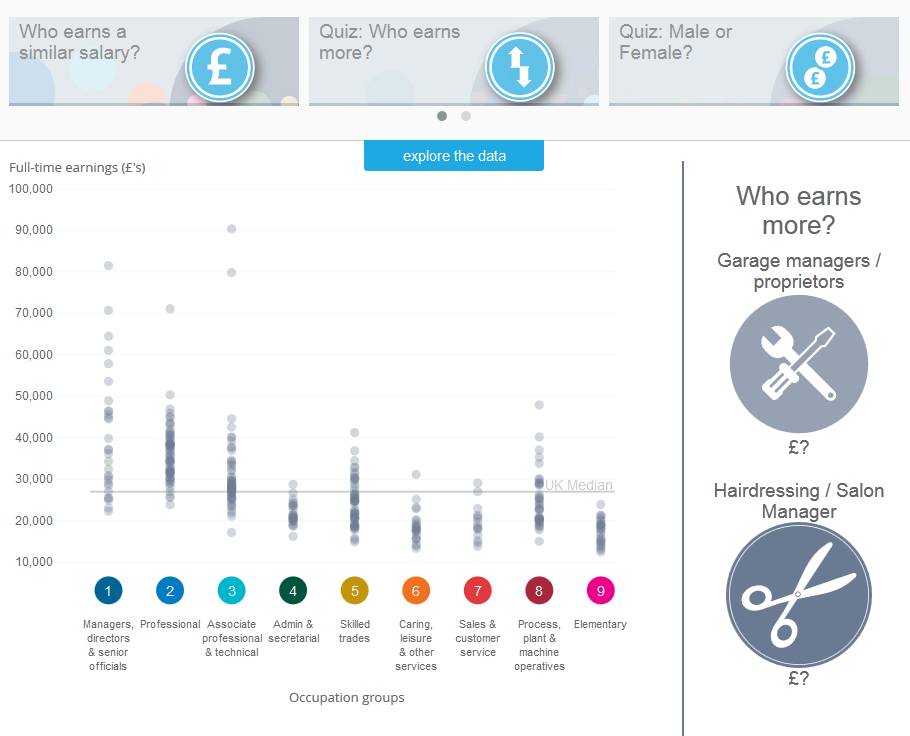
The occupation group with the highest median weekly earnings for full-time employees was managers, directors and senior officials, at £769. Sales and customer service occupations were the lowest paid group, at £332 per week.
This year, a new interactive tool is available which allows earnings by occupation to be explored in more detail. A screenshot is shown below.

Figure 19: Median full-time gross weekly earnings by major occupation group, UK, April 2014
Source: Annual Survey of Hours and Earnings (ASHE) - Office for National Statistics
Notes:
- Employees on adult rates, pay unaffected by absence
- Full-time defined as employees working more than 30 paid hours per week (or 25 or more for the teaching professions)
- Occupations as defined by the Standard Occupational Classification 2010
- 2014 data are provisional
Download this chart Figure 19: Median full-time gross weekly earnings by major occupation group, UK, April 2014
Image .csv .xls10. The make-up of earnings
Overtime payments as a proportion of mean gross weekly earnings have remained relatively stable in recent years for both men and women, following a sharp fall coinciding with the economic downturn. Incentive payments have shown a similar trend, although for men, these payments accounted for 1.4% of weekly earnings in 2014, a drop of 0.2 percentage points compared to 2013.
As is the case in previous years, overtime and incentive payments account for a greater proportion of mean gross weekly pay for men than they do for women.
Figure 20: Non-basic components of pay as a proportion of mean full-time gross weekly earnings, April 2000 to 2014

Source: Annual Survey of Hours and Earnings (ASHE) - Office for National Statistics
Notes:
- Employees on adult rates, pay unaffected by absence
- Full-time defined as employees working more than 30 paid hours per week (or 25 or more for the teaching professions)
- Dashed lines represent discontinuities in 2004, 2006 and 2011 ASHE estimates
- A methodological change in 2005 means that estimates for incentive payments from this time onwards are not comparable with earlier estimates
- 2014 data are provisional
Download this image Figure 20: Non-basic components of pay as a proportion of mean full-time gross weekly earnings, April 2000 to 2014
.png (23.7 kB) .xls (46.6 kB)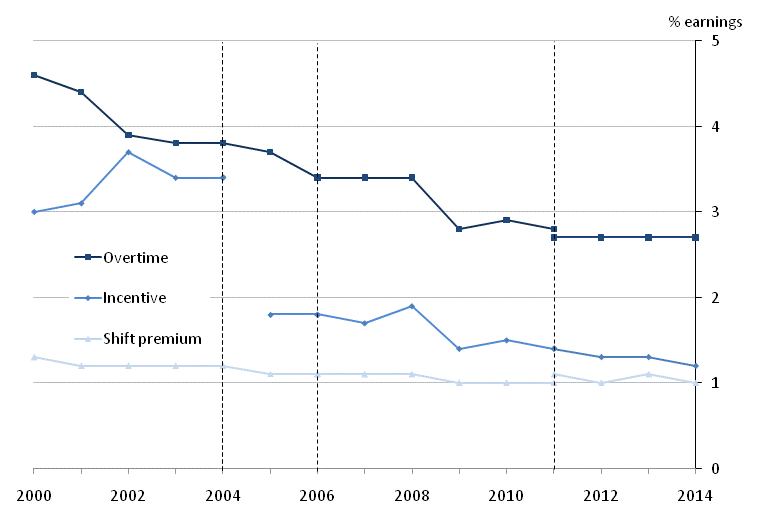
11. Hours worked
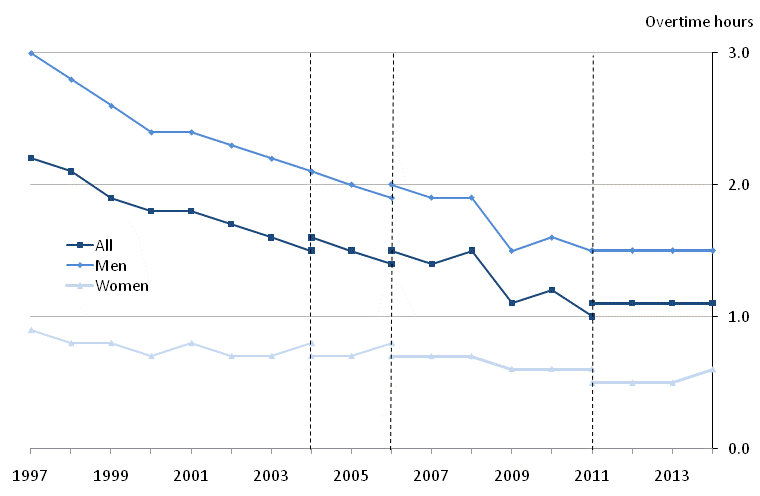
Over the long-term, the average number of hours worked per week for full-time employees has decreased from 40.0 in 1997 to 39.2 in 2014. This decrease is particularly notable for men, while women’s hours have remained stable at around 37.5. For men, there was a sharp dip between 2008 and 2009, and hours worked have not returned to the levels seen prior to the economic downturn. Examining the components of hours worked, there is a long-term decrease in overtime, particularly for men.
Figure 21: Mean full-time weekly paid hours of work (including overtime), UK, April 1997 to 2014

Source: Annual Survey of Hours and Earnings (ASHE) - Office for National Statistics
Notes:
- Employees on adult rates, pay unaffected by absence
- Full-time defined as employees working more than 30 paid hours per week (or 25 or more for the teaching professions)
- Dashed lines represent discontinuities in 2004, 2006 and 2011 ASHE estimates
- 2014 data are provisional
Download this image Figure 21: Mean full-time weekly paid hours of work (including overtime), UK, April 1997 to 2014
.png (23.7 kB) .xls (76.8 kB)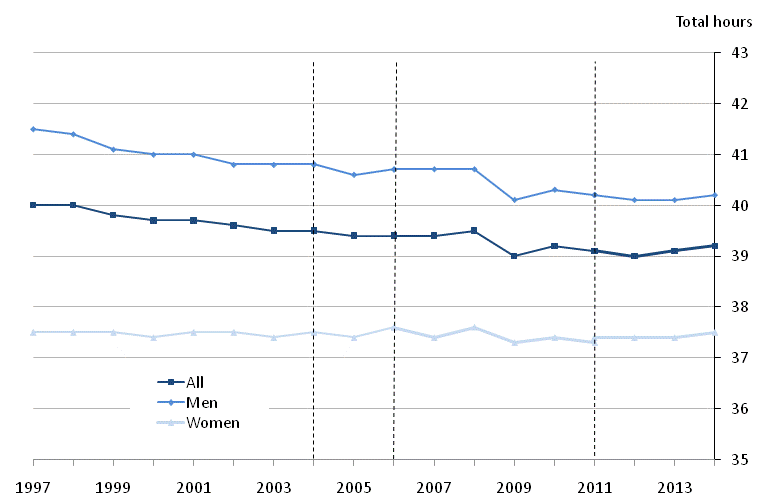
Figure 22: Mean weekly overtime hours, UK, April 1997 to 2014

Source: Annual Survey of Hours and Earnings (ASHE) - Office for National Statistics
Notes:
- Employees on adult rates, pay unaffected by absence
- Full-time defined as employees working more than 30 paid hours per week (or 25 or more for the teaching professions)
- Dashed lines represent discontinuities in 2004, 2006 and 2011 ASHE estimates
- 2014 data are provisional