1. Main points
London and Aberdeen had the highest labour productivity (gross value added (GVA) per hour worked) of UK city regions at 30% and 17% above the UK average respectively in 2014. Bristol also had productivity above the UK average. City regions in the North and Midlands of England had productivity between 9-14% below the UK average.
All NUTS1 3 areas in London had productivity above the UK average in 2014 with the highest in Tower Hamlets (85% above the UK average). In the rest of the South of England, Berkshire and East Surrey had the highest productivity levels at 28% and 27% above the UK average respectively while the lowest levels were to be found in Cornwall, Torbay and Southend-on-Sea.
The highest labour productivity levels in the North and Midlands of England in 2014 were in Cheshire East, Derby and Solihull at 14%, 8% and 6% above the UK average respectively. Blackpool, Nottingham and Blackburn with Darwen had the lowest levels.
In Scotland, Aberdeen City and Aberdeenshire, and City of Edinburgh, had the highest labour productivity levels at 17% and 7% above the UK average with the lowest productivity levels found in Dumfries and Galloway.
Overall, 27 out of 147 NUTS 3 areas outside of London had labour productivity above the UK average in 2014, with 19 of these areas in the South of England (South East, South West and East of England), 5 in the North and Midlands and 3 in Scotland.
Of the 34 NUTS 3 areas with labour productivity more than 15% below the UK average in 2014, 3 were in the South of England, 5 in Scotland, 7 in Wales, 8 in the Midlands and 11 in the North of England. The lowest productivity levels were found in Powys in Wales and Blackpool in North West England.
Notes for main points
- NUTS = Nomenclature of Territorial Units for Statistics. For more information about the current classification, see the Geographies note in the Methodology section.
2. Introduction
This article provides Experimental Statistics1 for 2 measures of labour productivity, GVA per hour worked and GVA per filled job. They are provided for the NUTS2 and NUTS3 subregions of the UK, and for Local Enterprise Partnerships (LEPs) in England. Statistics are also provided for selected UK City Regions.
The data in this report measure labour productivity. Labour productivity measures the amount of output produced by a unit of labour input. A higher level of productivity means that a higher level of output is being produced per unit of labour input.
Productivity matters because increasing productivity is critical to increasing economic growth in the long run. This follows from the fact that economic output can only be increased by either increasing the amount of inputs or by raising productivity. Increasing productivity is, therefore, an important aim for both national and local economies. As shown in the "Results" sections in this report, there is currently a wide spatial divergence in levels of productivity between different subregions.
The preferred measure of labour productivity is GVA per hour worked, and the text in this article focuses on this measure. Data are also available in the datasets for GVA per filled job.
For users interested only in a brief summary of the main results, the article is structured to include these summaries upfront. For those who wish to examine the data in more detail, the 2 sections "interpreting the data" and "methodology" both aim to provide useful information to help users understand and get the most from the data that are available in the attached datasets.
In addition, users may be interested to note that some limited data for an alternative measure of productivity, one that excludes rental income from total GVA, has also been provided. Further details of this measure, and a discussion of the reasons for its inclusion, are included in the relevant results and methodology sections.
Notes for introduction
- For more information about Experimental Statistics, see the guide on our website.
3. Results by NUTS2 subregions and city regions.
This section presents the main results of the labour productivity estimates for the 40 NUTS2 subregions of the UK, focusing on estimates of nominal GVA per hour worked. Productivity calculations for selected UK city regions based on the same indicator are also provided. All data have been smoothed based on a weighted average of up to 5 years data (see methodology section for more information).
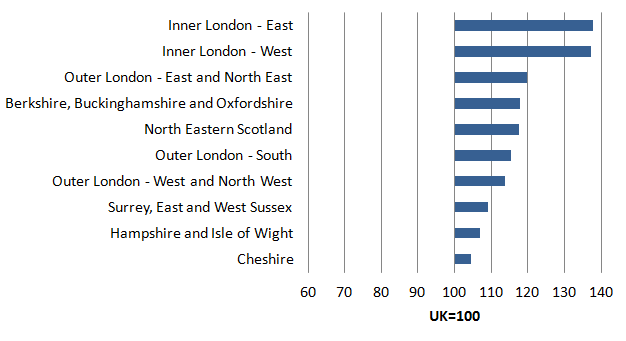
Figure 1: GVA per hour worked - highest ranking UK NUTS2 subregions, 2014
UK
Source: Office for National Statistics
Download this image Figure 1: GVA per hour worked - highest ranking UK NUTS2 subregions, 2014
.png (12.4 kB) .xls (27.6 kB)
All 5 NUTS2 subregions in the Greater London area ranked among the 10 most productive in the UK in terms of GVA per hour worked. They all registered productivity levels above the UK average. Inner London East showed the highest productivity level, with a GVA per hour worked around 38% higher than the UK average. This was followed by Inner London West with a marginally smaller productivity level. Berkshire, Buckinghamshire and Oxfordshire was the first NUTS2 area outside Greater London to rank among the 10 most productive areas in UK, with productivity 18% above average. This was followed by North Eastern Scotland with a slightly smaller productivity level. Overall, only 11 out of the 40 NUTS2 subregions had productivity levels above the UK average.
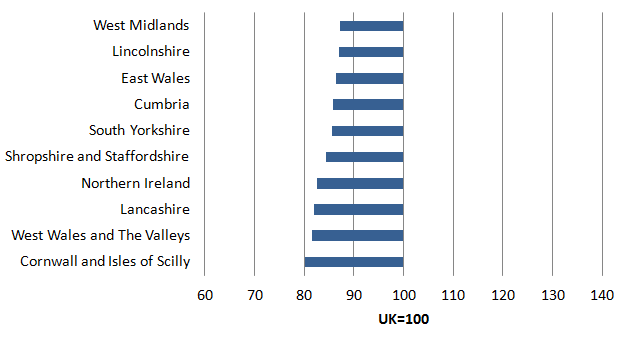
Figure 2: GVA per hour worked - lowest ranking UK NUTS2 subregions, 2014
UK
Source: Office for National Statistics
Download this image Figure 2: GVA per hour worked - lowest ranking UK NUTS2 subregions, 2014
.png (10.6 kB) .xls (30.7 kB)
Figure 2 shows the NUTS2 regions with the lowest labour productivity levels. Each had productivity at least 12% below the UK average. Most of the places with the lowest productivity levels were more rural areas of the country, for example, Cornwall and Isles of Scilly and West Wales and The Valleys. However, there are also some predominantly urban areas shown in Figure 2 including South Yorkshire and West Midlands.
Figure 3 provides labour productivity for selected UK city regions in 2014. City regions are of particular policy interest at the present time. In England, a number of city region areas have been granted increased devolution powers over the past 2 years, while in Scotland and Wales city deals have been agreed between some city regions and the UK government. Therefore, whilst it should be noted that there is no official city regions geography for the UK, the list of areas included (and the boundaries chosen) in Figure 3 are as close as possible to those used in the recent devolution and city deal agreements. Where no deal has been made to date, the boundaries reflect those in combined authority proposals, or in discussions occurring locally around greater joint working.
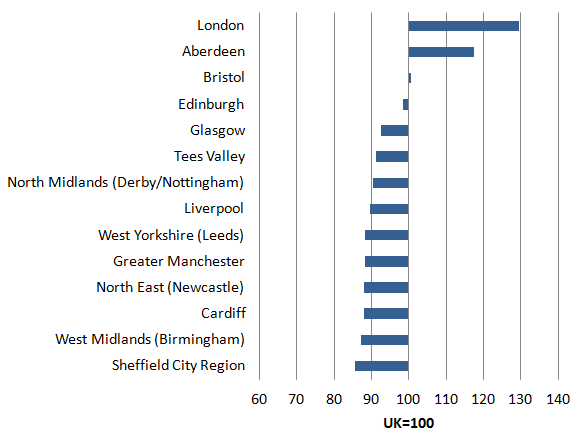
Figure 3: GVA per hour worked - City Regions, 2014
Source: Office for National Statistics
Download this image Figure 3: GVA per hour worked - City Regions, 2014
.png (13.0 kB) .xls (27.6 kB)
Confirming the high productivity performance of London, Greater London was the top performer in 2014, with a productivity almost 30% above the UK average. This was followed by the Aberdeen city region with productivity around 17% above average. Bristol and Edinburgh city regions both had productivity close to the UK average. Elsewhere, the city regions had productivity between 7 and 14% below the UK average. Sheffield City Region had the lowest productivity, with productivity 14% below the UK average, while West Midlands had productivity 13% below the UK average.
Back to table of contents4. Results for England, Scotland, Wales and Northern Ireland by NUTS3 subregions
This section presents the results of the labour productivity estimates for England, Scotland, Wales and Northern Ireland by NUTS3 subregions in 2014. Results for England are presented separately for London, the rest of the South of England, the Midlands and the North to provide a more detailed account of labour productivity levels. Except for Northern Ireland, the labour productivity estimates focus on nominal GVA per hour worked as the preferred subregional labour productivity measure. For Northern Ireland, the productivity estimates are based on nominal GVA per job filled1. In all cases, the data have been smoothed based on a weighted moving average of up to 5 years data (see methodology section for more information).
Results for London
Figure 4 shows the NUTS3 subregions in the Greater London area with the highest and lowest productivity levels.
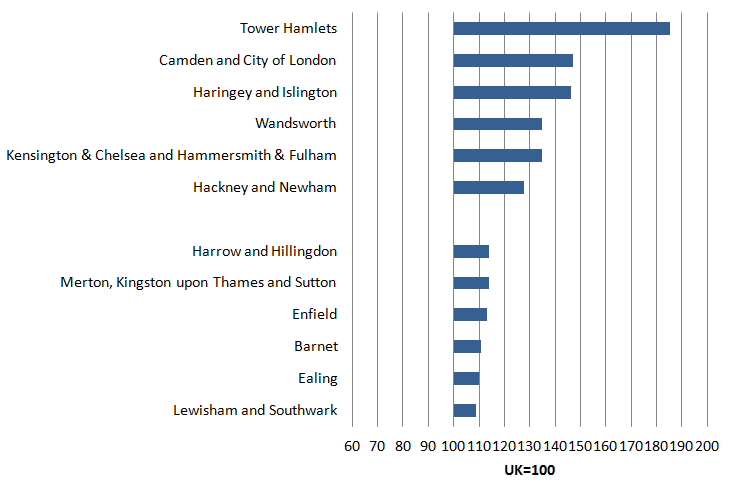
Figure 4: GVA per hour worked - London - highest and lowest ranking NUTS3 subregions, 2014
Source: Office for National Statistics
Download this image Figure 4: GVA per hour worked - London - highest and lowest ranking NUTS3 subregions, 2014
.png (16.2 kB) .xls (35.8 kB)
All NUTS3 subregions in the Greater London area displayed productivity levels above the UK average. The highest level was reached by Tower Hamlets, with a productivity level 85% above UK average. This was followed by Camden and the City of London, with productivity 47% above the UK average. The productivity of these two NUTS3 subregions was also the highest in the UK. At the lower end of the productivity spectrum shown in Figure 4, the levels ranged from a minimum of around 9% above UK average in Lewisham and Southwark to around a maximum of 14% above average in Harrow and Hillingdon.
It should be noted that the very high productivity levels in the Greater London region lead to a skewed distribution of productivity levels across the UK such that relatively few subregions have productivity levels above the UK (mean) average. In 2014, just 48 out of 168 NUTS3 subregions across England, Scotland and Wales had a GVA per hour worked above the UK average, of which 21 were in London.
Given the skewed nature of the distribution, it is worth considering how the productivity level of the mid-ranking (median) subregions compares with the UK average. In 2014, the subregion occupying the middle position in the NUTS3 productivity ranking had a GVA per hour worked of around 92% of the UK average; that is, a productivity level that was 8% below the UK average.
Results for the South of England (excluding London)
Figure 5 shows the highest and lowest levels of productivity in the NUTS3 subregions in the South of England (excluding London), which takes in the subregions in the South East, South West and East of England regions of England.
Figure 5: GVA per hour worked - South of England (excl. London) - highest and lowest ranking NUTS3 subregions, 2014

Source: Office for National Statistics
Download this image Figure 5: GVA per hour worked - South of England (excl. London) - highest and lowest ranking NUTS3 subregions, 2014
.png (11.6 kB) .xls (27.6 kB)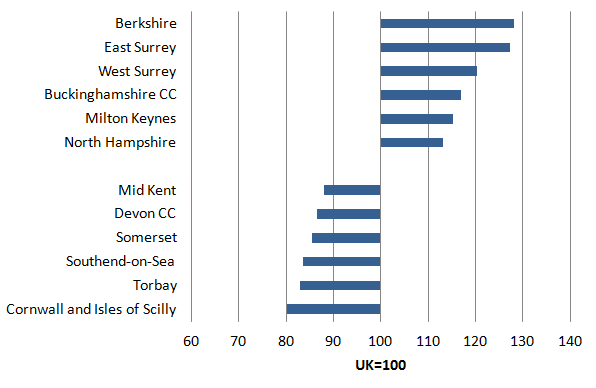
Productivity levels well above the UK average also occurred in the most productive areas of the South of England outside Greater London. Berkshire and East Surrey both displayed productivity levels around 27 to 28% above UK average, the highest levels outside of London. Overall, 19 out of 49 NUTS 3 subregions in the South of England had productivity above the UK average.
The lowest labour productivity levels in 2014 in the South of England were generally in rural or coastal areas. The lowest was in Cornwall and Isles of Scilly, followed by Torbay and Southend-on-Sea.
Results for the Midlands
Figure 6 shows the NUTS3 subregions with the highest and lowest productivity in the Midlands, comprising the West Midlands and East Midlands regions.
Figure 6: GVA per hour worked - Midlands - highest and lowest ranking NUTS3 subregions, 2014

Source: Office for National Statistics
Download this image Figure 6: GVA per hour worked - Midlands - highest and lowest ranking NUTS3 subregions, 2014
.png (11.4 kB) .xls (27.6 kB)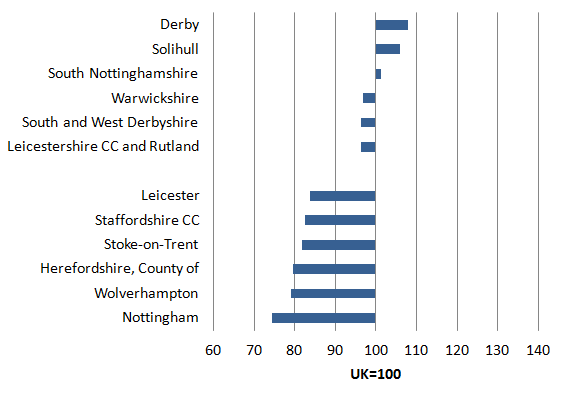
In the Midlands, there were 3 NUTS3 subregions with productivity levels above the UK average in 2014. Derby had the highest productivity level, 8% above the UK average. This was followed by Solihull, 6% above the UK average. At the other end of the distribution, productivity levels of at least 20% below the UK average were registered in Nottingham, Wolverhampton and the County of Herefordshire.
Results for the North of England
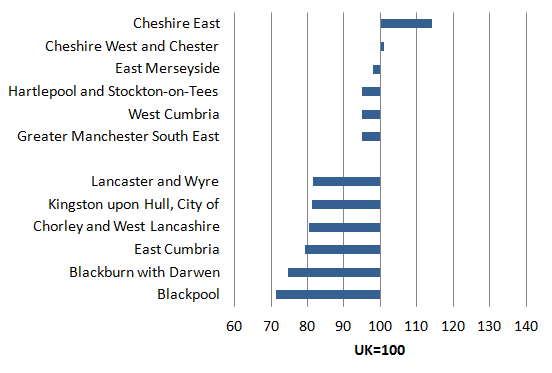
Figure 7 shows the NUTS3 subregions with the highest and lowest productivity in the North of England, comprising the North West, North East and Yorkshire and The Humber regions.
Figure 7: GVA per hour worked - North of England - highest and lowest ranking NUTS3 subregions, 2014
Source: Office for National Statistics
Download this image Figure 7: GVA per hour worked - North of England - highest and lowest ranking NUTS3 subregions, 2014
.png (12.0 kB) .xls (27.6 kB)
With the highest labour productivity in the North of England, Cheshire East achieved a productivity level of 14% above the UK average in 2014. This is followed by Cheshire West and Chester, with productivity marginally above the UK average. All other best performing NUTS3 regions presented in the chart had productivity levels below the UK average. The lowest productivity performance was recorded in North West subregions, with productivity levels at least 20% below the UK average for Blackpool, Blackburn with Darwen and East Cumbria.
Results for Scotland
Figure 8 shows the productivity ranking of NUTS3 subregions for Scotland focusing on the subregions with the highest and lowest levels.
Figure 8: GVA per hour worked - Scotland - highest and lowest ranking NUTS3 subregions, 2014

Source: Office for National Statistics
Download this image Figure 8: GVA per hour worked - Scotland - highest and lowest ranking NUTS3 subregions, 2014
.png (14.5 kB) .xls (27.6 kB)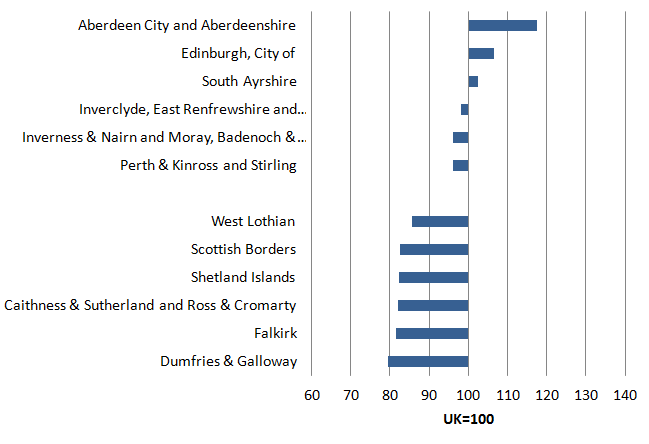
In Scotland, Aberdeen City and Aberdeenshire registered the highest productivity level in 2014, 17% above the average for the UK. The City of Edinburgh followed in the ranking, 7% above the UK average. Dumfries & Galloway had the lowest estimated productivity level, just 20% below the average for the UK.
Results for Wales
Figure 9 shows the ranking of productivity levels for all NUTS3 subregions in Wales.
Figure 9: GVA per hour worked - Wales - NUTS3 subregions, 2014
Source: Office for National Statistics
Download this image Figure 9: GVA per hour worked - Wales - NUTS3 subregions, 2014
.png (11.8 kB) .xls (27.6 kB)
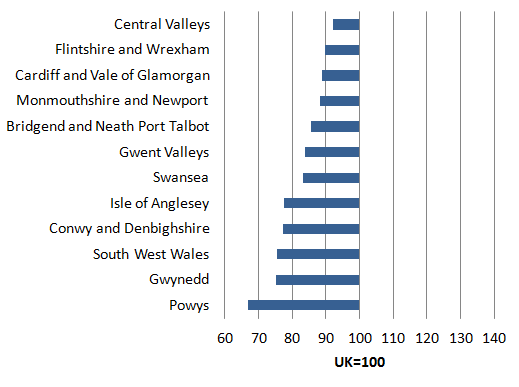
Productivity levels in all NUTS3 subregions in Wales were below the average for the UK. The NUTS3 subregion with the highest level of labour productivity was Central Valley, with productivity 8% below the UK average. Flintshire and Wrexham, Cardiff and the Vale of Glamorgan, Monmouthshire and Newport all displayed levels of productivity around 10 to 12% below the UK average. The lowest performance was the rural subregion of Powys, with a level 33% below the UK average, the lowest level in the UK.
Results for Northern Ireland
Figure 10 shows the ranking in productivity levels for all NUTS3 subregions in Northern Ireland. Unlike all other productivity measures in this article which are based on nominal GVA per hour worked, data for Northern Ireland are available only as GVA per filled job.
Figure 10: GVA per filled Job - Northern Ireland - NUTS3 subregions, 2014
Source: Office for National Statistics
Download this image Figure 10: GVA per filled Job - Northern Ireland - NUTS3 subregions, 2014
.png (7.2 kB) .xls (27.1 kB)
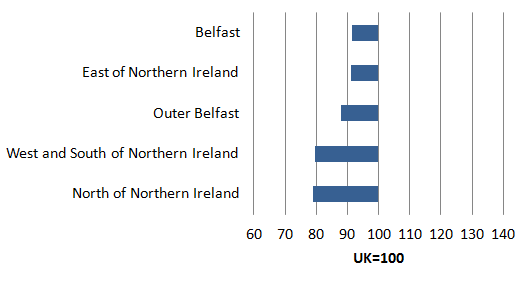
Productivity measured as nominal GVA per filled job shows that all NUTS3 subregions in Northern Ireland ranked below the UK average in 2014. The strongest performance was recorded in Belfast, with productivity levels around 9% below the UK average. The North of Northern Ireland was the weakest performing subregion, with productivity around 21% below UK average.
Notes for Results for England, Scotland, Wales and Northern Ireland by NUTS 3 subregions
- GVA per hour NUTS 3 data for Northern Ireland are not available. Data are available for GVA per job filled.
5. Results by Local Enterprise Partnerships
Local Enterprise Partnerships (LEPs) are partnerships in England between local authorities and businesses. They were created in 2011 and their role is to help shape local economic priorities and undertake activities to encourage local economic growth and the creation of jobs. There are 39 LEPs. Every local authority in England belongs to at least one LEP. However, some local authorities belong to more than one LEP.
Figure 11 shows the highest and lowest productivity levels for LEPs based on nominal gross value added (GVA) per hour worked for 2014.
Figure 11: GVA per hour worked - highest and lowest ranking LEPs, 2014
England

Source: Office for National Statistics
Download this image Figure 11: GVA per hour worked - highest and lowest ranking LEPs, 2014
.png (12.7 kB) .xls (35.8 kB)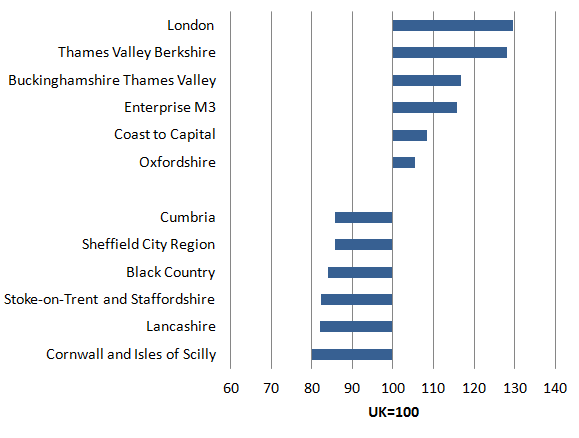
In 2014, London was the LEP with the highest productivity, almost 30% above the UK average. The London LEP was followed by Thames Valley Berkshire, with a slightly smaller productivity level of around 28% above the UK average. Thames Valley Berkshire has a specialism in the "Information and Communication" sector of the UK economy and this is likely to be a factor behind its strong productivity performance.
It is notable that the 6 top performing LEPs shown in Figure 11 were located within the regions of the Greater South East (East of England, South East, and London). In total, there were 12 LEPs with GVA per hour worked above the UK average.
All 6 LEPs with the lowest GVA per hour worked shown in Figure 11 had GVA per hour worked at least 14% below the UK average. Cornwall and Isles of Scilly had the lowest productivity, ranking 20% below the UK average. This was followed by two LEPs in the North West of England, namely Lancashire and Stoke-on-Trent and Staffordshire.
Back to table of contents6. Alternative results excluding rental income
All productivity calculations presented in this article to date adopt total gross value added (GVA) as measure of output. However, it can be argued that not all GVA components are equally relevant when assessing labour productivity, with some elements of GVA not directly related to the input of labour. In particular, rental values, such as those for owner-occupied dwellings, could be excluded from total GVA to obtain a measure of output more closely related to the measurable labour input.
This section briefly assesses the impact on labour productivity from excluding rental income from the calculations. This should be considered as a preliminary analysis and aims to inform you about the impact that rental income has on productivity calculations. We would be interested to receive your feedback as to whether you are interested in this approach being taken further in subsequent subregional productivity releases.
Figure 12 shows the NUTS3 subregions for which exclusion of rental income has the strongest impact in either increasing or decreasing labour productivity estimates compared with the Total GVA per hour worked data presented in the rest of this article.
Figure 12: NUTS 3 subregions with largest and smallest productivity changes when excluding rental income from GVA
GB

Source: Office for National Statistics
Download this image Figure 12: NUTS 3 subregions with largest and smallest productivity changes when excluding rental income from GVA
.png (14.6 kB) .xls (36.9 kB)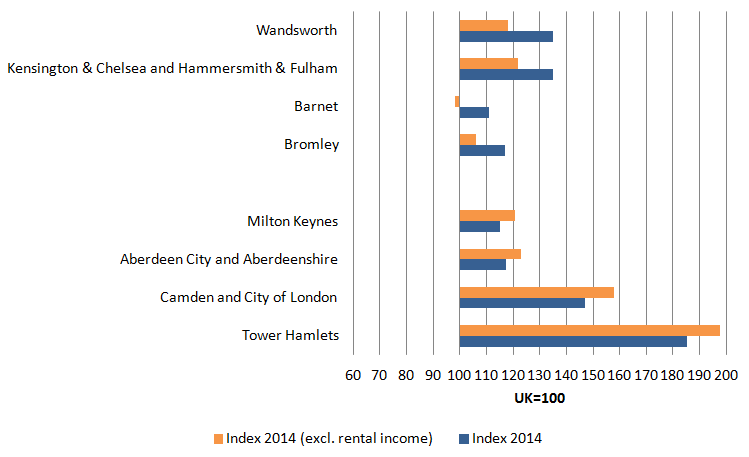
A point to note from Figure 12 is that NUTS3 subregions in London appeared among those most affected in both directions. In particular, Wandsworth and Kensington & Chelsea and Hammersmith & Fulham are the NUTS3 subregions that experience the largest decrease in productivity index with the removal of rental incomes, whereas Tower Hamlets and Camden and the City of London are those most affected in the opposite direction. Therefore, for the London area, it would be inappropriate to assume a uniform impact on productivity levels from the removal of rental income.
If you wish to investigate this issue in more detail, data are available in the dataset accompanying this article for productivity calculated excluding rental incomes. This data is available for GVA per hour worked data for NUTS 2 and NUTS 3 subregions only. As mentioned above, we would be interested to receive your feedback as to whether you see value in the production of subregional productivity statistics excluding rental incomes and if so, whether this should be in addition to, or as a replacement for, the calculations using the total GVA measure.
Back to table of contents7. Interpreting the Data
This section discusses some useful information that may be of help to utilise and interpret the data in this release including the accompanying datasets. In particular, it examines:
The differences, in terms of analysing economic performance, between the labour productivity data in this release and GVA per head data.
The differences between the 2 labour productivity measures included in this release, namely GVA per hour worked and GVA per filled job
Using the data in this release for time series analysis.
You may also find it useful to examine the "methodology" section which provides further details on the smoothing process, geographies, data revisions and consistency with our other productivity data.
7.1. Comparison of labour market productivity measures and GVA per head
GVA per head has historically been, and often still is, used as a catch-all indicator of a subregion's economic performance. However, there are some significant drawbacks to using GVA per head in this manner which are discussed below. Therefore, it is considered better to use a suite of different indicators, including the productivity measures published in this article, when assessing the economic performance of regions and subregions.
GVA per head is calculated as the simple ratio of economic activity in a region divided by the number of people living in that region. At first sight, GVA per head appears to be an appropriate indicator of productivity as it compares the output of a region (GVA) with an input (population). However, there are 2 main limitations in this measure that makes GVA per head unsuitable as a regional productivity measure. Firstly, by including all the residential population and not just those who are in employment, the denominator includes residents who are not directly contributing to GVA. GVA per head is therefore impacted by the share of children, pensioners and others not economically active within a subregion. Secondly, the GVA per head is dividing a workplace-based numerator (GVA) by a residence-based denominator (residential population). This means that this measure does not account for people commuting into and out of a region.
For these reasons, GVA per hour worked and GVA per filled job are the most appropriate measure of regional and subregional productivity. These measures only count the input of those who are directly employed in the production process, rather than the whole population. Additionally, they provide a workplace-based labour input denominator to match the workplace-based GVA numerator, thus fully accounting for the impacts of commuting.
The differences in the results between subregional labour productivity and GVA per head can be very large. This is particularly the case for subregions that have large commuting flows, such as Inner London. In such cases, use of GVA per head can give an unrealistic picture of the subregions relative economic performance.
7.2. Difference between GVA per Hour Worked and GVA per Filled Job
GVA per hour worked and GVA per filled job can both be used as measures of labour productivity, but these 2 measures are different. GVA per hour worked apportions GVA to the total hours worked by the workforce in the subregion; GVA per filled job apportions GVA to the number of jobs in the subregion.
There will be some small differences between the results for the 2 measures. This occurs because the average of hours worked per job varies from subregion to subregion as a result of differences in labour market structure and working patterns. For example, a subregion with high levels of part-time employment will tend to have lower average hours worked per job.
GVA per filled job does not take into consideration regional labour market structures or different working patterns, such as the mix of part-time and full-time workers, home workers and job shares. For this reason, GVA per hour worked is a more comprehensive indicator of labour productivity and the preferred measure at sub-national level.
Note that GVA per hour worked data are currently available for the period 2004 to 2014 and GVA per filled job data are available for the period 2002 to 2014.
7.3. Time series trend analysis
Data presented in this publication covers a period of up to 11 years and, subject to the caveats detailed below, it is possible to look at the variation in the data over a period of time.
7.3.1. Choice of smoothed or unsmoothed data.
Caution is needed when carrying out a change over time analysis of the subregional productivity data. Particularly for NUTS3 data, there is volatility in the data that arises from the smaller survey samples inherent within estimates for smaller geographic areas. It is for this reason that smoothed subregional productivity data is presented in this article. The smoothed data reduce the volatility by using weighted data from up to 5 years in producing the estimate for each year.
When using this smoothed data for time-series analysis, examining a particular year-on-year change does not really make sense, because each year’s data are already a weighted average of a number of different years. Therefore, to examine a year-on-year change, for example from 2013 to 2014, the only suitable method would be to use the unsmoothed data that are available in the accompanying datasets.
However, because of the volatility of the data, this year-on-year change may well be due to the volatility arising from the sample errors, as opposed to a "true" change in the data. Furthermore, in the absence of confidence intervals for the subregional productivity data, it is very difficult to determine which actually the case is.
In view of this, time series analysis of the subregional productivity data is better done over a longer period of time. Trends over a longer period of time are less likely to be the result of the volatility around any single year estimate and more likely to be showing a change in the economic performance of the subregion. Such a trend should show up in the smoothed data, as well as the unsmoothed data, so using the smoothed data is appropriate when considering the trend over the full data time series.
7.3.2. Interpreting data in index form.
When looking at changes over time, it is also important to keep in mind that the productivity data in this article are presented as indices rather than the actual GVA per hour worked or GVA per filled job. The productivity index shows how well a subregion has performed compared with the rest of the UK, that is, the UK average. Therefore, a decrease in the productivity index number of a subregion does not necessarily mean that the subregion’s productivity has decreased in actual terms; it rather means that the subregion has performed relatively worse than the rest of the UK over the period. In other words, its actual productivity level may have improved, but at a slower rate than the UK overall, thus declining relative to the UK=100 index. Similarly, an increase in the productivity index number means that the subregion has performed better than the rest of the UK. Data on actual GVA per hour worked or GVA per filled job is available in the datasets if you wish to examine the data directly.
Back to table of contents8. Methodology
The subregional productivity data in this article have been compiled to be consistent with the regional productivity data published in our Labour Productivity Statistical Bulletin on 23 December 2015.
We produce both regional and subregional productivity measures on a nominal basis only. In other words, there is no separation of volume and price in the final output. As such, different levels of nominal productivity across different subregions will be impacted by any difference in prices between these subregions, in addition to differences in production volumes per input.
Data accompanying this article are based for the first time on the NUTS geographical classification that came into force on 1 January 2015. More details on the changes introduced by the new NUTS classification are provided in the geography note below.
The LEPs data is based on the latest boundaries as of February 2016. Please see the geography note below for more details of the boundaries used for Solent LEP and Enterprise M3 LEP.
Consistency with regional productivity data
We publish regional productivity data in the "Productivity Measures by Region" table, which is included in the quarterly Labour Productivity statistical bulletin. This regional table includes 2 productivity measures; GVA per filled job and GVA per hour worked. The subregional productivity data have been compiled to be consistent with the data in this regional table.
This requires ensuring that the subregional measures of GVA, jobs and hours are all consistent with the regional totals. The methodology is therefore concerned with how best to apportion the regional totals to the subregional areas. The approach taken is as follows:
GVA
We publish regional GVA data as unsmoothed data on a workplace basis for NUTS 1, NUTS 2 and NUTS 3 geographies. Regional (NUTS1) productivity calculations use the NUTS 1 data which is consistent with the labour input series used, which are also unsmoothed and workplace based. This release uses the published NUTS2 and NUTS3 subregional GVA data.
Jobs
At the regional level, GVA per filled job is calculated using a "Productivity Jobs" series as the denominator. This is compiled from four components; employee jobs, self employed jobs, government supported trainees (GST) and members of Her Majesty’s Forces. For consistency purposes, the regional "Productivity Jobs" series is benchmarked to the national "Productivity Jobs" series, on a quarterly basis. To produce annual totals for regional Productivity Jobs, an average of the four quarters in the year is taken.
For subregional geographies, the "Total Jobs" data series is used to apportion regional productivity jobs to NUTS2 and NUTS3 subregions. This Total Jobs measure is a workplace based measure of jobs that we produce mainly for use in calculating job densities at regional and subregional level. Total jobs data comprise employees (from the Business Register Employment Survey), self-employment jobs (from the Annual Population Survey), government-supported trainees (from Department for Education and Department for Work and Pensions) and HM Forces (from Ministry of Defence).
The total jobs series is used to calculate the proportions of regional jobs within each subregion for each year. These results are then used to apportion the regional "productivity jobs" data series to the subregional level.
Hours
At the national and regional level, GVA per hour worked data are calculated using a "Productivity Hours" series as the denominator. These data are calculated quarterly, based mostly on the Labour Force Survey (LFS), and an annual total is constructed as the average of the four quarters in the calendar year.
At subregional level, only annual productivity data are being produced. Therefore, the Annual Population Survey (APS) is used rather than the LFS as it has a larger sample size1. The process involves calculating total hours for each subregion as the sum of employee hours, self employment hours, hours worked in government training schemes and hours worked by HM Forces.
Employee hours are calculated by using the APS to estimate, for each subregion, the average hours worked per employee job by industry. These industry average hours are then multiplied by the number of employee jobs for each industry in each subregion. For the period from 2009 onwards, the number of employee jobs by industry is derived from the Business Register and Employment Survey (BRES). Prior to that, employee jobs by industry were derived from the Annual Business Inquiry (ABI)2. Self employment hours are calculated from the APS. For government training schemes and HM Forces, the regional totals are allocated to subregions based on each subregion’s share of regional employee plus self employment hours, as calculated in the previous stage.
Adding together the sum of employee hours, self employment hours, hours worked in government training schemes and hours worked by HM Forces provides a total hours estimate for each subregion. Once calculated these NUTS2 and NUTS3 subregional data are then constrained regionally to the NUTS1 ‘Productivity Hours’ data to ensure consistency with regional productivity data.
Smoothing
Unsmoothed time series data at small geographies such as NUTS2 and NUTS3 tend to show volatility, created by sampling and non-sampling errors. Therefore, a weighted average of up to five years has been used to remove this volatility and produce a smoothed time-series. The results presented in this article are based on the smoothed subregional productivity data series. It should be noted that when calculating the subregional productivity data, unsmoothed data has been used at all times. The smoothing process has only been applied to the final results. For any users who would like to make use of the unsmoothed results, these data are included in the datasets accompanying this article.
Geographies
Subregional productivity data are produced in this article for the NUTS2 and NUTS3 geographies. Nomenclature of Units for Territorial Statistics (NUTS) is a geography developed by the European Union to allow comparison of regional and subregional data across the EU-28 member states. A number of our regional and subregional outputs are produced based on the NUTS geography. These include regional and subregional GVA. These GVA data are an input in the calculation of subregional productivity. Each NUTS3 subregion covers the same area as either a single local authority or a combination of 2 or more adjacent local authorities. The data accompanying this article are published for the first time on the NUTS geographical classification that came into force on 1 January 2015:
NUTS1: Wales, Scotland, Northern Ireland and the 9 English regions
NUTS2: 40 sub-regions – mainly groups of counties and unitary authorities
NUTS3: 173 local areas – primarily individual counties and unitary authorities
At NUTS 2 level, the new classification introduces a finer breakdown for the London metropolitan area. The two former NUTS2 area of Inner and Outer London have been replaced by 5 NUTS2 areas. Also at NUTS3 level, the new classification provides a more detailed view of the London area by replacing the former 5 NUTS3 geographies with 21 new areas. For a complete account of the geography changes introduced by the new NUTS classification, please see the ONS Open Geography Portal.
Local Enterprise Partnerships (LEPs) are partnerships in England between local authorities and businesses. They were created in 2011 and their role is to help shape local economic priorities and undertake activities to drive local economic growth and the creation of jobs. There are 39 LEPs. Every local authority in England belongs to at least one LEP. However, some local authorities belong to more than one LEP.
In this report, the LEP boundaries used have been an amalgamation of 1 or more local authorities. For each local authority associated with a LEP, data for the whole of that local authority are included within the LEP estimates.
The exception to this is the Solent and Enterprise M3 LEPs. In these cases, the working boundaries of the LEP cut through existing local authority boundaries. Specifically, parts of the local authorities of New Forest, Test Valley, Winchester and East Hampshire are in the Enterprise M3 LEP and parts are in the Solent LEP. For this release, it has been decided that the whole of these affected local authorities should be allocated to the Enterprise M3 LEP, and to not include them in the estimates for the Solent LEP. This is in line with the approach taken in our recent GVA for LEPs publication, published on 18 February 2016.
Revisions
Data in this release are based on regional GVA data together with productivity jobs and productivity hours data. Each are subject to revisions. These revisions feed into the published subregional productivity data and therefore data have been revised in this publication in comparison with the article published in February 2015.
The regional GVA statistics have been subject to several revisions in their December 2015 release. Changes in the treatment of household rental income have been particularly relevant for the subregional productivity statistics. A change in the average house prices used to calculate the regional allocation of imputed rental of owner-occupied dwellings has had considerable impact on GVA estimates. An additional change in regional allocation of rental income has improved the distribution of rental income at the lower levels of geography. This has had a very wide impact across the NUTS2 and NUTS3 areas. For more details on the changes in regional GVA statistics, please see the section on Methodological Changes of the GVA publication.
Sub-regional productivity jobs and hours data have been revised to be consistent with revisions applied to regional and national productivity jobs and hours data that occurred following a census (2011) based reweighting of the Labour Force Survey.
Timeliness
The timeliness of the data is determined by the release calendar of the subregional GVA data, the total jobs data and the Annual Population Survey from which the hours worked are extracted. Subregional GVA data for 2015 will be available in December 2016 and an update to this article will follow shortly afterwards.
Future developments
A project is underway to develop estimates of real regional and subregional GVA growth using a production approach with experimental data recently published. The development of such estimates will lead to an improvement in the quality of the regional and subregional productivity data that we are able to produce. This is because it allows for a separation of volume and price in the final outputs. This is not possible when calculating productivity using regional and subregional GVA calculated using the income approach. For the moment, however, the GVA(P) data is only experimental and therefore the calculations of subregional productivity continue to use the Regional GVA (I) data, which are National Statistics.
Notes for methodology
For 2005, it was not possible to use APS data, therefore LFS data was used – with the average taken of the 4 LFS surveys carried out in 2005.
BRES data is used for 2009 onwards based on the 2007 UK Standard Industrial Classification (SIC 2007). For data up to 2008, the ABI is used and this is based on the 1992 UK Standard Industrial Classification (SIC 1992).