Table of contents
- Main points
- What is the producer price index (PPI)?
- Output prices: summary
- Supplementary analysis: Output prices
- Output prices: detailed commentary
- Output PPI range of movements
- Input prices: summary
- Supplementary analysis: Input prices
- Input prices: detailed commentary
- Input PPI indices range of movements
- Economic context
- Revisions
- Background notes
1. Main points
The price of goods bought and sold by UK manufacturers, as estimated by the producer price index, continued to fall in the year to February 2016.
Factory gate prices (output prices) for goods produced by UK manufacturers fell 1.1% in the year to February 2016, compared with a fall of 1.0% in the year to January 2016.
Core factory gate prices, which exclude the more volatile food, beverage, tobacco and petroleum products, rose 0.2% in the year to February 2016, compared with no movement in the year to January 2016.
The overall price of materials and fuels bought by UK manufacturers for processing (total input prices) fell 8.1% in the year to February 2016, compared with a fall of 8.0% in the year to January 2016.
Core input prices, which exclude purchases from the more volatile food, beverage, tobacco and petroleum industries, fell 3.4% in the year to February 2016, compared with a fall of 5.1% in the year to January 2016.
Back to table of contents2. What is the producer price index (PPI)?
The Producer Price Index (PPI) is a monthly survey that measures the price changes of goods bought and sold by UK manufacturers and provides an important measure of inflation, alongside other indicators such as Consumer Price Index (CPI) and Services Producer Price Index (SPPI). This statistical bulletin contains a comprehensive selection of data on input and output index series. It contains producer price indices of materials and fuels purchased, and output of manufacturing industry by broad sector.
The output price indices measure change in the prices of goods produced by UK manufacturers (these are often called “factory gate prices”).
The input price indices measure change in the prices of materials and fuels bought by UK manufacturers for processing. These are not limited to just those materials used in the final product, but also include what is required by the company in its normal day-to-day running.
The factory gate price (the output price) is the price of goods sold by UK manufacturers and is the actual cost of manufacturing goods before any additional charges are added, which would give a profit. It includes costs such as labour, raw materials and energy, as well as interest on loans, site or building maintenance, or rent.
Core factory gate inflation excludes price movements from food, beverage, petroleum, and tobacco and alcohol products, which tend to have volatile price movements. It should give a better indication of the underlying output inflation rates.
The input price is the cost of goods bought by UK manufacturers for the use in manufacturing, such as the actual cost of materials and fuels bought for processing.
Core input inflation strips out purchases from the volatile food, beverage, tobacco and petroleum industries to give an indication of the underlying input inflation pressures facing the UK manufacturing sector.
Back to table of contents3. Output prices: summary
Factory gate inflation fell 1.1% in the year to February 2016, compared with a fall of 1.0% last month.
During 2012 and 2013, core factory gate inflation tended to run at a lower rate than total output inflation and showed a smaller degree of volatility. This trend changed in 2014, as total output fell into negative inflation: a result of the downward pressures from petroleum, which is excluded from the core measure of inflation. In 2015, total output inflation has remained consistently below core output price inflation, with total output averaging a fall of 1.7% during 2015 and core output averaging growth of 0.1% in the same period. (Figure A)
Looking at the latest estimates (Table A), movements in factory gate prices over the 12 months to February 2016 were as follows:
- factory gate prices fell 1.1%, compared with a fall of 1.0% in the year to January 2016
- core factory gate prices rose 0.2%, compared with no movement in the year to January 2016
- factory gate inflation excluding excise duty fell 0.9%, compared with a decrease of 0.8% in the year to January 2016
Between January and February 2016:
- factory gate prices increased 0.1%, compared with a decrease of 0.1% last month
- core factory gate prices increased 0.2%, compared with an increase of 0.1% last month
Table A: Output prices (home sales)
| UK, September 2015 to February 2016 | |||||||
| percentage change | |||||||
| All manufactured products | Excluding food, beverage, tobacco and petroleum | All manufactured products excluding duty | |||||
| 1 month | 12 months | 1 month | 12 months | 1 month | 12 months | ||
| 2015 | Sep | -0.1 | -1.8 | 0.1 | 0.2 | -0.1 | -1.6 |
| Oct | -0.2 | -1.5 | -0.1 | 0.3 | -0.2 | -1.3 | |
| Nov | -0.2 | -1.6 | -0.2 | -0.1 | -0.2 | -1.4 | |
| Dec | -0.3 | -1.4 | 0.2 | 0.1 | -0.2 | -1.1 | |
| 2016 | Jan | -0.1 | -1.0 | 0.1 | 0.0 | 0.0 | -0.8 |
| Feb | 0.1 | -1.1 | 0.2 | 0.2 | 0.0 | -0.9 | |
| Source: Office for National Statistics | |||||||
Download this table Table A: Output prices (home sales)
.xls (25.6 kB)
Figure A: Output prices
UK, February 2012 to February 2016
Source: Office for National Statistics
Download this chart Figure A: Output prices
Image .csv .xls4. Supplementary analysis: Output prices
Table B shows the annual percentage change in price across all product groups and Figure B shows their contribution to the annual factory gate inflation rate.
Table B: Output prices, 12 months change, February 2016
| UK | |
| Product group | Percentage change |
| Food products | -1.6 |
| Tobacco and alcohol (incl. duty) | 0.1 |
| Clothing, textile and leather | -0.2 |
| Paper and printing | -0.7 |
| Petroleum products (incl. duty) | -12.8 |
| Chemical and pharmaceutical | -1.4 |
| Metal, machinery and equipment | 0.3 |
| Computer, electrical and optical | 0.2 |
| Transport equipment | 0.5 |
| Other manufactured products | 0.9 |
| All manufacturing | -1.1 |
| Source: Office for National Statistics | |
Download this table Table B: Output prices, 12 months change, February 2016
.xls (26.1 kB)
Figure B: Output prices, contribution to 12 months growth rate, February 2016
UK
Source: Office for National Statistics
Download this chart Figure B: Output prices, contribution to 12 months growth rate, February 2016
Image .csv .xlsTable C shows the monthly percentage change in price across all product groups and Figure C shows their contribution to the month factory gate inflation rate.
Table C: Output prices, 1 month change, February 2016
| UK | |
| Product group | Percentage change |
| Food products | 0.2 |
| Tobacco and alcohol (incl. duty) | 0.0 |
| Clothing, textile and leather | 0.2 |
| Paper and printing | 0.0 |
| Petroleum products (incl. duty) | -0.1 |
| Chemical and pharmaceutical | -0.1 |
| Metal, machinery and equipment | 0.1 |
| Computer, electrical and optical | 0.2 |
| Transport equipment | 0.2 |
| Other manufactured products | 0.0 |
| All manufacturing | 0.1 |
| Source: Office for National Statistics | |
Download this table Table C: Output prices, 1 month change, February 2016
.xls (27.1 kB)
Figure C: Output prices, contribution to 1 month growth rate, February 2016
UK
Source: Office for National Statistics
Download this chart Figure C: Output prices, contribution to 1 month growth rate, February 2016
Image .csv .xls5. Output prices: detailed commentary
Factory gate prices fell 1.1% in the year to February 2016, compared with a decrease of 1.0% in the year to January 2016. This index has now seen negative movements on the year for 20 consecutive months. The main contribution to the annual rate for February 2016 came from petroleum products. Falls in the prices of food products, and chemicals and pharmaceuticals provided smaller contributions towards the fall in the output price of manufactured products (Figure B).
Petroleum product prices fell 12.8% in the year to February 2016. This month’s fall of 12.8% is the second smallest fall seen in this index since November 2014. The fall of 11.3% in the year to January 2016 was the smallest fall seen in this index in the same period. The main contributions to this fall in the latest annual rate came from diesel and gas oil, aviation turbine fuel and motor spirit.
Food products fell 1.6% in the year to February 2016, up from a fall of 2.0% in the year to January 2016. The main contributions to the decrease in the annual indices came from preserved meat and meat products, prepared animal feeds, and bakery and farinaceous products with prices falling by 2.0%, 4.7% and 1.7% respectively on the year.
The monthly price index saw a rise of 0.1% between January and February 2016, up from a fall of 0.1% last month. All product groups showed small movements. The largest upward contributions from food products, transport equipment, and computer, electrical and optical equipment have led to an overall rise in the monthly rate (Figure C).
The monthly index for food products increased 0.2% between January and February 2016, compared with an increase of 0.1% between December 2015 and January 2016. This is the largest increase seen in this index since May 2015 when prices rose by 0.3%. The main contributions to the increase in the monthly indices came from processed and preserved fish, and prepared animal feeds with prices falling by 1.4% and 0.3% respectively on the year.
Between January and February 2016, petroleum prices fell 0.1%, compared with a decrease of 4.3% between December 2015 and January 2016. This is the smallest decrease seen in this index since May 2015. Falling prices of aviation turbine fuel and motor spirit were the main contributions to the fall in the monthly index.
Chemical and pharmaceuticals also fell 0.1% between January and February 2016, compared with an increase of 0.2% between December 2015 and January 2016. Decreases in the prices of basic pharmaceuticals products and preparations, and chemicals and chemical products contributed towards this fall in the monthly index.
Core factory gate inflation
Core factory gate prices, which exclude the more volatile food, beverage, tobacco and petroleum product prices, giving a measure of the underlying factory gate inflation, rose 0.2% in the year to February 2016, compared with no movement (0.0%) in the year to January 2016. An increase in the price of transport equipment and computer, electrical and optical equipment contributed to the increase in the index.
The monthly index showed an increase of 0.2% between January and February 2016, compared with an increase of 0.1% between December 2015 and January 2016. Other manufactured products, transport equipment, and chemicals and pharmaceuticals contributed to the increase in the index.
Output producer price index contribution to change in rate
The annual percentage rate for the output PPI in February 2016 fell 1.1%, down from a fall of 1.0% last month, resulting in a decrease in the annual rate of 0.1 percentage points. This decrease was driven by petroleum products and other manufactured products (Figure D).
Figure D: Output 12 month contribution to change in rate between January and February 2016
UK
Source: Office for National Statistics
Notes:
- The components may not sum exactly to the overall change in the rate due to rounding.
Download this chart Figure D: Output 12 month contribution to change in rate between January and February 2016
Image .csv .xls6. Output PPI range of movements
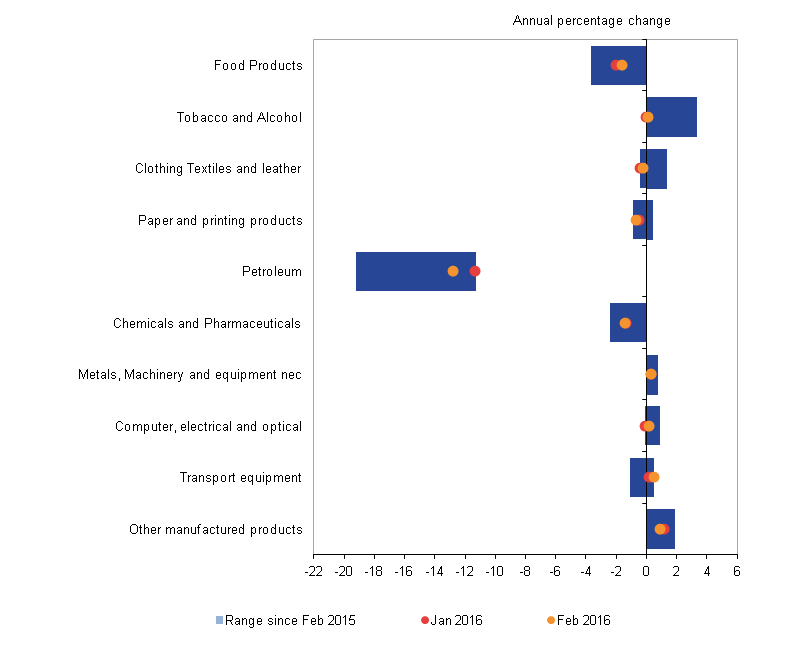
Figure E shows the year on year growth in output PPI by grouping for the latest 2 months and the range of the price changes that have been seen in these sections since February 2015. It can be seen that the majority of output PPI indices have experienced little variance in inflation in the past 12 months. Petroleum shows the biggest decrease, as well as the biggest range of movements; ranging from falls of 19.2% in February and September 2015 to 11.3% in January 2016. Alcohol and tobacco shows the biggest increase, ranging from rises of 3.3% in February 2015 to 0.0% in January 2016.
Figure E: Output PPI range of movements, February 2015 to February 2016
UK
Source: Office for National Statistics
Notes:
- nec = not elsewhere classified
Download this image Figure E: Output PPI range of movements, February 2015 to February 2016
.png (28.0 kB) .xls (28.7 kB)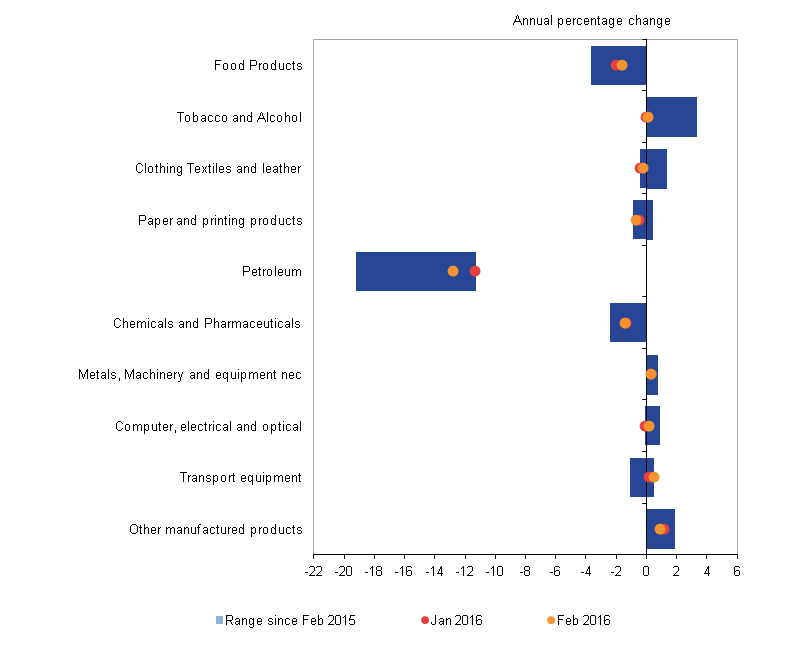
7. Input prices: summary
Figure F shows the annual movements in total input prices (including materials and fuels) and core input prices (excluding purchases from food, beverage, tobacco and petroleum industries) of materials and fuels purchased by the UK manufacturing industry. Between April 2012 and October 2013, both series showed relatively similar movements. From November 2013, both series have been showing a downward trend, with total input prices falling more rapidly. There has been a significant gap in the price movements of total input prices and core input prices since November 2014, however, this gap has been narrowing in recent months. Currently there is a difference of 4.7 percentage points, compared to a maximum of 10.9 percentage points in January 2015.
Looking at the latest data (Table D), the main movements in the year to February 2016 were as follows:
- the total input price index fell 8.1%, compared with a fall of 8.0% in the year to January 2016
- the core input price index saw a fall of 3.4%, compared with a fall of 5.1% in the year to January 2016
- the price of imported materials as a whole (including crude oil) fell 6.7%, compared with a decrease of 7.9% in the year to January 2016 (Reference table 7)
Between January and February 2016:
- the total input price index rose 0.1%, compared with a fall of 1.1% last month (Table D)
- in seasonally adjusted terms (see Table D), the input price index for the manufacturing industry excluding the food, beverage, tobacco and petroleum industries rose 0.4%, compared with an increase of 0.2% last month
Table D: Input prices
| UK, September 2015 to February 2016 | ||||||
| Percentage change | ||||||
| Materials and fuels purchased | Excluding purchases from food, beverage, tobacco and petroleum industries | |||||
| 1 month (NSA)1 | 12 months (NSA)1 | 1 month (NSA)1 | 12 months (NSA)1 | 1 month (SA)2 | ||
| 2015 | Sep | 0.5 | -13.4 | 0.8 | -5.7 | 0.7 |
| Oct | 0.0 | -12.3 | -0.7 | -6.8 | -1.3 | |
| Nov | -1.6 | -13.1 | -1.3 | -8.5 | -1.6 | |
| Dec | -0.3 | -10.4 | 1.1 | -6.6 | 1.1 | |
| 2016 | Jan | -1.1 | -8.0 | 0.3 | -5.1 | 0.2 |
| Feb | 0.1 | -8.1 | 0.5 | -3.4 | 0.4 | |
| Source: Office for National Statistics | ||||||
| Notes: | ||||||
| 1. NSA: Not Seasonally Adjusted | ||||||
| 2. SA: Seasonally Adjusted | ||||||
Download this table Table D: Input prices
.xls (25.6 kB)
Figure F: Input prices (materials and fuel) manufacturing industry
UK, February 2012 to February 2016
Source: Office for National Statistics
Download this chart Figure F: Input prices (materials and fuel) manufacturing industry
Image .csv .xlsNotes for Input prices: summary
- Input price indices include the Climate Change Levy which was introduced in April 2001.
- Input price indices include the Aggregate Levy which was introduced in April 2002.
8. Supplementary analysis: Input prices
Table E and Figure G show the percentage change in the price of the main commodities groups over the year and their contributions to the total input index.
Table E: Input prices, 12 months change, February 2016
| UK | |
| Product group | Percentage change |
| Fuel including Climate Change Levy | -7.4 |
| Crude oil | -36.3 |
| Home food materials | -6.1 |
| Imported food materials | -2.9 |
| Other home-produced materials | 0.0 |
| Imported metals | -13.6 |
| Imported chemicals | -1.9 |
| Imported parts and equipment | 2.1 |
| Other imported materials | 2.6 |
| All manufacturing | -8.1 |
| Source: Office for National Statistics | |
Download this table Table E: Input prices, 12 months change, February 2016
.xls (27.1 kB)
Figure G: Input prices, contribution to 12 months growth rate, February 2016
UK
Source: Office for National Statistics
Download this chart Figure G: Input prices, contribution to 12 months growth rate, February 2016
Image .csv .xlsTable F and Figure H show the percentage change in the price of the main commodities groups over the month and their contributions to the total input index.
Table F: Input prices, 1 month change, February 2016
| UK | |
| Product group | Percentage change |
| Fuel including Climate Change Levy | -0.4 |
| Crude oil | -1.1 |
| Home food materials | -0.3 |
| Imported food materials | -0.2 |
| Other home-produced materials | 0.0 |
| Imported metals | 1.9 |
| Imported chemicals | 0.1 |
| Imported parts and equipment | 0.8 |
| Other imported materials | 1.0 |
| All manufacturing | 0.1 |
| Source: Office for National Statistics | |
Download this table Table F: Input prices, 1 month change, February 2016
.xls (26.6 kB)
Figure H: Input prices, contribution to 1 month growth rate, February 2016
UK
Source: Office for National Statistics
Download this chart Figure H: Input prices, contribution to 1 month growth rate, February 2016
Image .csv .xls9. Input prices: detailed commentary
The overall input index for all manufacturing, which measures changes in the price of materials and fuels purchased by manufacturers, fell 8.1% in the year to February 2016, compared with a fall of 8.0% in the year to January 2016. The main downward contributions to the index came from crude oil with smaller, but notable, downward contributions from imported metals and fuel including climate change levy.
Imported metal prices fell 13.6% in the year to February 2016, compared with a fall of 18.3% in the year to January 2016; although this is still a considerable decrease it is the smallest seen in this index since July 2015. The main contribution came from imported products used in the manufacture of other basic metals and casting, which fell 14.1%. The prices of the majority of metals measured in the PPI have fallen significantly, with many metal market prices ending the year at low levels. This may have been contributed to by a reduction in growth in the Chinese economy. The PPI imported metals index is currently at levels not seen since 2006. Until recently the Chinese economy has seen strong growth resulting in high demand for metals, which may have contributed to increased prices. Reduced demand resulting from a slowdown of China’s economy may have been a factor in reducing prices, alongside uncertainty about growth prospects in a number of emerging economies.
The monthly input index rose 0.1% between January and February 2016, compared with a fall of 1.1% between December 2015 and January 2016. This increase was driven by small increases in the price of 4 of the 9 groups, slightly offset by small decreases in the price of crude oil and fuels (see Table F and Figure H).
Crude oil annual prices have been falling since October 2013. The index fell 36.3% in the year to February 2016, compared with a decrease of 30.6% in the year to January 2016. The monthly index for crude oil fell 1.1% between January and February 2016, compared with a fall of 11.9% between December 2015 and January 2016. The main contribution to both the annual and monthly indices came from imported crude petroleum and natural gas, which fell 34.2% in the year to February 2016 and 0.8% between January and February 2016.
Factors in the supply side of the market may have put downward pressure on prices. During 2015 international oil supply increased by 2.6 million barrels per day, alongside stock levels reaching record highs; according to the Joint Organisations Data Initiative (JODI). Uncertainty about the growth of emerging economies may also have contributed towards a drop in prices.
Core input price index (excluding purchases from the food, beverage, tobacco and petroleum industries)
The seasonally adjusted core input price index increased 0.4% between January and February 2016, compared with an increase of 0.2% between December 2015 and January 2016. In the year to February 2016, the index fell 3.3% compared with a fall of 5.2% in the year to January 2016.
The unadjusted index fell 3.4% in the year to February 2016, compared with a decrease of 5.1% in the year to January 2016. The monthly index increased 0.5% between January and February 2016, compared with an increase of 0.3% between December 2015 and January 2016. This increase in the monthly rate is driven by rises in other imported parts and equipment, imported metals and other imported materials.
Input producer price index contribution to change in rate
The annual percentage rate for the input PPI in February 2016 fell 8.1%, compared with a decrease of 8.0% last month, resulting in a fall in the annual rate of 0.1 percentage points. Most product groups saw small movements; except for crude oil which showed a significant increase. Decreases in imported metals, other imported parts and equipment, imported chemicals, other imported materials and imported food materials offset the increase in crude oil to contribute to an overall decrease in the annual rate (Figure I).
Figure I: Input 12 month contribution to change in rate between January and February 2016
UK
Source: Office for National Statistics
Notes:
- The components may not sum exactly to the overall change in the rate due to rounding.
Download this chart Figure I: Input 12 month contribution to change in rate between January and February 2016
Image .csv .xls10. Input PPI indices range of movements
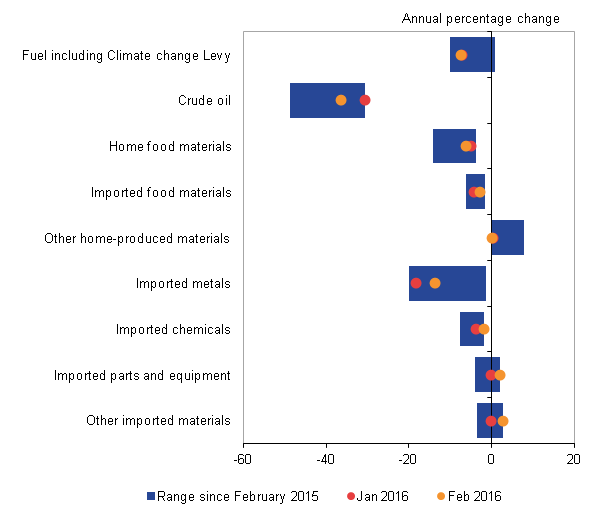
Figure J shows the year on year growth in input PPI by grouping for the latest 2 months and the range of the price changes that have been seen in these groupings since February 2015. It can be seen that the majority of input PPI indices have experienced little variance in inflation during 2015. Crude oil shows the biggest decrease, ranging from falls of 48.6% in August 2015 to 30.6% in January 2016. Other home-produced materials shows the biggest increase, ranging from rises of 7.7% in March 2015 to 0.0% in February 2016.
Imported metals has shown the largest range of price changes, ranging from -1.4% in February 2015 to -20.0% in December 2015.
Figure J: Input PPI range of movements, February 2015 to February 2016
UK
Source: Office for National Statistics
Download this image Figure J: Input PPI range of movements, February 2015 to February 2016
.png (21.5 kB) .xls (28.7 kB)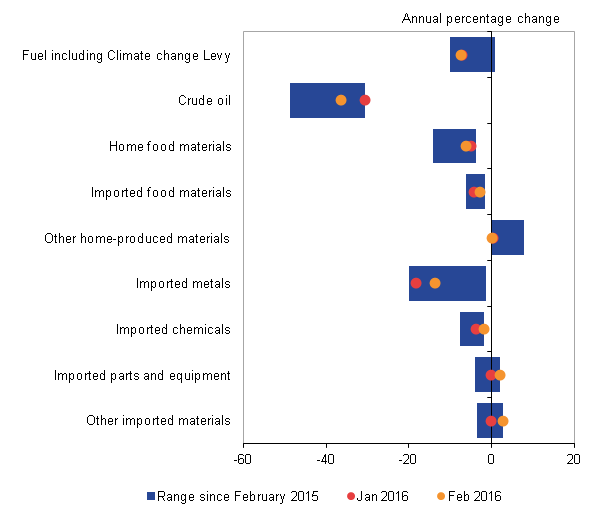
11. Economic context
Input producer prices fell 8.1% in the year to February 2016, compared with an 8.0% decrease in the year to January 2016, continuing the current trend of falling input prices. Output prices also fell in February, which would suggest that lower input costs are feeding into the price of manufacturing goods. Output producer price inflation fell slightly from a fall of 1.0% in the year to January 2016, to a fall of 1.1% in the year to February 2016.
The decline in input and output producer price inflation can partly be attributed to lower oil and petroleum prices, as the cost of crude oil, energy and refined petroleum products has continued to influence the price of manufactured goods. Since early 2014, crude oil prices have been on a downwards trajectory, falling from around $108 per barrel to around $58 per barrel in the month of February 2015, and to around $34 per barrel in February 2016. However, oil prices rose by 6.3% in
February 2016 ($34), compared with the previous month ($32), which has been partly attributed to an easing of supply by both the Organization of the Petroleum Exporting Countries (OPEC) and non-OPEC countries. As a result, oil and refined petroleum product prices accounted for 5.4 percentage points of the 8.1% fall in input producer prices in the year to February 2016 and for 0.9 percentage points of the 1.1% fall in output producer prices over the same period.
Alongside recent changes in oil prices, changes in the dollar-sterling and euro-sterling exchange rates may also have had an impact on producer prices. In trade weighted-terms, sterling has depreciated by 3.7% in the year to February 2016. All else equal, a depreciation of sterling increases the prices of UK imports, with a corresponding impact on the prices paid by producers for imports. If these producers raise their prices in turn, then movements in the exchange rate can influence input and output producer prices. Sterling depreciated by 6.8% against the US dollar in the year to February 2016, its largest fall since July 2015, while sterling also depreciated against the euro by 4.5% over the same period, marking its first depreciation against the euro since December 2013 (Figure A). This could put upward pressure on import prices paid by producers.
Figure K: Spot exchange rate between the euro and sterling, and US dollar and sterling
UK, January 2012 to February 2016
Source: Bank of England
Download this chart Figure K: Spot exchange rate between the euro and sterling, and US dollar and sterling
Image .csv .xlsWhile lower oil prices and changes in the exchange rate have had the greatest impact on producer prices, the continuing strengthening of the UK labour market may also be supporting the prices of manufacturers. Figure L shows the unemployment rate amongst those aged 16 and above remained steady at 5.1% in the three months to December 2015, while the employment rate amongst those aged 16 to 64 increased to 74.1% during the same period. Output per hour worked in manufacturing, growth in which permits firms to produce more output per unit of labour input, fell by 2.0% in the year to Quarter 3 (July to September) 2015. Despite productivity falling, total weekly earnings have been positive in recent months. Wages in the manufacturing sector grew by 1.3% in the 3 months to December 2015 when compared with the same 3 months a year earlier. This may have partially offset the lower cost pressures from oil prices.
Figure L: Unemployment rate aged 16 and above
UK, January 2008 to November 2015
Source: Office for National Statistics
Download this chart Figure L: Unemployment rate aged 16 and above
Image .csv .xlsWith a number of factors affecting input and output prices, the demand for goods and services in the UK economy remained strong in Quarter 4 (October to December) 2015, as GDP grew by 0.5% compared with 0.4% in Quarter 3 (July to September) 2015. However, much of this growth has been concentrated in the services sector, the output of which increased by 0.7% from the previous quarter, while manufacturing output remained flat, following a decrease of 0.4% in Quarter 3 2015.
Back to table of contents12. Revisions
For this bulletin (Producer price index dataset Tables 8R and 9R) highlight revisions to movements in price indices previously published in last month’s statistical bulletin. These are mainly caused by changes to the most recent estimates, as more price quotes are received, and revisions to seasonal adjustment factors, which are re-estimated every month.
For more information about our revisions policy, see our website.
Table G: Revisions between first publication and estimates 12 months later
| Percentage | |||
| Value in latest period | Revisions between first publication and estimates 12 months later | ||
| Average over the last 5 years | Average over the last 5 years without regard to sign (average absolute revision) | ||
| Total output (JVZ7) - 12 months | -1.1 | -0.14 | 0.20 |
| Total output (JVZ7) - 1 month | 0.1 | -0.01 | 0.08 |
| Total input (K646) - 12 months | -8.1 | 0.05 | 0.33 |
| Total input (K646) - 1 month | 0.1 | 0.06 | 0.26 |
| Source: Office for National Statistics | |||
| Notes: | |||
| 1. *Statistically significant | |||
Download this table Table G: Revisions between first publication and estimates 12 months later
.xls (25.6 kB)Revisions to data provide one indication of the reliability of main indicators. Table G shows summary information on the size and direction of the revisions which have been made to the data covering a 5-year period. A statistical test has been applied to the average revision to find out if it is statistically significantly different from zero. An asterisk (*) shows that the test is significant.
Table G presents a summary of the differences between the first estimates published between 2011 and 2015 and the estimates published 12 months later. These numbers include the effect of the reclassification onto Standard Industrial Classification (SIC) 2007.
Spreadsheets giving revisions triangles of estimates for all months from February 1998 through to December 2015 and the calculations behind the averages in the table are available in the producer price inflation datasets:
Revision triangle for total output (12 months)
Revision triangle for total output (1 month)
Revision triangle for total input (12 months)
Revision triangle for total input (1 month)
Back to table of contents