Table of contents
- Main points
- About this release
- Changes to the Quarterly Survey of Capital Expenditure and methodological information
- Gross fixed capital formation and business investment
- Summary tables
- Economic background
- Where to find more of our data
- Adjustments, revisions and response rates
- Background notes
- Methodology
1. Main points
Gross fixed capital formation (GFCF) in volume terms was estimated to have fallen by 1.1% to £76.6 billion between Quarter 3 (July to Sept) 2015 and Quarter 4 (Oct to Dec) 2015.
Between Quarter 3 2015 and Quarter 4 2015, business investment in volume terms was estimated to have decreased by 2.0 % to £43.3 billion.
Between Quarter 4 2014 and Quarter 4 2015, GFCF was estimated to have increased by 2.1% from £75.0 billion to £76.6 billion.
Business investment was estimated to have risen by 3.0% between Quarter 4 2014 and Quarter 4 2015, increasing from £42.1 billion to £43.3 billion.
Business investment increased by 5.2% between 2014 and 2015, having increased by £8.7 billion to £174.5 billion.
The earliest period being revised in this release is Quarter 1 (Jan to Mar) 2015.
Back to table of contents2. About this release
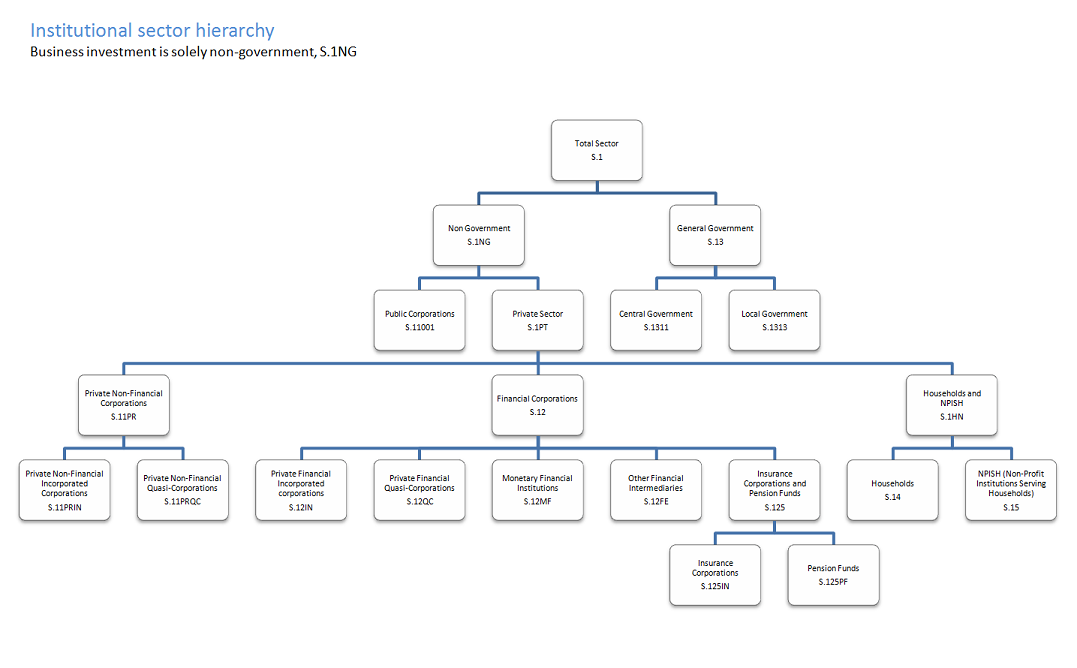
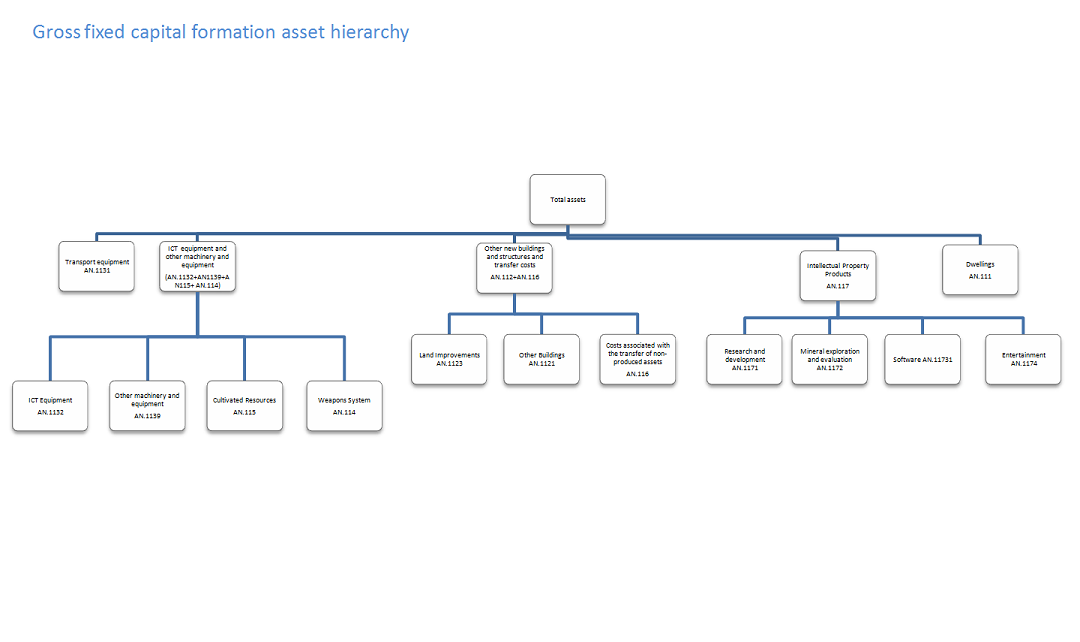
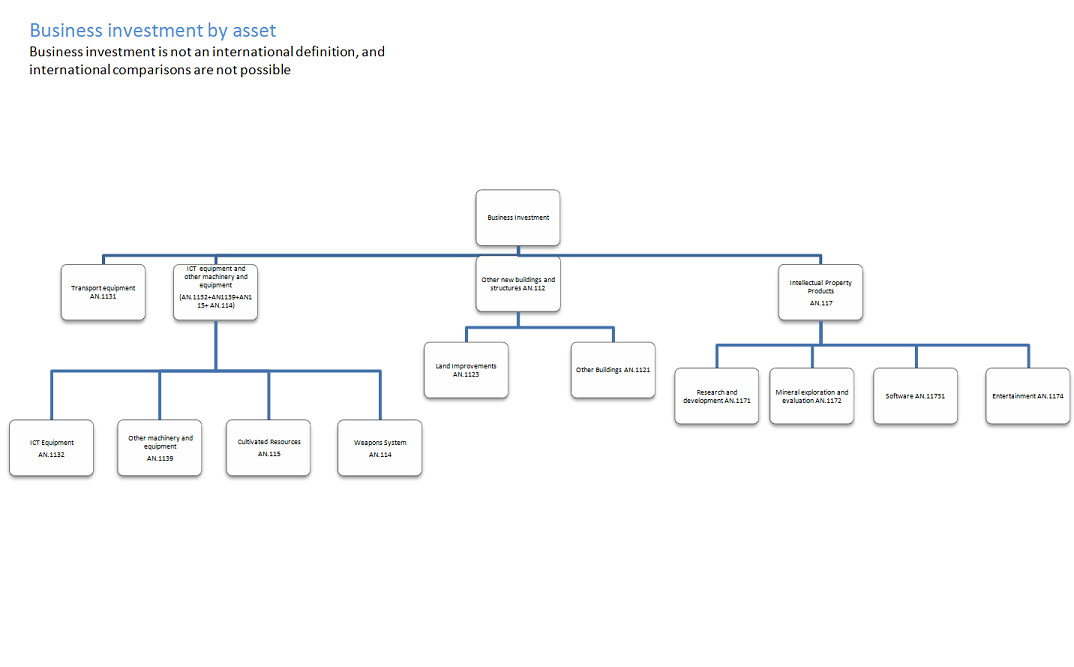
The estimates in this release are short-term indicators of investment in non-financial assets in the UK, such as dwellings, transport equipment, machinery, buildings and intellectual property products. This release covers not only business investment, but asset and sector breakdowns of total gross fixed capital formation (GFCF), of which business investment is one component.
Business investment is net investment by private and public corporations. These include investments in:
- transport
- information, technology and communications (ICT) equipment
- other machinery and equipment
- cultivated assets
- intellectual property products (IPP, which includes investment in software, research and development, artistic originals and mineral exploration)
- buildings and other structures
It does not include investment by central or local government, investment in dwellings or the costs associated with the transfer of non-produced assets (such as land). A full sector and asset hierarchy can be found in the background notes. Note that business investment is not an internationally recognised concept and therefore it should not be used to make international comparisons.
All investment data referred to in this bulletin are estimates of seasonally adjusted chained volume measures.
Back to table of contents3. Changes to the Quarterly Survey of Capital Expenditure and methodological information
Changes to the Quarterly Survey of Capital Expenditure in Quarter 1 (Jan to Mar) 2015
As described in the Business Investment, Quarter 4 (Oct to Dec) 2014 Revised Results bulletin and in Changes to the Annual Business Survey, the Quarterly Survey of Capital Expenditure and the Survey into Business Spending on Capital Items, in 2015 (published 22 August 2014), we moved to the Quarterly Acquisitions and Disposals of Capital Assets Survey (QCAS) from the Quarterly Survey of Capital Expenditure (CAPEX). The main reason was to move to the updated European System of Accounts (ESA) 2010 manual, the international guidance for national accounts.
The main changes to the survey are:
- adding new questions to improve the quality of our estimates and to meet the latest European legislation requirements (ESA 2010)
- removing the lower limit of £500 for the value of reported assets, so all relevant assets (even those below businesses’ Asset Register threshold) can be reported
- including small tools used in production in the definition of GFCF
- improving the questionnaire’s layout, including new sections and headings, to make completing the questionnaire easier
The data from the new questions will not be included in estimates of GFCF and its components until 2017, when there will be 2 years of data available for quality assurance.
Back to table of contents4. Gross fixed capital formation and business investment
Figure 1: Annual gross fixed capital formation chained volume measures , UK
Reference year: 2012
Source: Office for National Statistics
Notes:
- The data in this chart covers 1997 to 2015.
Download this chart Figure 1: Annual gross fixed capital formation chained volume measures , UK
Image .csv .xls
Figure 2: Quarterly gross fixed capital formation chained volume measures, seasonally adjusted, Quarter 4 1997 to Quarter 4 2015, UK
Reference year: 2012
Source: Office for National Statistics
Notes:
- Q1 refers to Quarter 1 (January to March), Q2 refers to Quarter 2 (April to June), Q3 refers to Quarter 3 (July to September), Q4 refers to Quarter 4 (October to December).
- The data in this chart covers Quarter 4 (October to December) 1997 to Quarter 4 (October to December) 2015.
Download this chart Figure 2: Quarterly gross fixed capital formation chained volume measures, seasonally adjusted, Quarter 4 1997 to Quarter 4 2015, UK
Image .csv .xls
Figure 3: Annual business investment chained volume measures, financial years 1997 to 2015, UK.
Reference year: 2012
Source: Office for National Statistics
Download this chart Figure 3: Annual business investment chained volume measures, financial years 1997 to 2015, UK.
Image .csv .xls
Figure 4: Quarterly business investment chained volume measures, seasonally adjusted, Quarter 4 2007 to Quarter 4 2015, UK
Reference year: 2012
Source: Office for National Statistics
Notes:
- Q1 refers to Quarter 1 (January to March), Q2 refers to Quarter 2 (April to June), Q3 refers to Quarter 3 (July to September), Q4 refers to Quarter 4 (October to December).
Download this chart Figure 4: Quarterly business investment chained volume measures, seasonally adjusted, Quarter 4 2007 to Quarter 4 2015, UK
Image .csv .xlsBusiness investment in Quarter 4 (Oct to Dec) 2015 fell by 2.0% to £43.3 billion when compared with Quarter 3 (July to Sept) 2015 (Figure 4). This fall follows consecutive periods of growth of 2.9% in Quarter 1 (Jan to Mar) 2015, 0.7% in Quarter 2 (Apr to June) 2015 and 1.3% in Quarter 3 (July to Sept) 2015 and takes business investment back to the level recorded in Quarter 1 (Jan to Mar) 2015. The fall in Quarter 4 (Oct to Dec) 2015 is the first since Quarter 4 (Oct to Dec) 2014 when business investment fell by 0.1%. The fall in business investment in the latest quarter was driven by a larger volume of asset disposals compared with previous quarters, particularly in transport.
Between Quarter 4 (Oct to Dec) 2014 and Quarter 4 (Oct to Dec) 2015, business investment increased by 3.0%. There has not been a quarter on same quarter of previous year fall in business investment since Quarter 1 (Jan to Mar) 2013, when it fell by 1.8%.
Between 2014 and 2015, business investment increased by 5.2% having increased by 4.7% between 2013 and 2014.
Back to table of contents5. Summary tables
Table 1a shows that in Quarter 4 (Oct to Dec) 2015, gross fixed capital formation decreased by an estimated 1.1% to £76.6 billion, compared with Quarter 3 (July to Sept) 2015. Business investment and general government contributed most to the fall from Quarter 3 (July to Sept) 2015. The decreases were partially offset by increases in private sector cost of ownership transfer on non-produced assets and private sector dwellings.
Between Quarter 4 2014 and Quarter 4 2015, general government was the only sector to have decreased, having fallen by 5.2%, the largest fall since Quarter 2 2013 when general government decreased by 9.6%.
Table 1a: Total gross fixed capital formation in the UK by institutional sector, Quarter 4 (Oct to Dec) 2015
| % change | % change | £ million | £ million | £ million | |
| Most recent quarter on previous quarter | Most recent quarter on same quarter a year earlier | Most recent level1 | Level change from previous quarter | Level change on same quarter a year earlier | |
| Gross fixed capital formation | -1.1 | 2.1 | 76,559 | -859 | 1,577 |
| Business investment | -2.0 | 3.0 | 43,343 | -864 | 1,247 |
| General government | -3.5 | -5.2 | 11,249 | -402 | -617 |
| Public corporations dwellings | -2.3 | 7.7 | 978 | -23 | 70 |
| Public corporations cost of ownership | 1.9 | 8.6 | -165 | -3 | -13 |
| transfer on non-produced assets | |||||
| Private sector dwellings | 1.2 | 2.8 | 15,733 | 191 | 423 |
| Private sector cost of ownership | 4.7 | 9.4 | 5,421 | 242 | 467 |
| Source: Office for National Statistics | |||||
| Notes: | |||||
| 1. Series may not sum to totals due to rounding. | |||||
Download this table Table 1a: Total gross fixed capital formation in the UK by institutional sector, Quarter 4 (Oct to Dec) 2015
.xls (29.7 kB)Table 1b shows that in Quarter 4 (Oct to Dec) 2015, other buildings and structures and transfer costs saw the largest decrease in level terms, falling £0.4 billion (1.7%) to £24.2 billion from Quarter 3 (July to Sept) 2015. The largest increase in level terms in Quarter 4 (Oct to Dec) 2015 was in dwellings, which grew by £0.3 billion (1.5%) to £16.9 billion from Quarter 3 (July to Sept) 2015.
Between Quarter 4 (Oct to Dec) 2014 and Quarter 4 (Oct to Dec) 2015, transport equipment increased the most, having grown by 38.5% (£0.9 billion). This was partially offset by falls in other buildings and structures and transfer costs (£0.3 billion) and intellectual property products (£0.1 billion).
Table 1b: Total gross fixed capital formation in the UK by asset, Quarter 4 (Oct to Dec) 2015
| UK | |||||
| % change | % change | £ million | £ million | £ million | |
| Most recent quarter on previous quarter | Most recent quarter on same quarter a year earlier | Most recent level 1 | Level change from previous quarter | Level change on same quarter a year earlier | |
| Gross fixed capital formation | -1.1 | 2.1 | 76,559 | -859 | 1,577 |
| Transport equipment | -9.3 | 38.5 | 3,399 | -349 | 945 |
| ICT equipment and other machinery and equipment | -2.3 | 2.5 | 15,411 | -367 | 381 |
| Dwellings | 1.5 | 4.1 | 16,922 | 256 | 662 |
| Other buildings and structures and transfer costs | -1.7 | -1.4 | 24,234 | -424 | -342 |
| Intellectual property products | 0.2 | -0.4 | 16,593 | 25 | -69 |
| Source: Office for National Statistics | |||||
| Notes: | |||||
| 1. Series may not sum to totals due to rounding. | |||||
Download this table Table 1b: Total gross fixed capital formation in the UK by asset, Quarter 4 (Oct to Dec) 2015
.xls (28.2 kB)6. Economic background
Gross fixed capital formation (GFCF) fell in the final quarter of 2015, by 1.1% compared with the previous quarter. However, this follows a period of 10 consecutive quarters of investment growth, and the level of investment is now estimated to be 2.1% higher compared with Quarter 4 2014. This rate of ”quarter on year” growth has slowed in recent quarters. It was 8.6% in Quarter 2 (Apr to June) 2014 and has now fallen below the average rate of 3.2% achieved in the decade prior to the economic downturn - Quarter 1 (Jan to Mar) 1998 to Quarter 4 2007.
Business investment contracted by 2.0% in Quarter 4 2015 when compared with the previous quarter, a faster rate than the fall in total GFCF. This is the lowest growth rate since Quarter 1 2014, however, the level of business investment remains 4.8% above pre-downturn peak levels Quarter 1 2008. The Bank of England’s (BoE) Inflation Report highlights that a portion of this weaker performance could be attributed to a fall in investment in the oil extraction industry, which has coincided with a sharp fall in oil prices over this period.
Dwellings investment – which relates to the new construction and repair of residential homes – helped to offset partially the weakness in business investment by growing 1.5% on the quarter and by 4.1% on the same quarter of the previous year. The BoE Inflation Report cites a pickup in mortgage approvals and the continuation of low borrowing rates as factors assisting the demand side for housing, while the easing in the shortage of building materials according to the latest RICS construction market survey is assisting from a supply perspective.
Back to table of contents7. Where to find more of our data
We also publish additional analyses of GFCF, business investment, and the Quarterly
Acquisitions and Disposals of Capital Assets Survey, which have been created in response to user requests. These are available to download free from our website. Enquiries about user-requested data may be made to gcf@ons.gov.uk.
Back to table of contents8. Adjustments, revisions and response rates
Adjustments
Large capital expenditure tends to be reported later in the data collection period than smaller expenditure. This means that larger expenditures are often included in the revised (month 3) results, but are not reported in time for the provisional (month 2) results, leading to a tendency towards upwards revisions in the later estimates for business investment and gross fixed capital formation (GFCF). Following investigation of the impact of this effect, from Quarter 3 (July to Sept) 2013, a bias adjustment was introduced to GFCF and its components in the provisional estimate. A bias adjustment of £0.4 billion was included in the revised (month 3) release for Quarter 4 (Oct to Dec) 2015, revised down from the provisional (month 2) release when the bias adjustment was £1.2 billion. This adjustment will be reassessed in line with previous revisions and will be updated when Quarter 4 (Oct to Dec) 2015 is next open for revision.
The Quarterly Survey of Capital Expenditure was improved by adding clearer instructions. As detailed in the provisional Quarter 1 (Jan to Mar) 2015 Business Investment release, feedback from some respondents indicated that they had been misreporting their asset breakdown and were correcting this on the new questionnaire. We found that some respondents were reporting new construction work (NCW) as other capital equipment (OCE). From Quarter 1 (Jan to Mar) 2015 respondents to the survey are now reporting more in new construction work at the expense of other capital equipment. To remain consistent with the previous data, we have made some adjustments to the assets in the current price series in Quarter 1 (Jan to Mar), Quarter 2 (Apr to June), Quarter 3 (July to Sept) and Quarter 4 (Oct to Dec) 2015. These adjustments are given in table 2.
Table 2: Adjustments made to buildings and other machinery to account for improved survey information, Quarter 1 2015 (Jan to Mar) to Quarter 4 2015 (Oct to Dec)
| UK | ||||
| Period | Adjustment to buildings (£ billion) | Adjustment to machinery (£ billion) | Revisions to buildings adjustment since Q4 2015 provisional (£ million) | Revisions to machinery adjustment since Q4 2015 provisional (£ million) |
| Q1 2015 | -1.5 | 1.5 | 0 | 0 |
| Q2 2015 | -2.1 | 2.1 | 0 | 0 |
| Q3 2015 | -1.9 | 1.9 | 0 | 0 |
| Q4 2015 | -1.9 | 1.9 | 0.7 | -0.7 |
| Source: Office for National Statistics | ||||
| Notes: | ||||
| 1. Q1 refers to Quarter 1 (Jan to Mar) | ||||
| 2. Q2 refers to Quarter 2 (Apr to June) | ||||
| 3. Q3 refers to Quarter 3 (July to Sept) | ||||
| 4. Q4 refers to Quarter 4 (Oct to Dec) | ||||
Download this table Table 2: Adjustments made to buildings and other machinery to account for improved survey information, Quarter 1 2015 (Jan to Mar) to Quarter 4 2015 (Oct to Dec)
.xls (28.2 kB)Revisions
Data in this release have been revised from Quarter 1 (Jan to Mar) 2015 to Quarter 4 (Oct to Dec) 2015 in line with National Accounts revisions policy.
The main drivers of revisions to GFCF since the Quarter 4 (Oct to Dec) 2015 provisional release are revisions to general government data and data relating to dwellings.
Business investment revisions are primarily caused by the improved Quarterly Acquisitions and Disposals of Capital Assets Survey (QCAS) response rate, as can be seen in table 3. The larger percentage of returns at revised mean that we have an improved picture of investment in the economy.
Revisions can be found at the end of the G1 – G16 tables which accompany this release.
Survey response rates
Table 3 presents the revised (month 3, third estimate of GDP) response rates for the Quarterly Acquisitions and Disposals of Capital Assets Survey (QCAS). The estimates in this release are based on the Quarter 4 (Oct to Dec) 2015 month 3 (revised) survey results.
Table 3: UK response rates for quarterly acquisitions and disposals of capital assets survey, Quarter 4 2014 (Oct to Dec) to Quarter 4 2015 (Oct to Dec)
| UK | ||||||
| At month 2 (Provisional) | At month 3 (Revised) | |||||
| Period | Survey response rates / % | Period | Survey response rates / % | |||
| 2014 | Q4 | 80.1 | 2014 | Q4 | 94.4 | |
| 2015 | Q1 | 67.3 | 2015 | Q1 | 88.8 | |
| Q2 | 70.8 | Q2 | 88.5 | |||
| Q3 | 72.1 | Q3 | 88.4 | |||
| Q4 | 68.6 | Q4 | 84.6 | |||
| Source: Office for National Statistics | ||||||
| Notes: | ||||||
| 1. Q1 refers to Quarter 1 (Jan to Mar) | ||||||
| 2. Q2 refers to Quarter 2 (Apr to June) | ||||||
| 3. Q3 refers to Quarter 3 (July to Sept) | ||||||
| 4. Q4 refers to Quarter 4 (Oct to Dec) | ||||||

