Table of contents
- Main points
- Statistician’s quote
- Things you need to know
- SET expenditure 2014
- SET expenditure by sectors of the UK government
- Decrease in Research Councils' expenditure on SET
- Civil departments' expenditure on SET increases
- Increase in Higher Education Funding Councils' (HEFCs) expenditure on SET
- Defence expenditure on R&D increases but down on 2003 peak
- Indicative UK contributions to EU R&D expenditure
- Your views matter
- Main issues specific to this bulletin
- Quality and methodology
1. Main points
In 2014, the UK government spent £11.0 billion on science, engineering and technology (SET), an increase of 0.4% in current prices compared with 2013. Allowing for inflation (in constant prices), this was a 1.0% decrease compared with 2013.
The UK Research Councils contributed the most to expenditure on SET in 2014 at £3.4 billion, 31% of all expenditure on SET. This total was a decrease of 3% in current prices compared with 2013.
Between 2003 and 2014, defence expenditure on SET decreased by £1.1 billion in constant prices to £1.7 billion. Over the same period there was an increase in Research Councils' expenditure on SET of £0.5 billion.
The 2014 SET estimate of £11.0 billion consists of expenditure on research and development (R&D) of £10.1 billion, indicative UK contributions to EU R&D expenditure of £0.6 billion and the amount spent on knowledge transfer at £0.3 billion.
Back to table of contents2. Statistician’s quote
"Total UK government expenditure on science, engineering and technology was £11.0 billion in 2014 – that's up 0.4% from 2013. However, the defence component increased by 12% between 2013 and 2014 to £1.7 billion.”
Kate Davies, Surveys and Economic Indicators Division, Office for National Statistics
Back to table of contents3. Things you need to know
Science, engineering and technology (SET) expenditure by the UK government covers expenditure by government departments, Research Councils and Higher Education Funding Councils (HEFCs). It also includes indicative UK contributions to the EU’s research and development (R&D) expenditure. This should not be confused with the UK Gross domestic expenditure on R&D: 2014 (GERD) statistical bulletin published on 18 March 2016, which only includes expenditure on R&D performed “in-house”, that is, by organisations themselves, by all sectors of the economy. This is explained in more detail in Section 13 (Quality and methodology).
SET statistics consist of:
- UK government expenditure on R&D plus knowledge transfer (commonly known as SET): Tables 1 and 2 in the dataset
- knowledge transfer activities (including technology transfers) that are associated with research and experimental development, and contribute to the dissemination and application of scientific and technical knowledge: separately identified in Tables 5 and 6
- expenditure on R&D (excluding knowledge transfer): Tables 3 and 4
- indicative UK contributions to the EU's R&D expenditure: included in Tables 1 to 4
Estimates of R&D include in-house R&D, purchased R&D or funding provided for R&D, less funding received for R&D, and are therefore on a net expenditure basis. Table 15 shows the breakdown of net expenditure on R&D in the government sector.
There are 2 types of estimates in this release: current and constant prices. Estimates in current prices present the value of expenditure in cash terms. Constant price estimates (available from 2003 in this bulletin) have been adjusted for inflation between years using the gross domestic product (GDP) deflator. This allows changes in government expenditure on SET to be examined on a comparable basis over time.
This SET release also includes data tables on qualified scientists and engineers in the labour force by sex (Tables 16 and 17).
In this statistical bulletin, R&D and related concepts follow internationally agreed standards defined by the Organisation for Economic Cooperation and Development (OECD), as published in the Frascati Manual (2002). This manual defines R&D as “creative work undertaken on a systematic basis in order to increase the stock of knowledge, including knowledge of man, culture and society and the use of this stock of knowledge to devise new applications”.
The Frascati Manual was originally written by, and for, the experts in OECD member countries that collect and issue national estimates of R&D. The definitions provided in this manual are internationally accepted and serve as a common language for designing and evaluating science and technology policy.
The estimates in this bulletin and associated data tables relate to financial years. The main source of estimates for this publication is the annual Government Research and Development survey (GovERD).
Notes
Please note an updated Frascati Manual (2015) was introduced in October 2015, which improved the definitions and explanations of R&D.
The GDP measure used is non-seasonally adjusted money GDP from 1955-56 to 2014-15 (1955 to 2014) consistent with UK Economic Accounts Quarter 3 (July to Sept) 2015 published on 23 December 2015.
4. SET expenditure 2014
In 2014, £11.0 billion was spent on SET by the UK government, an increase of 0.4% in current prices compared with 2013. In constant prices, SET expenditure decreased by 1% compared with 2013. This value was 2% below the £11.2 billion seen in 2003 (Figure 1).
Figure 1: UK government expenditure on SET, 2003 to 2014
Source: Office for National Statistics
Download this chart Figure 1: UK government expenditure on SET, 2003 to 2014
Image .csv .xlsFigure 2 shows UK government expenditure on SET as a percentage of GDP. Total expenditure on SET in 2014 represented 0.6% of GDP. This estimate has seen a downward trend in recent years.
Figure 2: UK government expenditure on SET as a percentage of GDP, 2003 to 2014
Source: Office for National Statistics
Download this chart Figure 2: UK government expenditure on SET as a percentage of GDP, 2003 to 2014
Image .csv .xls5. SET expenditure by sectors of the UK government
The UK government’s expenditure on SET can be categorised into expenditure by Research Councils, Higher Education Funding Councils (HEFCs), and by civil and defence departments, all of which include elements of knowledge transfer. The indicative UK contributions to EU R&D expenditure provided by HM Treasury are also included in SET expenditure. Figure 3 shows the contribution each of these made to the 2014 total SET estimate. Almost a third (31%) of UK government expenditure on SET was by Research Councils, with civil departments and HEFCs contributing 26% and 22% respectively. The remainder of the SET estimate consisted of defence expenditure (16%) and contributions to EU R&D expenditure (6%).
Figure 3: The components of UK government expenditure on SET, 2014

Source: Office for National Statistics
Notes:
- Percentages sum to 101 due to rounding.
Download this image Figure 3: The components of UK government expenditure on SET, 2014
.png (24.6 kB) .xls (27.1 kB)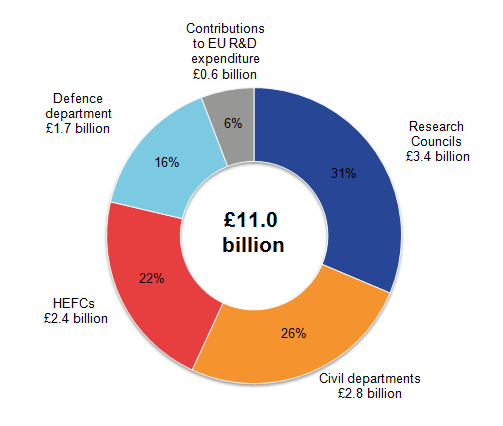
Figure 4 shows changes in SET components between 2003 and 2014 in constant prices. Defence expenditure decreased by £1.1 billion (39%), from £2.8 billion in 2003 to £1.7 billion in 2014. Over the same period there was an increase in Research Councils' expenditure on SET of £0.5 billion.
The defence estimate of £2.8 billion for 2003 was arrived at during a time of change for the Ministry of Defence (MoD), with changing internal structures and the introduction of new accounting systems, as well as a review to ensure that Frascati Manual definitions were being adhered to. Caution is therefore advised when using the SET defence estimate for this period, as it is likely to be overestimated. More information on defence statistics can be found in Note 2 of Section 13 (Quality and methodology).
Figure 4: The components of UK government expenditure on SET in constant prices, 2003 to 2014
Source: Office for National Statistics
Download this chart Figure 4: The components of UK government expenditure on SET in constant prices, 2003 to 2014
Image .csv .xls6. Decrease in Research Councils' expenditure on SET
Research Councils UK (RCUK) is the strategic partnership of the UK's 7 Research Councils. Each year the Research Councils perform research covering the full spectrum of academic disciplines, from the medical and biological sciences to astronomy, physics, chemistry, engineering, social sciences, economics, environmental sciences and the arts and humanities.
In 2014, expenditure on SET by Research Councils was £3.4 billion, a decrease of £0.1 billion (3%) in current prices compared with 2013. Allowing for inflation (in constant prices), this was a decrease of £0.1 billion (4%) compared with 2013.
The research council with the highest expenditure on SET (£0.9 billion in 2014) continued to be the Engineering and Physical Sciences Research Council (EPSRC), representing 26% of Research Councils' SET expenditure. However, this saw a drop of 8% in current prices.
The Research Councils’ estimated expenditure on SET includes their pension arrangements. These pension contributions are included separately on the datasets associated with this publication (Figure 5).
Figure 5: Breakdown of UK Research Councils' expenditure on SET, 2014

Source: Office for National Statistics
Notes:
- Percentages sum to 99 due to rounding.
- EPSRC = Engineering and Physical Sciences Research Council;
MRC = Medical Research Council;
BBSRC = Biotechnology and Biological Sciences Research Council;
STFC = Science and Technology Facilities Council;
NERC = Natural Environment Research Council;
ESRC = Economic and Social Research Council;
AHRC = Arts and Humanities Research Council
Download this image Figure 5: Breakdown of UK Research Councils' expenditure on SET, 2014
.png (26.6 kB) .xls (27.1 kB)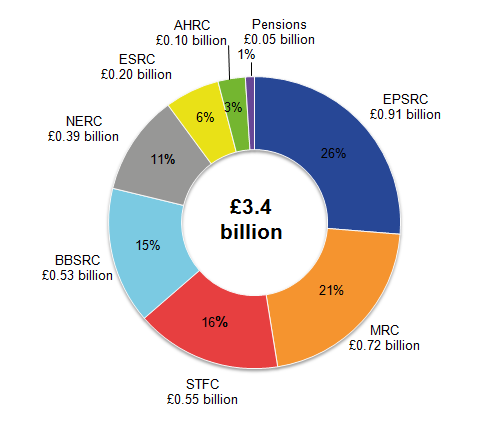
7. Civil departments' expenditure on SET increases
The UK government owns many research institutes and laboratories that carry out R&D. These are managed by various government departments. It also uses a range of different suppliers with facilities to carry out research, both inside and outside the UK.
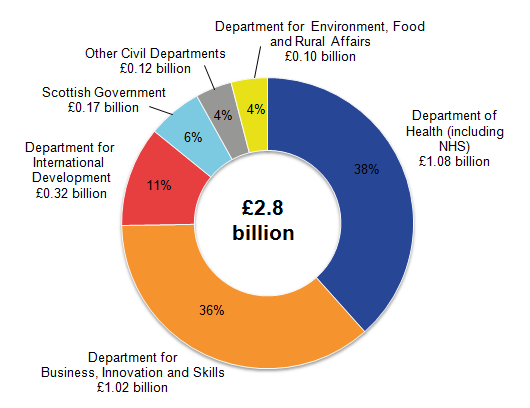
In 2014, expenditure by civil departments on SET was £2.8 billion, showing a slight increase of £14 million (0.5%) in current prices compared with 2013. In 2014, 5 departments contributed £2.7 billion (96%) to the 2014 total. The civil department with the largest expenditure on SET was the Department for Health (including the National Health Service) which represented 38% (£1.1 billion) of total civil departments’ expenditure on SET (Figure 6).
Figure 6: Breakdown of UK government civil departments' expenditure on SET, 2014
Source: Office for National Statistics
Notes:
- Percentages sum to 99 due to rounding.
Download this image Figure 6: Breakdown of UK government civil departments' expenditure on SET, 2014
.png (28.8 kB) .xls (27.1 kB)
8. Increase in Higher Education Funding Councils' (HEFCs) expenditure on SET
HEFCs promote and fund teaching and research in higher education institutions (HEIs).
All HEIs (including universities) provide finance statistics to the Higher Education Statistics Agency (HESA). Grant income provided by HEFCs is used as a proxy to estimate government-funded R&D expenditure in HEIs. More information can be found in Note 3 of Section 13 (Quality and methodology).
In 2014, expenditure on SET by HEFCs was £2.4 billion, an increase of £0.1 billion (3%) in current prices compared with 2013. Allowing for inflation (in constant prices) this was an increase of £34 million (1%) compared with 2013 and an increase of £0.2 billion (10%) since 2003. This was in contrast to the decrease from the peak of £2.7 billion in 2009 (Figure 4).
The Higher Education Funding Council for England (HEFCE) provides the most research funding as it has the highest number of HEIs. In 2014, expenditure by HEFCE on SET was £1.8 billion. This was 76% of the total HEFCs' expenditure on SET, a similar level to recent years.
Back to table of contents9. Defence expenditure on R&D increases but down on 2003 peak
In 2014, defence expenditure on SET was £1.7 billion, an increase of £0.2 billion (12%) in current prices compared with 2013. This is attributable to a 17% increase in experimental development. Allowing for inflation (in constant prices) defence expenditure also increased by £0.2 billion (11%) compared with 2013, the third consecutive increase in recent years. This was still a decrease of £1.1 billion (39%) when compared with 2003 (Figure 7).
Figure 7: Defence expenditure on SET by research and experimental development, in constant prices, 2003 to 2014
Source: Office for National Statistics
Download this chart Figure 7: Defence expenditure on SET by research and experimental development, in constant prices, 2003 to 2014
Image .csv .xls10. Indicative UK contributions to EU R&D expenditure
In 2014, the indicative contributions that the UK made to EU R&D expenditure totalled £0.6 billion. This is an increase in constant prices of £0.1 billion (25%) since 2003. These figures were provided by HM Treasury and are broad estimates. This is because member states’ contributions are not made to individual expenditure programmes, but to the EU budget as a whole. They are therefore referred to as “indicative UK contributions to EU R&D expenditure”.
Back to table of contents11. Your views matter
We aim to improve this release and its associated commentary. We welcome any feedback you have and are particularly interested to know how you make use of these estimates to inform your work. Please contact us using the details accompanying this release.
Back to table of contents12. Main issues specific to this bulletin
Please note that, when examining the datasets included in this release, there may be discrepancies between totals and the sum of their independently rounded parts. Caution should also be taken when examining departmental time series.
Back to table of contents