Table of contents
- Main points
- Overview
- Your views matter
- Interactive wheel for the UK Non-Financial Business Economy
- UK Non-Financial Business Economy, Sections A to S (part)
- Non-Financial Service Industries, Sections H to S (part)
- Production Industries, Sections B to E
- Distribution Industries, Section G
- Construction Industries, Section F
- Agriculture (part), Forestry and Fishing, Section A
- Background notes
- Methodology
1. Main points
In 2014, the approximate Gross Value Added at basic prices (aGVA) of the UK Non-Financial Business Economy was estimated to be £1,104.6 billion. This amount represents the income of UK businesses, less the cost of goods and services consumed in its creation
Between 2013 and 2014, aGVA increased by 10.3% (£103.5 billion), the largest annual percentage increase since 1997 and a continuation of the recovery seen between 2009 and 2013. This was due to an increase in turnover combined with a small decrease in purchases. The decrease in purchases was mostly seen within Wholesale
With the exception of Production, all other sectors of the UK Non-Financial Business Economy saw growth in aGVA between 2013 and 2014
The Production sector, which accounts for just under a fifth (19.7%) of aGVA in the UK Non-Financial Business Economy, saw a decrease in aGVA of 0.4% (£0.9 billion) between 2013 and 2014, due to the Mining & quarrying section
Mining & quarrying turnover decreased by a greater amount than its purchases due to the fall in oil prices during 2014. This resulted in a fall of 30.7% (£7.3 billion) in its aGVA between 2013 and 2014 and was the reason for the fall in Production sector aGVA
The Non-Financial Service sector, which accounts for over half (55.2%) of aGVA in the UK Non-Financial Business Economy, contributed most to the increase in aGVA. The sector’s increase of 10.7% (£58.9 billion) between 2013 and 2014 was the fifth consecutive annual increase. The section making the largest contribution to growth was Professional, scientific & technical activities with a 14.7% (£18.9 billion) increase
The Distribution sector, which accounts for 17.1% of aGVA in the UK Non-Financial Business Economy, saw an increase in aGVA of 24.8% (£37.5 billion) between 2013 and 2014. This took aGVA to 19.7% (£31.0 billion) above the level seen in 2008, at the start of the economic downturn, for the first time. The division making the largest contribution to growth was Wholesale
The Construction sector, which accounts for 7.8% of aGVA in the UK Non-Financial Business Economy, saw an increase in aGVA of 9.8% (£7.7 billion) between 2013 and 2014. This is the fourth consecutive year of growth, taking the sector above the level seen in 2008 for the first time, by 1.8% (£1.5 billion)
2. Overview
Estimates of the size and growth of the UK Non-Financial Business Economy for 2014 as measured by the Annual Business Survey (ABS), are presented in this release. It is the main resource for understanding the detailed structure, conduct and performance of businesses across the UK. The release covers the following sectors:
Non-Financial Services (includes professional, scientific, communication, administrative, transport, accommodation and food, private health and education, entertainment services)
Distribution (includes retail, wholesale and motor trades)
Production (includes manufacturing, oil and gas extraction, energy generation and supply, water and waste management)
Construction (includes civil engineering, house building, property development and specialised construction trades such as plumbers, electricians and plasterers)
part of Agriculture (includes agricultural support services and hunting), forestry and fishing
Together these industries represent the UK Non-Financial Business Economy and account for around two-thirds of the whole economy of the UK in terms of Gross Value Added. Public administration and defence, public sector health and education, finance, farming and households make up the rest of the whole UK economy and are not covered by this release.
Estimates published in this release include turnover, purchases, approximate Gross Value Added at basic prices (aGVA) and employment costs. All data are reported at current prices (effect of price changes not removed).
Where the economic downturn is mentioned it refers to the contraction of Gross Domestic Product (GDP) that started in 2008, the year from which consistent ABS time series data are available. For more information about the ABS survey see the background notes.
The ABS has a wide range of uses: for example, ABS statistics are essential contributors to the UK National Accounts (174.2 Kb Pdf), including the measurement of GDP, they are supplied to Eurostat to meet the requirements of the European Structural Business Statistics (SBS) Regulation, and are used by the devolved administrations and central and local government to monitor and inform policy development.
The ABS also recently published its Exporters and Importers, Great Britain, 2014 and Business Ownership in the UK, 2013 releases and contributed to an adhoc release The Economic Performance of the UK’s Motor Vehicle Manufacturing Industry, Car Production. For other uses see background note 4.
Questions often asked of the ABS release are “‘What is aGVA?” and “How does the measure of aGVA differ from the GVA measure in the National Accounts?”. For an overview of aGVA please see our infographic “What is aGVA?”. National Accounts carry out coverage adjustments, conceptual adjustments and coherence adjustments. The National Accounts estimate of GVA uses input from a number of sources, and covers the whole UK economy, whereas ABS does not include farming, financial or public sectors and households. ABS total aGVA is around two-thirds of the National Accounts whole economy GVA because of these differences. For further information on aGVA, see background note 9. There is also the article “A Comparison between ABS and National Accounts Measures of Value Added (462.3 Kb Pdf)” which provides more detail.
We make every effort to provide informative commentary on the data in this release. Where possible, the commentary draws on evidence from businesses or other sources of information to help explain possible reasons behind the observed changes. However, in some places it can prove difficult to elicit detailed reasons for movements, for example, businesses may state a “change in the nature of business activity”. Consequently, it is not possible for all data movements to be fully explained.
Back to table of contents3. Your views matter
We constantly aim to improve this release and its associated commentary. We would welcome any feedback you might have, and would be particularly interested in knowing how you make use of these data to inform your work. Please contact us via email: abs@ons.gov.uk or telephone Jon Gough on +44 (0)1633 456720.
Back to table of contents4. Interactive wheel for the UK Non-Financial Business Economy
Use the Interactive wheel updated with the latest figures for 2014 to investigate which sectors contribute most to the UK Non-Financial Business Economy. Focus on the Business Economy as a whole or each sector and switch between aGVA, Turnover and Purchases. A non-functional screenshot of the wheel follows for illustration.
UK Non-Financial Business Economy
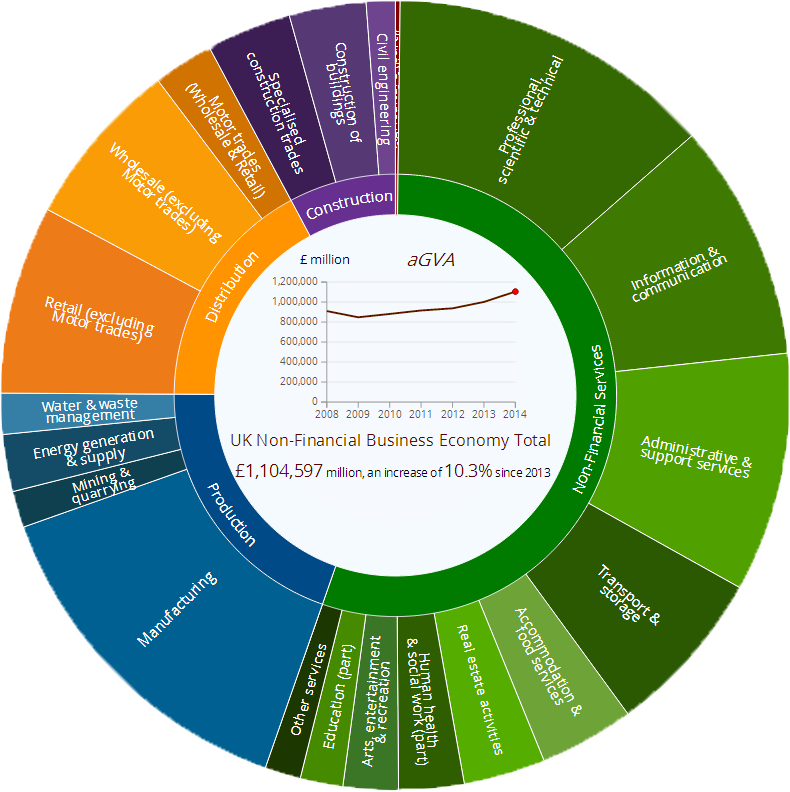
Download this image UK Non-Financial Business Economy
.png (180.5 kB)
5. UK Non-Financial Business Economy, Sections A to S (part)
In 2014, the income generated by businesses in the UK, less the cost of goods and services used to create this income was estimated to be £1,104.6 billion. This amount represents the approximate Gross Value Added at basic prices (aGVA) of the UK Non-Financial Business Economy. Between 2013 and 2014, aGVA increased by 10.3% (£103.5 billion), the largest annual percentage growth since 1997. This increase is a continuation of the recovery seen between 2009 and 2013 and takes aGVA to a level 21.4% (£194.9 billion) above that seen in 2008, at the start of the economic downturn.
The main components of aGVA are:
turnover (the main component of income)
purchases (the main component of the consumed goods and services)
The consecutive annual increases seen in aGVA follow a similar pattern of increases in both turnover and purchases. Turnover increased by 2.2% (£77.7 billion) between 2013 and 2014, while purchases of goods, materials and services decreased by 0.6% (£14.8 billion), resulting in a 10.3% growth in aGVA. As with aGVA, turnover and purchases were above levels seen in 2008 at the start of the economic downturn for the fourth consecutive year (see Figure 1).
The economic downturn and recovery described by the ABS between 2008 and 2014 is broadly in line with Gross Domestic Product (GDP) figures published in the National Accounts. Both the ABS aGVA estimates and the latest National Accounts GDP estimates (taken from the Quarterly National Accounts, Quarter 2 (Apr to June) 2015) show a fall between 2008 and 2009 and now 5 consecutive annual increases from 2009 to 2014 led by the Service sector.
A list of industries which are included in the ABS measure of the UK Non-Financial Business Economy can be found in background note 9.
Figure 1: UK Non-Financial Business Economy, turnover and purchases and resulting aGVA, 2008 to 2014
Source: Annual Business Survey (ABS) - Office for National Statistics
Notes:
- A list of industries which are included in the ABS measure of the UK Non-Financial Business Economy, can be found in background note 9
Download this chart Figure 1: UK Non-Financial Business Economy, turnover and purchases and resulting aGVA, 2008 to 2014
Image .csv .xlsWith the exception of Production all other sectors of the UK Non-Financial Business Economy, as measured by the Annual Business Survey (ABS), saw growth in aGVA between 2013 and 2014 (see Figures 2 and 3).
Non-Financial Services, the largest industry sector of the UK Non-Financial Business Economy contributed most to the increase in aGVA. The Non-Financial Service sector aGVA rose by 10.7% (£58.9 billion) between 2013 and 2014, the fifth consecutive annual increase, taking aGVA to £609.2 billion.
The Production sector saw a decrease of 0.4% (£0.9 billion) in aGVA following a slight rise between 2012 and 2013. This decrease sees aGVA for the Production sector at £218.1 billion, just below the £222.5 billion seen in 2008, at the start of the economic downturn.
The Distribution sector aGVA rose by 24.8% (£37.5 billion) between 2013 and 2014. This increase took aGVA to £188.8 billion, which is above the level of £157.8 billion seen in 2008 for the first time.
The Construction sector experienced growth in aGVA for the fourth consecutive year, increasing by 9.8% (£7.7 billion) to £86.3 billion in 2014, which, like the Distribution sector is now above the level of £84.8 billion seen in 2008 for the first time.
The Agriculture (part), Forestry & Fishing sector experienced the largest percentage rise in aGVA of all the sectors, with a 15.7% (£0.3 billion) increase between 2013 and 2014. This second consecutive annual increase takes aGVA to £2.1 billion.
Figure 2: UK Non-Financial Business Economy, aGVA by sector, 2008 to 2014

Source: Annual Business Survey (ABS) - Office for National Statistics
Notes:
- Excludes Financial and insurance; Public administration and defence; Public provision of Education; Public provision of Health and all medical and dental practice activities
- Excludes crop and animal production
- Includes Mining & quarrying, Energy generation & supply, Water & waste management
Download this image Figure 2: UK Non-Financial Business Economy, aGVA by sector, 2008 to 2014
.png (118.6 kB) .xls (35.3 kB)
Figure 3: UK Non-Financial Business Economy, aGVA change by sector, 2008 to 2014
Source: Annual Business Survey (ABS) - Office for National Statistics
Notes:
- Excludes Financial and insurance; Public administration and defence; Public provision of Education; Public provision of Health and all medical and dental practice activities
- Excludes crop and animal production
- Includes Mining & quarrying, Energy generation & supply, Water & waste management
Download this chart Figure 3: UK Non-Financial Business Economy, aGVA change by sector, 2008 to 2014
Image .csv .xlsNon-Financial Services as a whole (Sections H to S) dominates the UK Non-Financial Business Economy in terms of aGVA. However, at the Standard Industrial Classification (SIC) section level, Distribution (Section G) and Manufacturing (Section C within the Production sector) are the largest specific contributors followed by Professional, scientific & technical (Section M within the Non-Financial Services sector). Construction (Section F) also contributes more to aGVA than 7 of the 10 sections within Non-Financial Services (see Figure 4).
Figure 4: UK Non-Financial Business Economy, aGVA by section, 2014
Source: Annual Business Survey (ABS) - Office for National Statistics
Notes:
- Excludes Financial and insurance; Public administration and defence; Public provision of Education; Public provision of Health and all medical and dental practice activities
- Excludes crop and animal production
- Includes oil and gas extraction
Download this chart Figure 4: UK Non-Financial Business Economy, aGVA by section, 2014
Image .csv .xlsWhen analysing those sections which have made the largest contributions to aGVA growth between 2013 and 2014 (see Figure 5), Distribution (Section G) is the largest, contributing 36.3% of the total aGVA growth. This is followed by 2 sections in the Non-Financial Service sector with a combined contribution of 30.1%:
professional, scientific & technical (Section M)
administrative & support services (Section N)
Only Mining & quarrying (Section B) in the Production sector is showing a fall in aGVA for 2014, decreasing by 30.7% (£7.3 billion) compared with 2013.
Figure 5: UK Non-Financial Business Economy, aGVA change by section, 2013 to 2014
Source: Annual Business Survey (ABS) - Office for National Statistics
Notes:
- Excludes Financial and insurance; Public administration and defence; Public provision of Education; Public provision of Health and all medical and dental practice activities
- Excludes crop and animal production
- Includes oil and gas extraction
Download this chart Figure 5: UK Non-Financial Business Economy, aGVA change by section, 2013 to 2014
Image .csv .xlsFurther details on these industry sections can be found in the subsequent chapters which describe the Non-Financial Services sector (Sections H to S), the Production sector (Sections B to E including Manufacturing), the Distribution sector (Section G), the Construction sector (Section F) and the Agriculture (part), Forestry & Fishing sector (Section A).
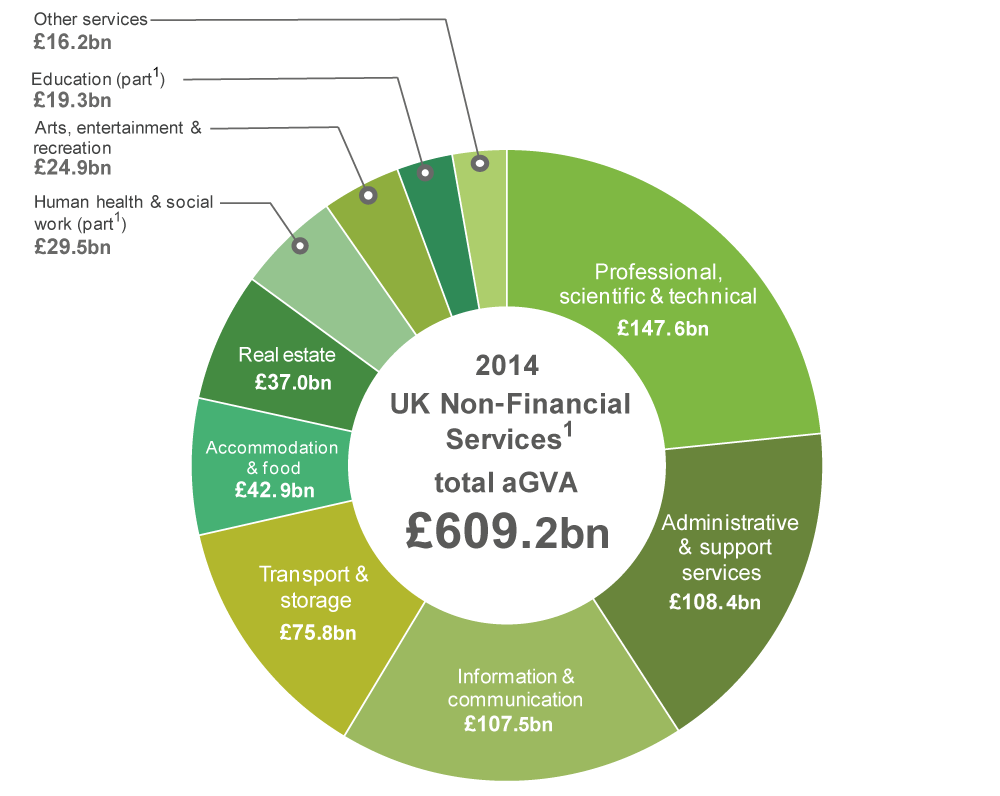
Back to table of contents6. Non-Financial Service Industries, Sections H to S (part)
The Non-Financial Service sector contributed £609.2 billion, over a half (55.2%) of the estimated aGVA total of £1,104.6 billion in 2014 for the UK Non-Financial Business Economy.
Between 2013 and 2014, Non-Financial Service's turnover increased at a higher rate than purchases, 6.3% (£71.0 billion) compared with 2.6% (£15.5 billion). Together with a rise in work of a capital nature this resulted in aGVA rising by 10.7% (£58.9 billion). This is the fifth consecutive year of growth in aGVA for the sector, following the fall between 2008 and 2009, (see Figure 6).
Figure 6: UK Non-Financial Services, turnover and purchases and resulting aGVA, 2008 to 2014
Source: Annual Business Survey (ABS) - Office for National Statistics
Notes:
- Excludes Financial and insurance; Public administration and defence; Public provision of Education; Public provision of Health and all medical and dental practice activities
Download this chart Figure 6: UK Non-Financial Services, turnover and purchases and resulting aGVA, 2008 to 2014
Image .csv .xlsAll of the sections within the Non-Financial Service sector continued to see increases in aGVA between 2013 and 2014 (see Figures 7 and 8).
Those sections which have made the largest contributions to growth are:
professional, scientific & technical (Section M)
administrative & support services (Section N)
information & communication (Section J)
These sections, which together accounted for 69.5% (£40.9 billion) of the increase in Non-Financial Service sector aGVA, are described, together with some of the other prominent sections, in more detail after Figure 7b.
Figure 7a: UK Non-Financial Services, aGVA by section, 2014
Source: Annual Business Survey (ABS) - Office for National Statistics
Notes:
- Excludes Financial and insurance; Public administration and defence; Public provision of Education; Public provision of Health and all medical and dental practice activities
Download this image Figure 7a: UK Non-Financial Services, aGVA by section, 2014
.png (108.9 kB) .xls (32.3 kB)
Figure 7b: UK Non-Financial Services, aGVA by section, 2008 to 2014
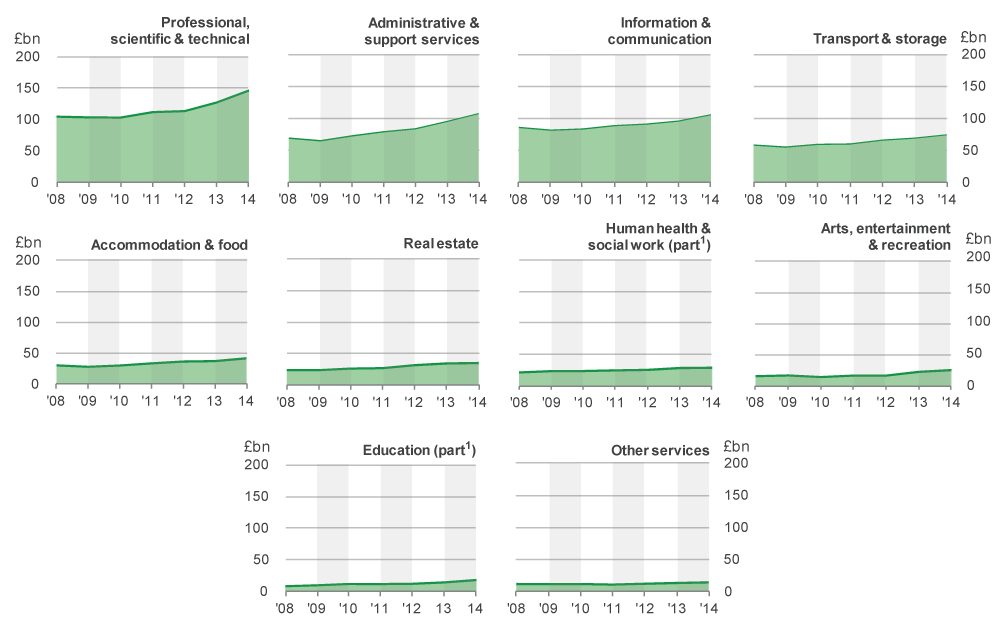
Source: Annual Business Survey (ABS) - Office for National Statistics
Notes:
- Excludes Financial and insurance; Public administration and defence; Public provision of Education; Public provision of Health and all medical and dental practice activities
Download this image Figure 7b: UK Non-Financial Services, aGVA by section, 2008 to 2014
.png (66.0 kB) .xls (32.3 kB)
Professional, Scientific & Technical, Section M
Turnover in Professional, scientific & technical increased by 8.8% (£20.1 billion) between 2013 and 2014, with purchases increasing by 0.6% (£0.6 billion). The resulting growth in aGVA of 14.7% (£18.9 billion), meant aGVA remained above the level reported in 2008 for the fourth consecutive year.
This broad section, which covers a range of industries from Legal & accounting activities to Advertising & market research and Veterinary activities, saw increases in aGVA in all its divisions between 2013 and 2014. Those divisions within the section, having the largest impact on aGVA growth (with a combined 56.1% (£10.6 billion) contribution) between 2013 and 2014 were:
activities of head offices; management consultancy (Division 70)
other professional, scientific & technical activities (Division 74)
The growth shown within the ABS links to the Management Consultancies Association summary report for 2015 which reported strong growth in 2014 with an 8.4% increase in fee income.
Administrative & Support Services, Section N
Between 2013 and 2014, Administrative & support services saw turnover rise by 8.8% (£16.4 billion), while purchases increased by 5.2% (£4.8 billion) leading to an aGVA increase of 12.7% (£12.2 billion).
Two divisions contributed to over three-fifths (61.5%) of the growth within Administrative & support services:
employment activities (Division 78) with an aGVA increase of 14.0% (£3.9 billion)
office administrative, office support & other business support activities (Division 82) with an aGVA increase of 15.4% (£3.6 billion)
A growth in this sector was supported by the Recruitment and Employment Confederation report for 2013 to 2014 which indicated a strong increase in employment activities, along with our Workforce Jobs figures which showed a growth of 2.4% in 2014.
Information & Communication , Section J
Turnover in Information & communication increased by 5.2% (£10.2 billion) between 2013 and 2014 which, coupled with a smaller 2.8% (£2.8 billion) increase in purchases, resulted in an increase in aGVA of 10.0% (£9.8 billion) between 2013 and 2014.
Those divisions having the largest impact on aGVA growth, with a combined 76.7% (£7.5 billion) contribution between 2013 and 2014 were:
telecommunications (Division 61), with an aGVA increase of 17.2% (£4.4 billion)
computer programming, consultancy & related activities (Division 62), with an aGVA increase of 7.1% (£3.1 billion)
Division 62, which includes the development of mobile phone applications, has shown consistent growth of above 7.0% in each of the last 3 years. The addition of mobile phone applications to the CPI basket in 2011 and increase in internet use (2014) on mobile devices indicates this activity has been increasing in importance in recent years The Bank of England’s agents’ summary of business conditions suggests that some of the increase in demand for IT services may have come “from the finance sector and increased interest in cloud services from most sectors”.
Transport & Storage, Section H
Turnover in Transport & storage increased by 5.5% (£8.6 billion) between 2013 and 2014, with purchases rising by 3.3% (£3.0 billion) resulting in a 7.3% (£5.2 billion) increase in aGVA.
Two divisions contributed 87.9% (£4.5 billion) of the growth within Transport & storage:
land transport & transport via pipelines (Division 49)
water transport (Division 50)
The growth in Division 49 was potentially influenced by the fall in oil prices towards the end of 2014,as reported in our Economic Review September 2014 and also supported by the Department of Energy and Climate Change (DECC) in Table 4.1.2 of their monthly release on fuel prices.
Accommodation & Food, Section I
Turnover in Accommodation & Food increased by 6.6% (£5.0 billion) between 2013 and 2014, with purchases rising by 3.0% (£1.1 billion) resulting in an 11.7% (£4.5 billion) increase in aGVA.
The division having the largest impact on aGVA growth was Accommodation (Division 55) with 24.4% (£2.7 billion) growth between 2013 and 2014.
Education, Section P – private provision only
Turnover in Education increased by 11.3% (£4.0 billion) between 2013 and 2014, with purchases rising by 3.8% (£0.8 billion) resulting in a 22.7% (£3.6 billion) increase in aGVA.
The part of private education having the largest impact on aGVA growth was Tertiary education (Class 85.42) with a 32.5% (£1.8 billion) increase.
Figure 8: UK Non-Financial Services, aGVA change by section 2008 to 2014
Source: Annual Business Survey (ABS) - Office for National Statistics
Notes:
- Excludes Financial and insurance; Public administration and defence; Public provision of Education; Public provision of Health and all medical and dental practice activities
Download this chart Figure 8: UK Non-Financial Services, aGVA change by section 2008 to 2014
Image .csv .xls7. Production Industries, Sections B to E
The Production sector in 2014 provided £218.1 billion, just under a fifth (19.7%) of the estimated aGVA total of £1,014.6 billion for the UK Non-Financial Business Economy.
Between 2013 and 2014, Production sector turnover remained relatively unchanged (a small decrease of £0.3 billion), while purchases increased by 0.2% (£0.9 billion). Together with increases in stock levels and changes in taxes, this led to a decrease in aGVA of 0.4% (£0.9 billion), which followed a 1.8% rise between 2012 and 2013. The decrease in 2014 sees Production sector aGVA just £4.4 billion below the level in 2008, at the start of the economic downturn (see Figure 9).
Production is the only sector within the UK Non-Financial Business Economy showing a fall in aGVA between 2013 and 2014. This is primarily due to the impact of Mining & quarrying (Section B) which saw aGVA fall by 30.7% (£7.3 billion), see Figure 11. All other sections within the Production sector (Manufacturing, Energy generation & supply and Water & waste management), saw a combined rise in aGVA between 2013 and 2014 of 3.3% (£6.4 billion). The levels of aGVA, turnover and purchases for these sections, both combined and individually in 2014, are above the levels seen in 2008, at the start of the economic downturn.
Figure 9: UK Production, turnover and purchases and resulting aGVA, 2008 to 2014
Source: Annual Business Survey (ABS) - Office for National Statistics
Download this chart Figure 9: UK Production, turnover and purchases and resulting aGVA, 2008 to 2014
Image .csv .xlsManufacturing (Section C), which contributes 72.1% of Production sector aGVA, saw a rise in aGVA of 1.6% (£2.5 billion) between 2013 and 2014.
Over the same period Energy generation & supply (Section D) and Water & waste management (Section E) also saw increases in aGVA of 9.6% (£2.3 billion) and 9.8% (£1.7 billion) respectively while Mining & quarrying (Section B) saw a decrease of 30.7% (£7.3 billion), see Figures 10 and 11.
Figure 10: UK Production, aGVA by section, 2008 to 2014

Source: Annual Business Survey (ABS) - Office for National Statistics
Notes:
- Includes oil and gas extraction
Download this image Figure 10: UK Production, aGVA by section, 2008 to 2014
.png (79.0 kB) .xls (33.3 kB)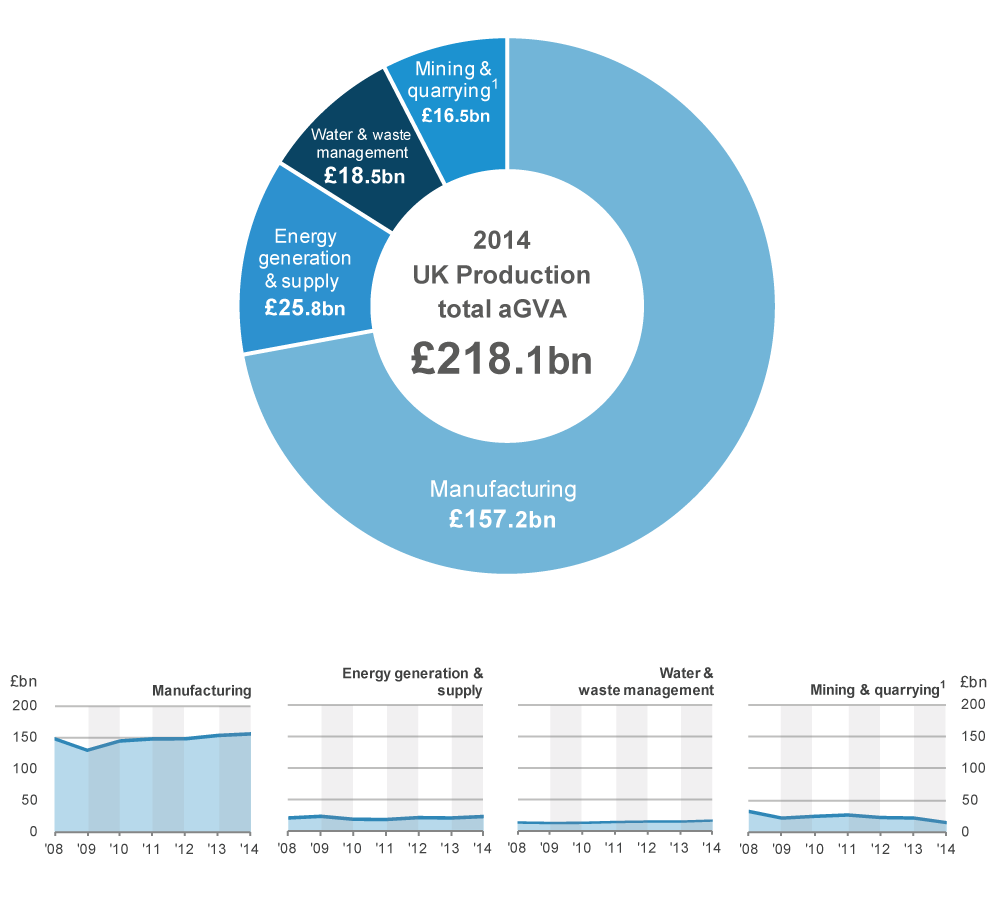
Figure 11: UK Production, aGVA change by section, 2008 to 2014
Source: Annual Business Survey (ABS) - Office for National Statistics
Notes:
- Includes oil and gas extraction
Download this chart Figure 11: UK Production, aGVA change by section, 2008 to 2014
Image .csv .xlsManufacturing, Section C
Between 2013 and 2014, Manufacturing saw increases of 0.5% (£2.5 billion) in turnover and 0.3% (£1.1 billion) in purchases which, together with rises in stock levels and changes in taxes, contributed to an increase in aGVA of 1.6% (£2.5 billion).
Those divisions contributing most to the growth in Manufacturing aGVA were:
manufacture of motor vehicles, trailers & semi-trailers (Division 29) with an aGVA increase of 30.7% (£4.1 billion)
manufacture of Machinery & equipment n.e.c. (Division 28) with an aGVA increase of 14.2% (£1.8 billion)
manufacture of Fabricated metal products, except machinery & equipment (Division 25) with an aGVA increase of 9.6% (£1.4 billion)
These 3 divisions saw a combined increase in aGVA of £7.3 billion, which was offset by the £3.8 billion aGVA decrease in Manufacture of other transport equipment (Division 30).
As was the case in 2013, the increase in Division 29 for this year can again be attributed to the increase in production, sales and exports of cars, in particular high end and luxury vehicles.
Our Economic Performance of the UK’s Motor Vehicle Manufacturing Industry release says growth in this industry has been in large due to the continued growth exports of Motor Vehicles to countries outside the EU. The Non-EU export market has seen growth for the last 6 years. Exports to non-EU countries are growing at a faster rate than exports to EU countries, this strong demand for exported UK cars is confirmed by reports from the car manufacturing trade body, the Society of Motor Manufacturers and Traders (SMMT). The SMMT report covering 2014 shows that the number of vehicles produced in the UK fell rapidly during the economic downturn, from 1.8 million in 2007 to 1.1 million in 2009. The industry has now partially recovered with 1.6 million vehicles being produced in 2014. Car output, the largest component of Division 29, rose to 1.53 million units, its highest level since 2007.
Other reasons cited by businesses as contributing to the rise in Manufacturing aGVA were businesses restructuring, the take-over of a similar business, the gaining of new contracts and reduction in purchases.
Across Manufacturing, almost 60% (14 out of 24) of the divisions contributing to this sector experienced decreases in aGVA between 2013 and 2014.
The 22.3% (£0.2 billion) decrease in aGVA for Manufacture of coke & refined petroleum products (Division 19) is caused by a reduction in turnover and purchases due to the drop in the price of crude oil and a decrease in stocks reported by businesses within the division. Due to the small size of this division in terms of Manufacturing aGVA, annual changes should be viewed with care.
The economic downturn and recovery in the Manufacturing sector described by the ABS, between 2008 and 2014, is broadly in line with movements in comparable industries of our “UK Manufacturers' sales by product (PRODCOM)” figures. Both the ABS turnover estimates and the PRODCOM industry total sales estimates show a fall between 2008 and 2009 and then annual increases from 2009 to 2014, with ABS showing a slight fall in 2012.
Other Production, Sections B, D to E
This sector consists of Mining & quarrying (Section B, which includes oil and gas extraction), Energy generation & supply (Section D) and Water & waste management (Section E). The sector saw decreases in turnover and purchases of 1.4% (£2.8 billion) and 0.2% (£0.3 billion) respectively, which resulted in a decrease in aGVA of 5.3% (£3.4 billion).
The section contributing the most to the fall in aGVA was Mining & quarrying with a large decrease of 30.7% (£7.3 billion), offset by Sections D and E which saw increases of 9.6% (£2.3 billion) and 9.8% (£1.7 billion) respectively.
Mining & Quarrying, Section B, which includes Oil and Gas Extraction
Turnover in Mining & quarrying decreased by a greater amount of 16.0% (£7.9 billion) than purchases, which decreased by 5.1% (£1.5 billion). Together with decreases in work of a capital nature, this resulted in a decrease of 30.7% (£7.3 billion) in aGVA.
The main contributor to the fall in aGVA was Extraction of crude petroleum & natural gas (Division 06), where turnover decreased by 22.1% (£7.7 billion) and purchases by 10.5% (£2.1 billion). Together with a £0.9 billion decrease in work of a capital nature, this resulted in a fall in aGVA of 35.8% (£6.6 billion) in Division 06.
One potential factor behind this was the sharp fall in commodity prices in the second half of 2014. For example, as reported in our Economic Review, crude oil prices fell from an average of £69.72 per barrel between 2011 and 2013 to £31.78 at the start of 2015. This is also supported by the Department of Energy and Climate Change (DECC) in Table 4.1.2 of their monthly release on fuel prices. Another contributing factor may be the slow-down in growth of emerging economies, which fell from 5.0% in 2013 to 4.6% in 2014 as reported by the IMF in their July 2015 release of the World Economic Outlook.
Energy Generation & Supply, Section D
Energy generation & supply also saw an increase between 2013 and 2014. Turnover increased by 4.0% (£4.5 billion) and purchases by 2.2% (£1.9 billion), which resulted in an aGVA increase of 9.6% (£2.3 billion).
The continuing population rise of micro-businesses (those with less than 10 employees) in this sector is thought to be due to the growth of small producers of renewable energy encouraged by various green grants, subsidies and "feed in tariffs". Between 2013 and 2014, the number of micro-businesses in this section increased by 27.0% (to over 2,997 businesses).
Notes for Manufacturing Industries, Section C
Please note that the ABS figures for the Manufacturing industries should not be compared directly with PRODCOM 's “Total Sales of Businesses Classified to this Industry” figure because:
PRODCOM publish a calendar year figure whereas ABS figures are based on annual responses from businesses covering a range of financial years
PRODCOM focuses on products whilst ABS focuses on activities. The total value of production, in a particular industry, may differ from the turnover reported by ABS as an enterprise might carry out other activities, in addition to production, that contribute to its turnover
PRODCOM and ABS produce estimates using different sampling and statistical methodologies
PRODCOM publish industry totals for turnover excluding HMRC Duty, while ABS publishes turnover inclusive of Duty
8. Distribution Industries, Section G
The Distribution industries in 2014 contributed £188.8 billion, 17.1% of the estimated aGVA total of £1,104.6 billion for the UK Non-Financial Business Economy.
The large rise in Distribution aGVA of 24.8% (£37.5 billion) between 2013 and 2014 was a result of a fall in purchases, for the first time since 2009, by a greater proportion of 3.7% (£48.8 billion) than the fall in turnover of 0.9% (£13.8 billion), see Figure 12.
This second consecutive annual increase in aGVA takes it above the level seen in 2008, at the start of the economic downturn, for the first time by 19.7% (£31.0 billion).
Figure 12: UK Distribution, turnover and purchases and resulting aGVA, 2008 to 2014
Source: Office for National Statistics
Download this chart Figure 12: UK Distribution, turnover and purchases and resulting aGVA, 2008 to 2014
Image .csv .xlsThe division contributing most to the growth in Distribution aGVA was Wholesale with a 73.9% (£27.7 billion) contribution, as a result of purchases falling by a greater amount than turnover (see Figures 13 and 14).
The remaining increases in aGVA which were contributed by Retail and Motor Trades, resulted from increases in both turnover and purchases.
Figure 13: UK Distribution, aGVA by division, 2008 to 2014

Source: Annual Business Survey (ABS) - Office for National Statistics
Download this image Figure 13: UK Distribution, aGVA by division, 2008 to 2014
.png (104.3 kB) .xls (30.7 kB)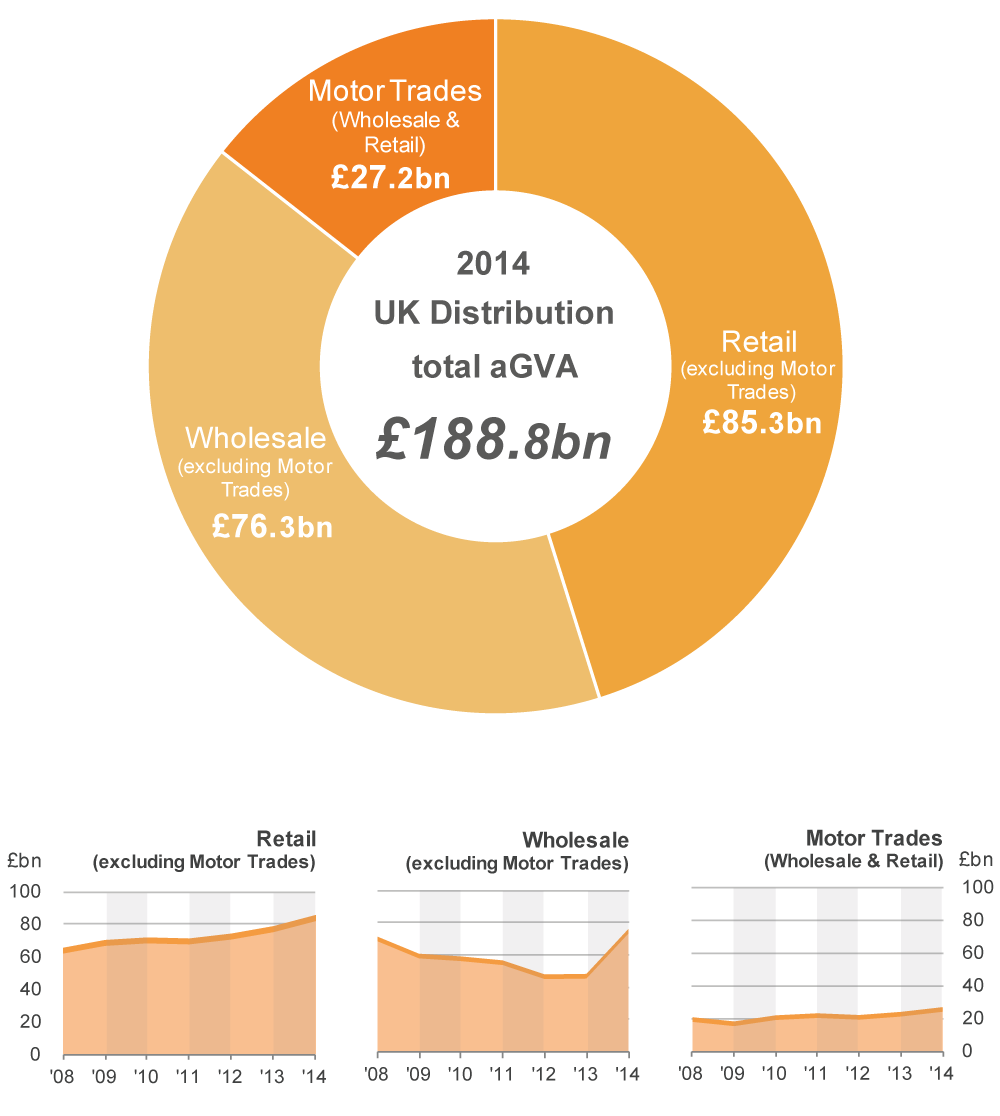
Wholesale (Excluding Motor Trades), Division 46
Wholesale experienced greater decreases in purchases of 8.0% (£71.9 billion) than turnover of 4.6% (£44.7 billion) between 2013 and 2014, which resulted in an increase in aGVA of 57.1% (£27.7 billion).
The rise in aGVA between 2013 and 2014 was driven by Other specialised wholesale (Group 46.7), which showed an increase of £25.0 billion. This group includes Wholesale of solid, liquid & gaseous fuels & related products, where reasons cited by businesses for their fall in turnover and purchases (and the resulting rise in aGVA) over this period were the fall in oil prices during 2014. A potential factor behind this was the sharp fall in commodity prices in the second half of 2014, which is described in the earlier chapter on Mining & quarrying (Section B) within the Production sector.
Retail (Excluding Motor Trades), Division 47
Retail aGVA saw an increase of 8.7% (£6.8 billion) between 2013 and 2014. This growth in aGVA was a result of a 3.9% (£14.0 billion) increase in turnover and a smaller 3.0% (£8.4 billion) increase in purchases.
The increase in aGVA was mainly caused by an 8.7% (£2.9 billion) rise in Retail sale in non-specialised stores (Group 47.1) which includes retail sales in super-stores and department stores.
Reports from businesses continued to indicate that turnover from mail orders and via the internet increased at a higher rate than turnover from shops. Although increasing, retail sales from mail order and the internet remains a small share of total turnover.
Retail sale of automotive fuel (Group 47.3) saw decreases in turnover of 4.7% (£0.8 billion) and purchases of 5.8% (£0.9 billion). Reports from businesses indicate that the decrease in turnover and purchases were linked to the drop in crude oil prices.
Motor Trades (Wholesale and Retail), Division 45
Between 2013 and 2014, both purchases and turnover increased, by 11.3% (£14.6 billion) and 11.1% (£16.9 billion) respectively. This resulted in aGVA increasing by 12.1% (£2.9 billion), a second consecutive increase.
Within Motor Trades, Sale of motor vehicles (Group 45.1) contributed most to the growth with a 20.6% (£2.6 billion) increase in aGVA between 2013 and 2014. This is the second consecutive annual increase for this group.
Figure 14: UK Distribution, aGVA change by division, 2008 to 2014
Source: Annual Business Survey (ABS) - Office for National Statistics
Download this chart Figure 14: UK Distribution, aGVA change by division, 2008 to 2014
Image .csv .xlsNotes for Distribution Industries, Section G
Retail (Excluding Motor Trades), Division 47
Please note that the ABS figures for the Retail industry should not be compared directly with the annual “value non seasonally adjusted” figures in the monthly “'Retail Sales Inquiry” release because:
- the ABS figures cover the United Kingdom, while the “Retail Sales Inquiry” covers Great Britain only
- the ABS “total” turnover figures in the main results tables represent sales to both business and the public and are published excluding VAT, while those in the “Retail Sales Inquiry” represent sales to the public only and are published including VAT
The ABS does publish “retail” turnover figures (for sales to the public only) in its Retail Commodities tables in the June release which are inclusive of VAT and will be closer to “Retail Sales Inquiry” figures, however;
- the ABS “retail” turnover figures includes data for National Health Service receipts and commissions whereas the “Retail Sales Inquiry” do not
- Retail Sales Inquiry does not cover household spending on services bought from the retail sector as it is designed to only cover goods
- although both outputs quote figures for a calendar year, the “Retail Sales Inquiry” produce monthly output measures which include average weekly value and volume estimates. The value estimates reflect the average total turnover that businesses have collected over a standard reporting period, while the volume estimates are calculated by taking the value estimates and adjusting to remove the impact of price changes. ABS figures are based on annual responses from businesses covering a range of financial years
9. Construction Industries, Section F
The Construction industries contributed £86.3 billion, 7.8% of the estimated aGVA total of £1,014.6 billion for the UK Non-Financial Business Economy in 2014.
Construction turnover increased by 10.0% (£19.9 billion) between 2013 and 2014, with purchases increasing by 14.1% (£17.0 billion). Together with a rise in stock levels, this resulted in a growth in aGVA of 9.8% (£7.7 billion). This is the fourth consecutive year of growth, taking it 1.8% (£1.5 billion) above the level seen in 2008, at the start of the economic downturn, for the first time, see Figure 15.
Figure 15: UK Construction, turnover and purchases and resulting aGVA, 2008 to 2014
Source: Annual Business Survey (ABS) - Office for National Statistics
Download this chart Figure 15: UK Construction, turnover and purchases and resulting aGVA, 2008 to 2014
Image .csv .xlsAs in the previous couple of years, the growth in Construction was mainly in Construction of buildings (Division 41) with a rise of 17.5% (£5.2 billion), see Figures 16 and 17. Specialised construction trades (Division 43) also contributed, with an increase in aGVA of 9.3% (£3.3 billion), but Civil engineering (Division 42) experienced a decrease in aGVA of 5.5% (£0.8 billion).
Figure 16: UK Construction, aGVA by division, 2008 to 2014

Source: Annual Business Survey (ABS) - Office for National Statistics
Download this image Figure 16: UK Construction, aGVA by division, 2008 to 2014
.png (87.1 kB) .xls (30.2 kB)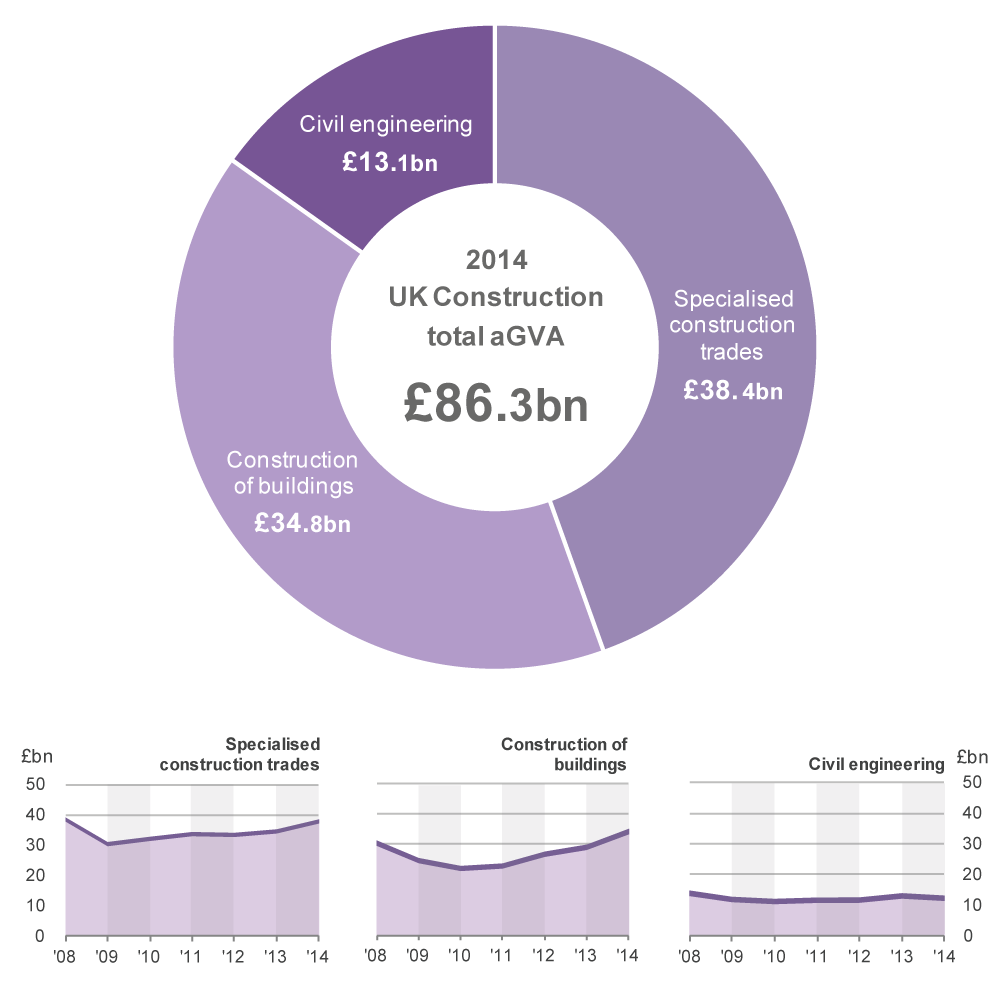
Construction of Buildings (Division 41)
Construction of buildings, which was the main contributor for the growth in the Construction sector, experienced an increase in aGVA of 17.5% (£5.2 billion) between 2013 and 2014. This was a result of a 12.9% (£10.3 billion) increase in turnover and an 18.5% (£9.4 billion) increase in purchases, coupled with a £4.5 billion rise in stock levels. As was the case in the previous 2 years, the main reason for the growth in aGVA was in the Development of building projects (Group 41.1).
The growth in Construction may be due to several factors such as rising house prices as reported in our Economic Review, July 2015 and improving credit conditions as reported by the Bank of England.
Our House Price Index (HPI) shows that house prices grew by 3.5% in 2013 and by 10.0% in 2014. The increase in the demand for housing is also reflected by data from the Bank of England which show that mortgage approvals were 5.2% higher in 2014 than in 2013.
Figure 17: UK Construction, aGVA change by division, 2008 to 2014
Source: Annual Business Survey (ABS) - Office for National Statistics
Download this chart Figure 17: UK Construction, aGVA change by division, 2008 to 2014
Image .csv .xlsNotes for Construction Industries, Section F
Please note that the ABS figures for the Construction industries should not be compared directly with annual figures in the monthly “Output in the Construction Industry” release because:
the ABS figures cover the United Kingdom, while the “Output in the Construction Industry” covers Great Britain only
the 2 surveys measure different concepts of this industry
while both quote figures for a calendar year, the “Output in the Construction Industry” are based on the aggregate of the responses to 12 monthly surveys, whereas ABS figures are based on annual responses covering a range of business years
the ABS figures will always be larger than those in the “Output in the Construction Industry” because the latter excludes: Property developers (SIC 41.1); Payment on purchased services (architects, technical engineering, etc.); Payment to subcontractors, unless the subcontractors are not classified to construction and therefore are not part of the survey; Value of land; Value of materials sold (which are not part of a structure); and Fixtures, equipment and tools that are sold
the ABS figures include secondary activities related to businesses classified within the construction sector, while the “Output in the Construction Industry” covers only the construction activity of the businesses
10. Agriculture (part), Forestry and Fishing, Section A
The ABS covers only hunting, forestry, fishing and the support activities to agriculture. Commentary is therefore limited because the sector’s size in terms of economic output, as measured by the ABS, is small in comparison to the other sectors of the UK Non-Financial Business Economy. However, data for these parts of Section A can be found in the reference tables linked to this bulletin.
Note that the values quoted below for Section A are in £ millions.
The part of Section A covered by ABS showed rises in turnover of 20.9% (£927 million) between 2013 and 2014 and in purchases of 23.7% (£650 million) which led to an increase of 15.7% (£291 million) in aGVA between 2013 and 2014. The main contributor to this increase was Silviculture and other forestry activities (Group 02.1) which covers the cultivation of trees for timber and pulp.
This rise means that for the second consecutive year at £2,147 million, aGVA is higher than the level in 2008, at the start of the economic downturn.
Comparable GVA figures for the rest of Agriculture (which includes crop and animal production) are available in Chapter 3 (Table 3.2) of the Agriculture in the United Kingdom release published annually by the Department for Environment, Food and Rural Affairs (DEFRA), and shows a value of £9,922 million for 2014.
Back to table of contents