Table of contents
- Introduction
- Changes since the first publication in 1971
- Classification
- Geographies
- Turnover
- VAT thresholds
- Employment
- Exclusions
- Suppression of data
- Comparisons with other analyses
- Published business analyses from the IDBR
- References
- Appendix A: Former or abolished areas
- Appendix B: UK Standard Industrial Classification
1. Introduction
The data contained in the publications are produced from a snapshot of the Inter-Departmental Business Register (IDBR).
Table 1: Inter-Departmental Business Register data extract dates for UK business publications
| Year | Date of extracts |
| 2004 | 24 March 2004 |
| 2005 | 18 March 2005 |
| 2006 | 18 March 2006 |
| 2007 | 16 March 2007 |
| 2008 | 21 March 2008 |
| 2009 | 27 March 2009 |
| 2010 | 22 March 2010 |
| 2011 | 28 March 2011 |
| 2012 | 12 March 2012 |
| 2013 | 12 March 2013 |
| 2014 | 14 March 2014 |
| 2015 | 13 March 2015 |
| 2016 | 11 March 2016 |
| 2017 | 10 March 2017 |
| Source: Office for National Statistics | |
Download this table Table 1: Inter-Departmental Business Register data extract dates for UK business publications
.xls (27.1 kB)Introduced in 1994, the IDBR provides the basis for Office for National Statistics (ONS) to conduct surveys of businesses.
The main administrative sources for the IDBR are Value Added Tax (VAT) trader and Pay-As-You-Earn (PAYE) employer information passed to ONS by HM Revenue and Customs under the Value Added Tax Act 1994 for VAT traders and the Finance Act 1969 for PAYE employers; details of incorporated businesses are also passed to ONS by Companies House. ONS survey data and survey information from the Department of Finance and Personnel Northern Ireland (DFPNI) and the Department for Environment, Food and Rural Affairs farms register provide auxiliary information. The IDBR combines the information from the three administrative sources with this survey data in a statistical register comprising over 2.5 million enterprises. These comprehensive administrative sources combined with the survey data contribute to the coverage on the IDBR, which is one of its main strengths; an Economic Trends article1 gives further details.
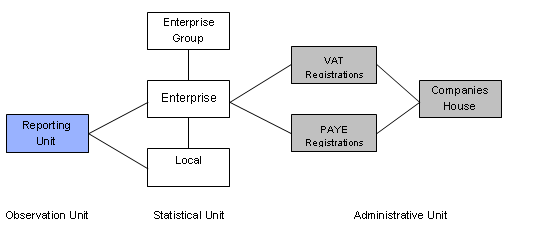
The business units held on the IDBR can be grouped into three types:
- Administrative Units: VAT trader and PAYE employer information supplemented with incorporated business data from Companies House
- Statistical Units: A group of legal units under common ownership is called an Enterprise Group – an enterprise is the smallest combination of legal units (generally based on VAT and/or PAYE records), which has a certain degree of autonomy within an Enterprise Group; an individual site (for example, a factory or shop) in an enterprise is called a local unit
- Observation Units: Reporting Units hold the mailing address to which the survey questionnaires are sent; the questionnaire can cover the enterprise as a whole, or parts of the enterprise identified by lists of local units

The publication presents analysis of businesses at both Enterprise and Local Unit level.
Notes for: Introduction
- For more information, please see: Perry J (1995) The Inter-Departmental Business Register, in Economic Trends 505, November 1995, Office for National Statistics, HMSO: London.
2. Changes since the first publication in 1971
From 1971 to 1984, the annual publications1 provided counts of manufacturing local units (sites) and their aggregate employment based on the Business Statistics Office register. The 1985 publication2 introduced two significant changes to extend the range of information provided. New tables covering the whole economy recorded Value Added Tax (VAT)-legal units by turnover and the inclusion of local units with employment below 20 extended the coverage of existing tables for manufacturing industries. The 1986 to 1988 monitors were published on the same basis but with the addition of a new table in 1987 providing counts of local units analysed by year. From 1989, geographical analyses have been produced extending the legal unit tables. In the 1992 publication, legal unit tables were expanded to include businesses registered for VAT with a turnover below the VAT threshold.
From 1994, this publication has presented data for enterprises instead of legal units. The enterprise is generally the same as the legal unit but in some cases enterprises are formed from several legal units with close financial links3. Thus the number of enterprises is slightly lower than the number of legal units that they represent. Local unit (for example, a factory or a shop) tables were not included in 1995 because the quality of classification at that level to the 1992 revision of the Standard Industrial Classification (SIC 1992), was not sufficient for publication but were re-introduced in 1996. The 2003 edition was enhanced and the publication now presents register analyses at enterprise level, by turnover and employment size for all industries. Previously, tables by employment size bands covered only the manufacturing sector. From 2003 this publication also includes analyses on all industries at local unit level. Previously, only the manufacturing sector was covered. Table B7.4 shows counts of VAT and/or Pay-As-You-Earn (PAYE) based enterprises for 2009 to 2013 by SIC 2007.
Counts of legal units registered in each year from 1984 to 1993 and VAT-based enterprises for 1994 and 1995 by VAT Trade Classification are provided in Table B7.1 of this publication. Table B7.2 shows counts of VAT-based enterprises, excluding those with turnover of zero, by broad industry group for 1995 to 2002. For 2003 to 2007 the table excludes those units with turnover of zero where employment is also zero. Table B7.3 shows counts of VAT and/or PAYE based enterprises for 2007 to 2009 by broad industry group UK SIC 2003. Table B7.4 shows counts of VAT and/or PAYE based enterprises for 2009 to 2013 by SIC 2007.
From 2004 to 2013 table numbering was enhanced to provide a more logical order, now commencing with the more detailed local unit level tables. The table numbering follows a standard convention across the tables with the leading character denoting the level of the table; “A” denotes local unit and “B” denotes enterprise. Where the table number matches across enterprise and local unit the structure will be the same and the data comparable.
From 2008 the publication was expanded to include PAYE-based enterprises that are not also registered for VAT, extending the scope from the previous VAT-based enterprise tables. The increase in units is most noticeable in the VAT-exempt industries of finance, education, health and public administration.
The 2009 publication saw the introduction of the 2007 revision to the Standard Industrial Classification (UK SIC 2007) in place of the 2003 revision (UK SIC 2003) used previously. To reflect the changes in broad industry group a new table, B7.4, was introduced which shows counts of VAT and/or PAYE based enterprises by broad industry group (UK SIC 2007) for 2009 to 2013.
In 2012 an increase of approximately 31,000 enterprises between 2011 and 2012 was caused by improvements to HM Revenue and Customs (HMRC) computer systems leading to previously excluded businesses being added to the Inter-Departmental Business Register (IDBR). These businesses were registered before 2012, so distort the year-on-year change.
Between 2013 and 2014, HMRC information showed a growing number of PAYE schemes and a rise in numbers of new scheme registrations. Those that were allied to company registration data fuelled an increase in numbers of enterprises on the business register. While the growth in PAYE schemes coincides with the introduction of the Real Time PAYE reporting system (RTI), HMRC have indicated there are no technical reasons associated with RTI alone that would have increased the number of enterprises on the register during the period. HMRC have no evidence of behavioural changes in the timing of PAYE scheme registrations through the year.
From 2014 to 2016, the ONS Data Explorer tool replaced reference tables, enabling users to access, use and customise ONS data more effectively. This has meant the tables are no longer presented for these years and instead exist as a series of dataset collections. This enables us to meet the Government’s Open Data and Transparency policy.
In 2015 we extended the coverage of businesses in the release to include a population of solely PAYE-based businesses that were previously excluded because of a risk of duplication. In total 105,000 businesses were added into 2015. Improvements in matching of administrative data and research into those units excluded have indicated that the risk of duplication is very small. The addition of these businesses brings the publication in line with Business Demography and the Department for Business, Energy and Industrial Strategy (BEIS) Business Population Estimates, which both include these businesses. A more detailed note explaining these changes is available in Improving the coverage of UK Business, Activity, Size and Location.
In 2017 the data have been published as an excel workbook. We are currently developing a new data explorer tool with greater functionality, which will be available for the next publication.
Notes for: Changes since the first publication in 1971
Office for National Statistics Business Monitor PA1003 – Analysis of UK Manufacturing (Local) Units by Employment Size, HMSO: London. This was published in respect of 1971 to 1973, 1975 to 1979 and 1982 to 1984. The omission of monitors for 1980 and 1981 reflects the basis upon which the monitors were produced. For years up to 1979, counts of units and employment relate to the reference year, but for 1982 onwards employment relates to a period two years prior to the reference year (for example, the 1982 monitor includes employment estimates for 1980).
Office for National Statistics PA1003 Size Analysis of United Kingdom Businesses, Office for National Statistics: Newport. Published in respect of 1985 to 1996 as a paper document; copies of which are available from the British Library. For years 1997 to date the publication is available on the internet as PDF files with downloadable Excel files.
Regulation (EC) No 177/2008 of 20 February 2008 established a common framework for business registers for statistical purposes.
3. Classification
From 2009, the release uses the 2007 revision to the Standard Industrial Classification (UK SIC 2007) in place of the 2003 revision (UK SIC 2003). The UK SIC 2007 is a major revision of UK SIC 2003 with changes at all levels of the SIC. These revisions are motivated by the need to adapt the classifications to changes in the world economy. The revised classifications reflect the growing importance of service activities in the economy over the last 15 years, mainly due to the developments in information and communication technologies (ICT).
Details of the UK SIC 2007 are available on the National Statistics Classification website and in the following electronic publications:
UK Standard Industrial Classification of Economic Activities 2007
Indexes to the UK Standard Industrial Classification of Economic Activities 2007
Information relating to the implementation of UK SIC 2007 and the major differences between UK SIC 2003 and UK SIC 2007 is presented in the August 2008 edition of the Economic and Labour Market Review.
To assist with comparison of data a table showing the broad correspondence between the sections of UK SIC 2003 and UK SIC 2007 is included in the publication. Please note that this table presents only the rough one-to-one correspondence between the sections: further additional details are necessary to establish the complete correspondence.
Main differences between UK SIC 2003 and UK SIC 2007 are:
Section J – Information and communication: This is a major new sector and brings together publishing, motion picture and sound recording industries, broadcasting (radio and TV industries), telecommunications, internet activities, and other news services
Section L – Property: Development and selling of real estate, previously in Section K – Property and business services under UK SIC 2003, now moves to Construction under UK SIC 2007
Section M – Professional, scientific and technical services: Previously incorporated under “business activities” as part of Section K under UK SIC 2003, this is now a new section
Section N – Administrative and support services: Formerly covered under Section K under UK SIC 2003, Section N is a new grouping which pulls in units from many parts of UK SIC 2003, for example: employment services, call centres, travel arrangements and reservation services, investigation and security services
Other significant changes include:
Recycling moves from Manufacture (UK SIC 2003) to Section E – Water supply, sewerage, waste management and remediation (UK SIC 2007); this is grouped with Section D – Electricity, gas, steam and air conditioning supply to form the Utilities grouping
Sewage, refuse disposal and sanitation moves from Section O – Other community services (UK SIC 2003) to Section E (UK SIC 2007)
Repair and maintenance of personal and household goods (UK SIC 2003) moves from the Retail section to the Services sector (UK SIC 2007)
Holding companies move from the Services sector (UK SIC 2003) to the Finance sector (UK SIC 2007)
Veterinary services move from the Health sector (UK SIC 2003) to the Professional, scientific and technical activities sector (UK SIC 2007)
A new broad industry group structure has been defined under UK SIC 2007 and is listed in Table 1.
Table 2: Industry group structure under UK Standard Industrial Classification (SIC) 2007
| Description | UK SIC 2007 Section | Division |
| Agriculture, forestry and fishing | A | 01/03 |
| Production | B, C, D and E | 05/39 |
| Mining, quarrying and utilities | B, D and E | 05/09, 35/39 |
| Manufacturing | C | 10/33 |
| Construction | F | 41/43 |
| Wholesale and retail; repair of motor vehicles | G | 45/47 |
| Motor trades | G | 45 |
| Wholesale | G | 46 |
| Retail | G | 47 |
| Transport and storage (including postal) | H | 49/53 |
| Accommodation and food services | I | 55/56 |
| Information and communication | J | 58/63 |
| Finance and insurance | K | 64/66 |
| Property | L | 68 |
| Professional, scientific and technical | M | 69/75 |
| Business administration and support services | N | 77/82 |
| Public administration and defence | O | 84 |
| Education | P | 85 |
| Health | Q | 86/88 |
| Arts, entertainment, recreation and other services | R, S, T and U | 90/99 |
| Source: Office for National Statistics | ||
Download this table Table 2: Industry group structure under UK Standard Industrial Classification (SIC) 2007
.xls (28.2 kB)Section T covers private households and as such is out of scope of the business register and will always show up as zero; however, for completeness they are included in the range of classifications for the publication.
Notable changes to the broad industry group under UK SIC 2007 are:
Hotels and catering have now been relabelled Accommodation and food services
the former group Post and telecommunications has been split, with Postal and Courier activities being included in Transport and storage, and the remaining Telecommunications being relabelled Information and communication which now includes film, television and radio
Property and business services have been split into three new groups: Property; Professional, scientific and technical; and Business administration and support services
Public administration is now separated from “Other services”, creating two new groupings
More information on UK SIC 2003 and UK SIC 2007 is provided in Appendix B.
Back to table of contents4. Geographies
Regional analyses are provided for VAT and/or PAYE-based enterprises and local units. Where an enterprise has several local units, the location of the enterprise is generally the main operating site or the head office. For various reasons it is possible to get multiple business registrations at a single address and this can distort data for smaller geographical areas. Previous to 2014, Tables B1.1, B1.2, B1.3, B1.4, B2.1 and B2.2 provide summaries of the location of enterprises, and Tables A1.1, A1.2 and A2.1 provide comparable data for local units (See note 8).
From 2005, the geographies presented in the publication for England and Wales relate to Middle Layer Super Output Area (MSOA) derived from output area, the stable geographic building block now being used to produce statistics. There are 7,193 Middle Layer SOAs in England and Wales (6,780 in England, 413 in Wales) which are constrained by the 2003 local authority boundaries. District, County and Region figures are aggregations of these MSOAs. This methodology is consistent with that used to produce the Neighbourhood Statistics datasets.
For Scotland, the geographies relate to “intermediate zones”, a layer equivalent to MSOA. There are 1,235 intermediate zones which are aggregated together to define Council Areas and the region of Scotland. From 2011, the Northern Ireland geographies relate to Lower Super Output Areas, a geographic hierarchy designed to improve the reporting of small area statistics. There are 890 Northern Irish SOAs (based on Output Areas).
From 2010, the publication includes totals for the new Unitary Authorities introduced in April 2009, along with the former county or district totals to aid comparison:
the former county of Cornwall and Isles of Scilly and the 6 former districts within Cornwall and Isles of Scilly were abolished and replaced by Cornwall unitary authority and Isles of Scilly unitary authority
the former county of Durham and the 7 former districts within Durham were abolished and replaced by County Durham unitary authority
the former county of Northumberland and the 6 former districts within Northumberland were abolished and replaced by Northumberland unitary authority
the former county of Shropshire and the 5 former districts of Shropshire were abolished and replaced by Shropshire unitary authority
the former county of Wiltshire and the 4 former districts within Wiltshire were abolished and replaced by Wiltshire unitary authority
the former county of Cheshire and the 6 former districts within Cheshire were abolished and split across Cheshire East unitary authority and Cheshire West and Chester unitary authority
the former county of Bedfordshire and the 3 former districts within Bedfordshire were abolished and split across Bedford and Central Bedfordshire unitary authorities
Previous to 2014, Tables A6.1, A6.2, B6.1, B6.2 and B6.3 were presented by Parliamentary Constituency boundaries, the areas used to elect MPs (Members of Parliament) to the House of Commons. Constituency boundaries are determined by the Boundary Commissions (one each for England, Scotland, Wales and Northern Ireland). From 2010, the boundaries reflect the new areas which became operative on 6 May 2010, the date of the general election. Differences may be identified when comparing statistics for Electoral and SOA areas in England and Wales, even where the boundaries are the same. These are due to different methodologies used in assigning postcode data and are likely to be more prevalent where the postcodes are business PO Boxes. PO Box postcodes are assigned to electoral areas by a “point-in-polygon” process using widely available grid references which relate to the local Royal Mail sorting office.
In accordance with guidelines on the presentation of statistics by geography the names of the geographic areas are those currently in use and include totals for metropolitan counties for statistical purposes. Further details can be found on the ONS geography web pages.
Detailed notes to assist in comparing geographies with data for previous years are available in Appendix A: Former or abolished areas. More comprehensive information on the structure of geographies used by Office for National Statistics is available.
Back to table of contents5. Turnover
Turnover provided to Office for National Statistics (ONS) for the majority of traders is based on Value Added Tax (VAT) returns for a 12-month period. For 2017 these relate to a 12-month period covering the financial year 2015 to 2016. For other records, in particular members of VAT group registrations; turnover may relate to an earlier period or survey data. For traders who have registered more recently, turnover represents the estimate made by traders at the time of registration.
The turnover figures on the register generally exclude VAT but include other taxes, such as the revenue duties on alcoholic drinks and tobacco. They represent total UK turnover, including exempt and zero-rated supplies.
Back to table of contents6. VAT thresholds
Traders may be registered below the Value Added Tax (VAT) threshold or may choose not to de-register should their turnover fall below the threshold. Table 3 shows VAT thresholds for each year.
Table 3: Value Added Tax thresholds by year, UK, March 1986 to March 2017
| Operative dates | VAT registration threshold (£) | Operative dates | VAT registration threshold (£) | |
| 19 Mar 1986 to 17 Mar 1987 | 20,500 | 01 Apr 2001 to 24 Apr 2002 | 54,000 | |
| 18 Mar 1987 to 15 Mar 1988 | 21,300 | 25 Apr 2002 to 09 Apr 2003 | 55,000 | |
| 16 Mar 1988 to 14 Mar 1989 | 22,100 | 10 Apr 2003 to 31 Mar 2004 | 56,000 | |
| 15 Mar 1989 to 20 Mar 1990 | 23,600 | 01 Apr 2004 to 31 Mar 2005 | 58,000 | |
| 21 Mar 1990 to 19 Mar 1991 | 25,400 | 01 Apr 2005 to 31 Mar 2006 | 60,000 | |
| 20 Mar 1991 to 10 Mar 1992 | 35,000 | 01 Apr 2006 to 31 Mar 2007 | 61,000 | |
| 11 Mar 1992 to 16 Mar 1993 | 36,600 | 01 Apr 2007 to 31 Mar 2008 | 64,000 | |
| 17 Mar 1993 to 30 Nov 1993 | 37,600 | 01 Apr 2008 to 30 Apr 2009 | 67,000 | |
| 01 Dec 1993 to 29 Nov 1994 | 45,000 | 01 May 2009 to 31 Mar 2010 | 68,000 | |
| 30 Nov 1994 to 28 Nov 1995 | 46,000 | 01 Apr 2010 to 31 Mar 2011 | 70,000 | |
| 29 Nov 1995 to 26 Nov 1996 | 47,000 | 01 Apr 2011 to 31 mar 2012 | 73,000 | |
| 27 Nov 1996 to 30 Nov 1997 | 48,000 | 01 Apr 2012 to 31 Mar 2013 | 77,000 | |
| 01 Dec 1997 to 31 Mar 1998 | 49,000 | 01 Apr 2013 to 31 Mar 2014 | 79,000 | |
| 01 Apr 1998 to 31 Mar 1999 | 50,000 | 01 Apr 2014 to 31 Mar 2015 | 81,000 | |
| 01 Apr 1999 to 31 Mar 2000 | 51,000 | 01 Apr 2015 to 31 Mar 2016 | 82,000 | |
| 01 Apr 2000 to 31 Mar 2001 | 52,000 | 01 Apr 2016 to 31 Mar 2017 | 83,000 | |
| Source: Office for National Statistics | ||||
Download this table Table 3: Value Added Tax thresholds by year, UK, March 1986 to March 2017
.xls (29.7 kB)Further details on VAT thresholds can be found on the HM Revenue and Customs website.
Back to table of contents7. Employment
The employment information on the Inter-Departmental Business Register (IDBR) is drawn mainly from the Business Register Employment Survey (BRES). Because this is based on a sample of enterprises, estimates from previous returns and from other Office for National Statistics (ONS) surveys have also been used. For the smallest units, either Pay-As-You-Earn (PAYE) jobs or employment imputed from Value Added Tax (VAT) turnover is used.
Back to table of contents8. Exclusions
We will exclude units solely Value Added Tax (VAT) based or solely Pay-As-You-Earn (PAYE) based where we estimate the employment to be 20 or more. Approximate numbers that are excluded pending review are detailed in this section.
Composite and managed services companies have been excluded where the address does not represent the location of the activities of these businesses, to avoid giving a false impression of growth in these locations. Identification of composite and managed services companies may be incomplete, inflating business counts primarily in the Professional, scientific and technical and Business administration and support sectors. Approximately 7,105 composite and managed services companies have been excluded from ONS data. Further details on composite and managed services companies are available.
Table 4: Excluded units solely Value Added Tax (VAT) based or solely Pay-As-You-Earn (PAYE) based where employment is 20 or more, UK, 2004 to 2017
| Year | 1 administrative unit with 20 or more employment | Composite and managed services companies |
| 2004 | 3,800 | 32,500 |
| 2005 | 3,900 | 47,200 |
| 2006 | 4,400 | 55,900 |
| 2007 | 4,100 | 66,200 |
| 2008 | 5,950 | 83,800 |
| 2009 | 5,010 | 41,265 |
| 2010 | 5,585 | 22,450 |
| 2011 | 6,150 | 14,720 |
| 2012 | 5,665 | 12,745 |
| 2013 | 5,390 | 10,760 |
| 2014 | 5,895 | 9,725 |
| 2015 | 7,875 | 8,645 |
| 2016 | 8,515 | 7,805 |
| 2017 | 9,870 | 7,105 |
| Source: Office for National Statistics | ||
Download this table Table 4: Excluded units solely Value Added Tax (VAT) based or solely Pay-As-You-Earn (PAYE) based where employment is 20 or more, UK, 2004 to 2017
.xls (27.1 kB)9. Suppression of data
Statistical disclosure control methodology is applied to Inter-Departmental Business Register (IDBR) data. This ensures that information attributable to an individual or individual organisation is not identifiable in any published outputs. The Code of Practice for Official Statistics, and specifically Principle 5 on Confidentiality, set out practices for how we protect data from being disclosed. The principle includes the statement that ONS outputs should “ensure that official statistics do not reveal the identity of an individual or organisation, or any private information relating to them, taking into account other relevant sources of information”. More information can be found in National Statistician’s Guidance: Confidentiality of Official Statistics and also on the Statistical Disclosure Control methodology page.
Back to table of contents10. Comparisons with other analyses
Comparisons with earlier publications should be treated with caution due to the changes in criteria highlighted earlier. Historically there are differences between HM Revenue and Customs estimates for Value Added Tax (VAT) registrations due to timing; the inclusion of solely Pay-As-You-Earn (PAYE) based units (for 2008 onwards) and differences in definitions. The exclusion of composite and managed services companies and the treatment of divisional VAT registrations by Office for National Statistics (ONS) will reduce the total, though the splitting of group registrations into separate enterprises will increase it.
When comparing the UK business data with the Business Demography data produced by ONS, a higher number of active businesses will be reported by Business Demography. This is because the Business Demography methodology takes into account businesses that were active at any time during the reference year, whereas UK business is based on a snapshot of the Inter-Departmental Business Register (IDBR) at a point in time in March. Additionally, Business Demography includes unmatched non-corporate PAYE businesses, which are excluded from UK business.
Back to table of contents11. Published business analyses from the IDBR
Published business analyses from the Inter-Departmental Business Register fall into three main categories: other related ONS data, Eurostat, and other government departments. These are explained in full in this section.
Other related ONS data
Business demography. The Business demography datasets present counts of enterprise births, deaths and survival by geography and classification. The data is produced using the guidelines found in the Eurostat and OECD manual on Business demography.
Eurostat
Eurostat Business Demography statistics present data on the active population of enterprises and their births, survivals and deaths for the member states of the EU.
Other government departments
Department for Business, Energy and Industrial Strategy: The Enterprise and Economic Development Analytical Unit at the Department for Business, Energy and Industrial Strategy, produces an annual National Statistics bulletin entitled Business Population Estimates (BPE). The BPE publication contains a breakdown of the number of businesses in the UK, from small traders with no employees to those with 500 or more employees by size classification. It also shows the contribution to total employment and turnover made by businesses of different sizes, with an industry breakdown. No single source is able to provide estimates of the total number of businesses in the UK. The BPE statistics include an estimate of the number of unregistered businesses, their employment and turnover. This estimate is represented in the zero employee size band.
Department for Finance and Personnel Northern Ireland (DFPNI): This contains information on businesses and the associated number of employees at a District Council Area and Northern Ireland level. UK and UK regional comparisons are also shown, as are comparisons with the Republic of Ireland.
The Scottish Government produces Scottish Economic Statistics, which provides an overview of Scottish economic development and prospects examined in the context of the UK, EU and global economies. It contains statistics and articles on Scotland's economy.
Stats Wales is a free-to-use service provided by the Welsh Government that allows visitors to view, manipulate, create and download tables from the most detailed official data on Wales.
Other business analyses from the IDBR are produced by HM Revenue and Customs in their Annual Report and by Companies House – The Registrar.
Back to table of contents12. References
Perry J (1995) The Inter-Departmental Business Register, in Economic Trends 505, November 1995, Office for National Statistics, HMSO: London
Office for National Statistics Business Monitor PA1003 – Analysis of UK Manufacturing (Local) Units by Employment Size, HMSO: London
Office for National Statistics PA1003 Size Analysis of United Kingdom Businesses, Office for National Statistics: Newport
Back to table of contents13. Appendix A: Former or abolished areas
Area codes operative from 1 January 2011.
County Durham Unitary Authority (UA) comprises the former districts of Chester-le-Street, Derwentside, Durham, Easington, Sedgefield, Teesdale and Wear Valley (abolished 2009).
Northumberland UA comprises the former districts of Alnwick, Berwick-upon-Tweed, Blyth Valley, Castle Morpeth, Tynedale and Wansbeck (abolished 2009).
Cheshire East UA comprises the former districts of Congleton, Crewe and Nantwich and Macclesfield (abolished 2009).
Cheshire West and Chester UA comprises the former districts of Chester, Ellesmere Port and Neston and Vale Royal (abolished 2009).
Shropshire UA comprises the former districts of Bridgnorth, North Shropshire, Oswestry, Shrewsbury and Atcham and South Shropshire (abolished 2009).
Bedford UA comprises the former district of Bedford (abolished 2009).
Central Bedfordshire UA comprises the former districts of Mid Bedfordshire and South Bedfordshire (abolished 2009).
Cornwall UA comprises the former districts of Caradon, Carrick, Kerrier, North Cornwall, Penwith and Restormel (abolished 2009).
The Isles of Scilly were recoded on 1 April 2009. They are separately administered by an Isles of Scilly council and do not form part of Cornwall UA but, for the purposes of the presentation of statistical data, they may be combined with Cornwall UA.
Wiltshire UA comprises the former districts of Kennet, North Wiltshire, Salisbury and West Wiltshire (abolished 2009).
14. Appendix B: UK Standard Industrial Classification
The differences between section letter UK Standard Industrial Classification 2003 (SIC 2003) and section letter UK SIC 2007 are presented in Table 5.
Table 5: Correspondence between section letter UK Standard Industrial Classification (SIC) 2003 and section letter UK SIC 2007
| UK SIC 2003 | UK SIC 2007 | ||
| A | Agriculture, hunting and forestry | A | Agriculture, forestry and fishing |
| B | Fishing | ||
| C | Mining and quarrying | B | Mining and quarrying |
| D | Manufacturing | C | Manufacturing |
| E | Electricity, gas and water supply | D | Electricity, gas, steam and air conditioning supply |
| E | Water supply, sewerage, waste management and remediation activities | ||
| F | Construction | F | Construction |
| G | Wholesale and retail trade; repair of motor vehicles, motorcycles and personal and household goods | G | Wholesale and retail trade; repair of motor vehicles and motor cycles |
| H | Hotels and restaurants | I | Accommodation and food service activities |
| I | Transport, storage and communications | H | Transport and storage |
| J | Information and communication | ||
| J | Financial intermediation | K | Financial and insurance activities |
| K | Real estate, renting and business activities | L | Real estate activities |
| M | Professional, scientific and technical activities | ||
| N | Administrative and support service activities | ||
| L | Public administration and defence; compulsory social security | O | Public administration and defence; compulsory social security |
| M | Education | P | Education |
| N | Health and social work | Q | Human health and social work activities |
| O | Other community, social and personal services activities | R | Arts, entertainment and recreation |
| S | Other service activities | ||
| P | Activities of private households as employers and undifferentiated production activities of private households | T | Activities of households as employers; undifferentiated goods and services activities of households for own use |
| Q | Extraterritorial organisations and bodies | U | Activities of extraterritorial organisations and bodies |
| Source: office for National Statistics | |||