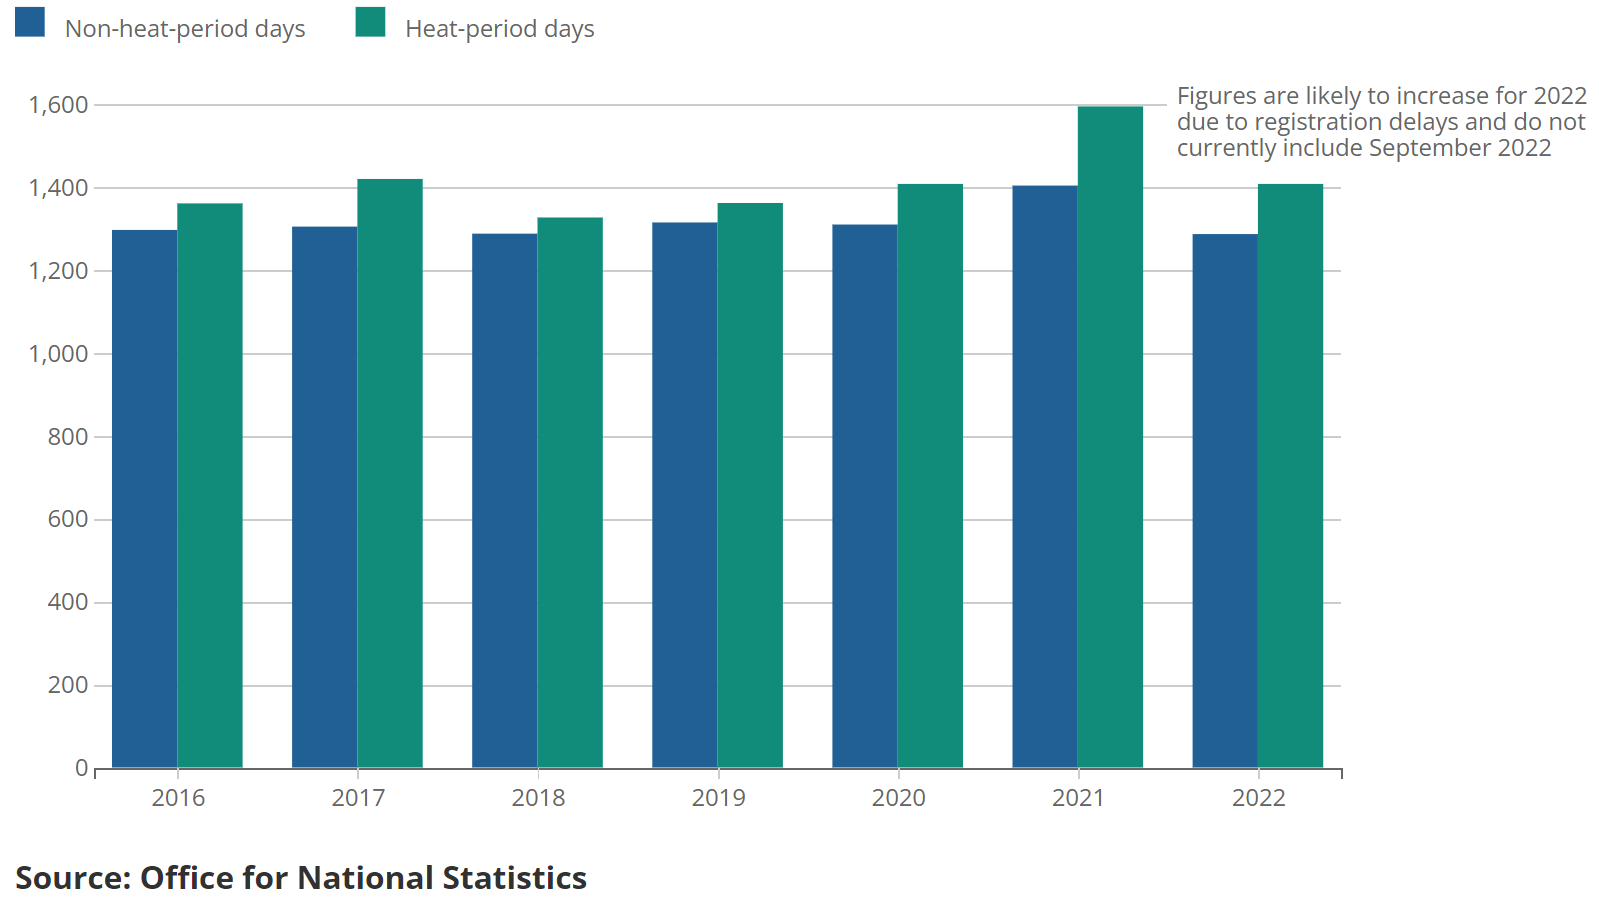
This bar chart shows average daily deaths on heat-period days and non-period days. In each year average daily deaths were higher for heat-period days. The data included in the chart is available to download below.