1. Main points
These admin-based outputs are initial research into the feasibility of using administrative data to measure labour market status.
Coverage is high, with 95% of individuals aged 16 years and over (on our population base) being assigned an admin-based labour market status (ABLMS).
Our lowest coverage (65.8% for males and 71.5% for females) is of individuals aged 17 years.
ABLMS produces higher counts of the "Employee", "Student" and "Retired" categories, and lower counts of the remaining categories compared with survey-based estimates.
The reference period length has potential to produce overestimation for the “In employment” category because of the priority rules used in ABLMS assignment.
This research shows the potential for ABLMS to produce estimates at a local authority level, though limitations of this measure prevent ABLMS from being fully produced at a lower level of geography.
Disclaimer
These outputs are the result of feasibility research using a methodology different to that currently used to produce labour market statistics. There are key differences in our methodology along with the limitations of administrative data, which impact their use in practice. They have limited use for policy or decision-making.
Back to table of contents2. About our transformation research
The Census 2021 topic consultation identifies a user need for small-area multivariate labour market (also called economic activity) statistics. While users noted the Annual Population Survey as a source of labour market statistics, these do not satisfy the needs highlighted in the consultation.
As a core objective of the Census and Data Collection Transformation Programme, our research investigates whether alternative data sources can produce census-like outputs at a low geography level. Using administrative data, this research derives a labour market status measure into 11 census-approximate categories.
The population base used is the admin-based population estimates (ABPE) V3.0 for 2016, which allows for record-level data linkage. Only individuals present on the ABPE are included in admin-based labour market status (ABLMS). Note that the ABPEs are also research outputs and do not replace the ONS mid-year population estimates.
The reference period used is the tax year ending 2016. This is the latest tax year that most data components required for the development and production of ABLMS are available.
Back to table of contents3. Producing admin-based labour market status
Admin-based labour market status (ABLMS) is produced using a different methodology to survey-based estimates. While our method is close to that used for regular labour market statistics, administrative data are collected for different purposes. As our method is in development, a multistage approach is used, allowing review of the method in each development phase.
First stage: producing the ABLMS source dataset
Administrative sources are processed and linked using anonymised identifiers to produce a linked administrative dataset.
This dataset is linked, using a unique identifier, to the population base that has been enriched with a full-time student indicator (derived from Higher Education Statistics Agency (HESA), English School Census (ESC) and Pupil Level Annual Schools' Census (PLASC) data).
Second stage: assigning high-level ABLMS
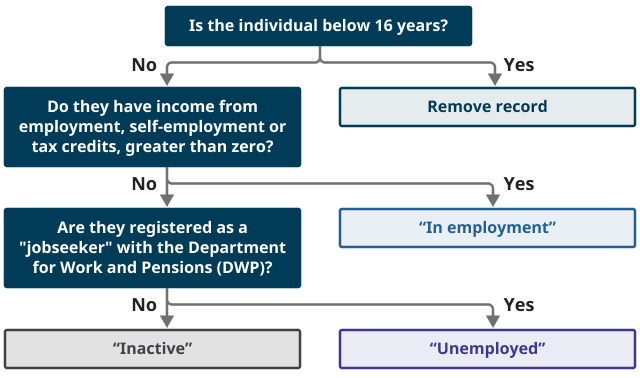
High-level ABLMS assigns a status of “In employment”, “Unemployed” and “Inactive” using priority rules from the International Labour Organization’s (ILO) training compendium on labour statistics.
The source dataset is filtered to people at or above the minimum age (16 years) used in the Office for National Statistics’ (ONS) labour market statistics.
If employee, self-employment1 or tax credit2 income is greater than zero, an “In employment” status is assigned.
If “In employment” is not assigned and the individual is considered a “Jobseeker” by the Department for Work and Pensions’ (DWP) client group3, an “Unemployed” status is assigned.
An “Inactive4” status is assigned to anyone not yet assigned a status.
Third Stage: assigning lower-level ABLMS
The ABLMS measure is created by breaking each high-level status down into labour market status subcategories.
Figure 1: Flow chart showing the high-level ABLMS assignment process
Source: Office for National Statistics
Download this image Figure 1: Flow chart showing the high-level ABLMS assignment process
.png (33.7 kB)
In employment
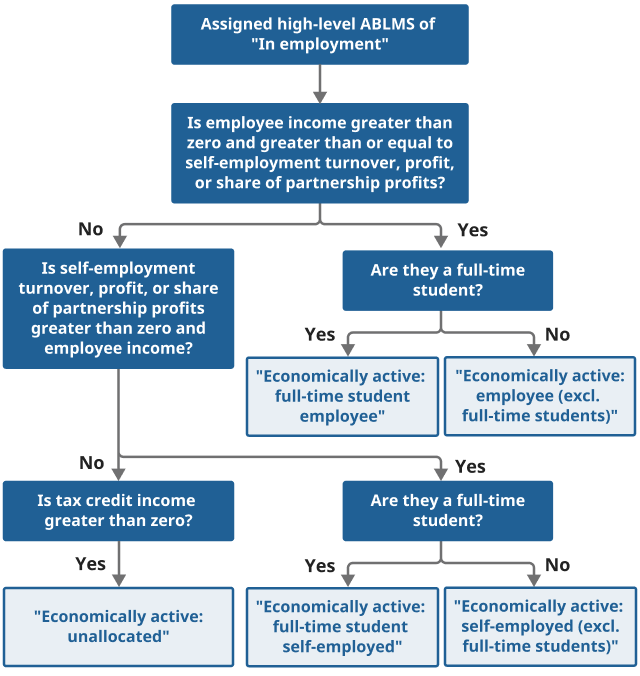
If employee income is greater than zero and greater than or equal to any self-employment income, ABLMS is assigned “Economically Active: Employee”; this category is split into “full-time students” and “excluding full-time students” using the full-time student indicator.
If self-employment income is greater than zero and greater than any employee income, ABLMS is assigned “Economically Active: Self-employed”; this is split into “full-time students” and “excluding full-time students” using the full-time student indicator. Profits and turnover are used to determine self-employed activity; this reduces the impact of any losses brought forward that could misrepresent the level of self-employment income received for that tax year.
Remaining “In employment” records are allocated “Economically Active: Unallocated”.
Figure 2: Flow chart showing how the high-level "In employment" status is broken down into low-level ABLMS components
Source: Office for National Statistics
Download this image Figure 2: Flow chart showing how the high-level "In employment" status is broken down into low-level ABLMS components
.png (67.6 kB)
Unemployed
Those with the “Unemployed” high-level status are assigned the “Economically Active: Unemployed” lower-level category. This is split into “full-time students” and “excluding full-time students” using the full-time student indicator.5
Figure 3: Flow chart showing how the high-level unemployed status is broken down into low-level ABLMS components

Source: Office for National Statistics
Notes:
Flow chart showing how the high-level unemployed status is broken down into low-level ABLMS components.
Download this image Figure 3: Flow chart showing how the high-level unemployed status is broken down into low-level ABLMS components
.png (20.4 kB)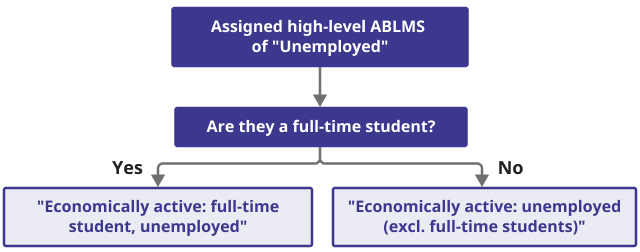
Inactive
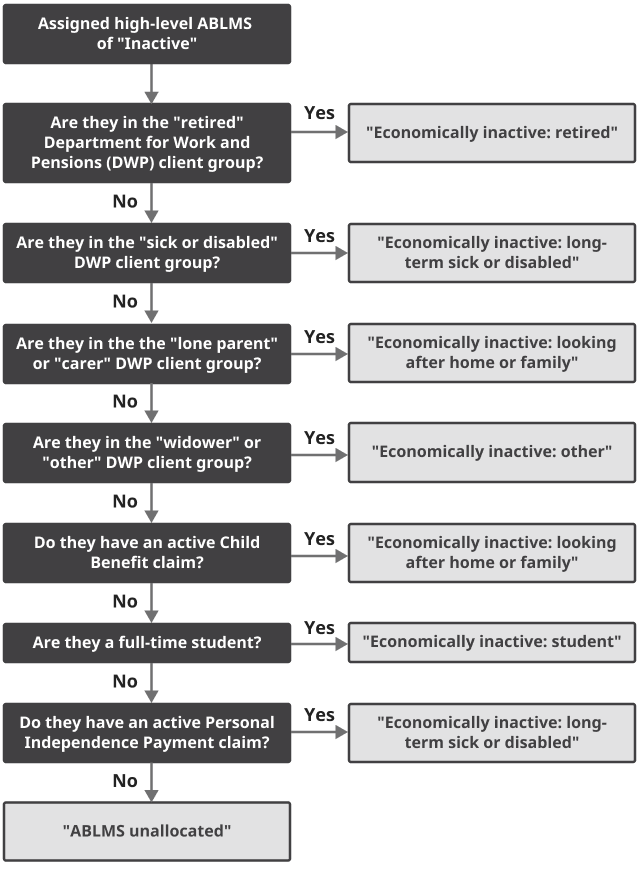
- If a category assignment in the DWP client group6 is present, a corresponding ABLMS is assigned:
- pensioner – ABLMS status is “Economically Inactive: Retired”
- sick or disabled ¬– ABLMS status is “Economically Inactive: Long-term sick or disabled”
- lone parent or carer – ABLMS status is “Economically Inactive: Looking after home or family”
- widower or other – ABLMS status is “Economically Inactive: Other”
- If a category assignment in the DWP client group is not present, ABLMS is assigned using activity in data sources:
- pensioner – ABLMS status is “Economically Inactive: Retired”
- active Child Benefit claim – ABLMS status is “Economically Inactive: Looking after home or family”
- full-time education (HESA, ESC, or PLASC) record – ABLMS status is “Economically Inactive: Student”
- Personal Independence Payment record – ABLMS status is “Economically Inactive: Long-term sick or disabled”
- If a category assignment in the DWP client group6 is present, a corresponding ABLMS is assigned:
employee or self-employed: the source of greater income is used and where the incomes are identical, the employee category is selected; this uses a tax-based definition and assigns ABLMS as employee because we assume the income has been duplicated and taxed at source through the Pay As You Earn (PAYE) system, which differs from an ILO-aligned method where the individual would make this decision.
multi-benefit claimants: ABLMS is assigned based on which client group DWP have assigned to the claimant.
Economically active (excluding full-time students), In Employment, Employee, Full/part-time – ABLMS equivalent: “Economically Active: Employee (excluding Full-time students)”.
Economically active (excluding full-time students), In Employment, Self-employed with/without employees, Full/part-time – ABLMS equivalent: “Economically Active: Self-employed (excluding Full-time students)”.
Economically active (excluding full-time students), Unemployed, Seeking work and ready to start in two weeks, Waiting to start a job already obtained and available to start within two weeks – ABLMS equivalent: “Economically Active: Unemployed (excluding Full-time students)”.
Economically active full-time students, In employment, Employee, Full/part-time – ABLMS equivalent: “Economically Active: Full-time student employee”.
Economically active full-time students, In employment, Self-employed with/without employees, Full/part-time – ABLMS equivalent: “Economically Active: Full-time student self-employed”.
Economically active full-time students, Unemployed, Seeking work and ready to start in two weeks, Waiting to start a job already obtained and available to start within two weeks – ABLMS equivalent: “Economically Active: Full-time student Unemployed”.
Economically inactive, Retired – ABLMS equivalent: “Economically Inactive: Retired”.
Economically inactive, Student – ABLMS equivalent: “Economically Inactive: Student”.
Economically inactive, Looking after home/family – ABLMS equivalent: “Economically Inactive: Looking after home or family”.
Economically inactive, Long-term sick/disabled – ABLMS equivalent: “Economically Inactive: Long-term sick or disabled”.
Economically inactive, Other – ABLMS equivalent: “Economically Inactive: Other”.
distinguishing between full or part-time workers for people assigned as employee or self-employed.
distinguishing between with or without employees for people assigned as self-employed.
including individuals seeking work and ready to start in two weeks, or individuals waiting to start a job already obtained and available to start within two weeks for people who would be assigned in Census 2021 as unemployed; individuals falling into these categories and not claiming JSA will not be included in the ABLMS unemployed category.
Self-employment income includes individuals completing a self-employment and/or partner schedule.
Tax credit income is used to identify the “In employment” category because of eligibility rules requiring a person to work a minimum number of hours per week.
Client group variable derived by DWP using the legacy benefit system.
See Glossary section for definitions of labour market status terms.
While most full-time students would not be eligible for Jobseeker's Allowance (JSA) this category will include people who have left full-time education, began claiming JSA and not entered the workforce in the reference tax year.
See Glossary for further information relating to the DWP client group.
Figure 4: Flow chart showing how the high-level inactive status is broken down into low-level ABLMS components
Source: Office for National Statistics
Download this image Figure 4: Flow chart showing how the high-level inactive status is broken down into low-level ABLMS components
.png (80.2 kB)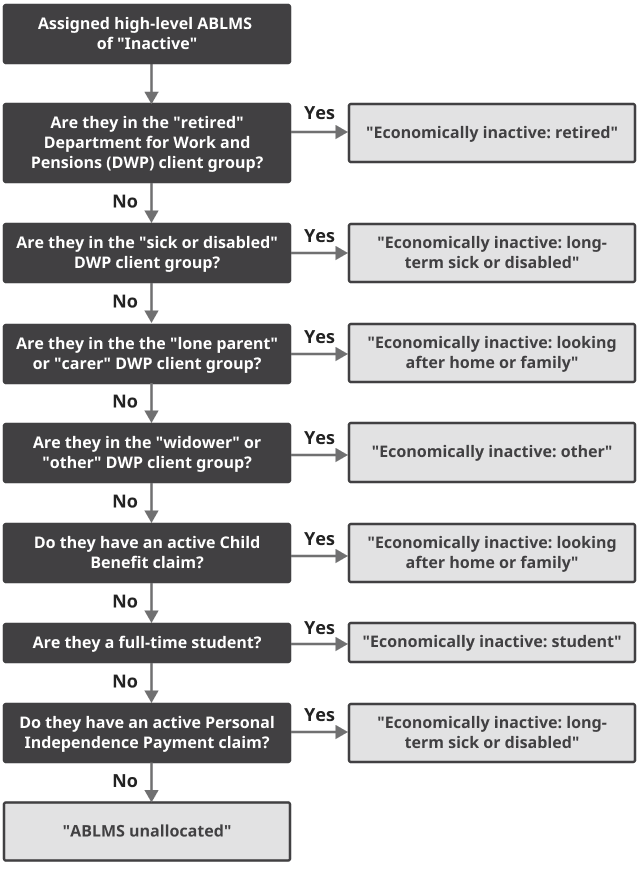
How this method differs from survey-based estimates of labour market status
Reference period length
The reference period used to assign admin-based labour market status (ABLMS) is the tax year ending 2016. A tax year is the shortest period currently available in HM Revenue and Customs (HMRC) Self Assessment data. This differs from the guidelines set out by the International Labour Organisation (ILO), which recommends using a short reference period such as one week or day.
Given labour market statuses can change within a tax year, we expect the reference period length to impact ABLMS. For example, current survey-based estimates use a week reference period. If a respondent were unemployed in this reference week but employed at another point in the ABLMS reference year, using the ILO priority rules (page 24) ABLMS would assign them to “In Employment”, while survey-based methods would assign them to ”Unemployed”.
This shows there is potential for ABLMS methods to overestimate the “In employment” category when using longer reference periods. The future developments section covers how we propose to address this.
Assigned or self-reported status
The Labour Force Survey (LFS, used for current labour market statistics) asks respondents to self-report their employment. The ABLMS method assigns a status using administrative data alone, without input from the related individual. This can lead to more than one potential status, such as when an individual has both employee and self-employment income, or is claiming various kinds of benefits as their only source of income. To assign ABLMS in these scenarios the following conditions are used:
These are our working assumptions needed to develop our initial method. The accuracy of these assumptions is yet to be investigated to confirm their validity in these scenarios.
Unemployment
The ILO defines unemployment as those who are not in employment, are seeking work and are available to start work. Currently we cannot meet this definition as we cannot capture people’s intentions and ability to work using the available administrative data.
LFS questions (used for current labour market statistics) are designed to meet ILO definitions, whereas administrative data are not. A comparison of labour market data sources carried out by the ONS explains the advantages and limitations of administrative data in measuring individual labour market statuses. It also highlights the differences between jobseeker’s allowance (JSA) claimant count taken from administrative data and the ILO-aligned unemployment definition in surveys.
The reference period length used in ABLMS means our unemployment definition is people who have been claiming JSA and have not received any form of employment income within the tax year. This definition does not capture those who are short-term unemployed or those not claiming JSA.
Future work can explore whether restricting the reference period to within the tax year could bring our administrative-based measure of unemployment more in line with the ILO definition.
How well does ABLMS approximate Census 2021?
ABLMS is designed to approximate Census 2021 economic activity categories (labour market status) using the administrative data available.
Census 2021 economic-activity statuses and ABLMS equivalents
Some elements of the Census 2021 economic activity categories, because of the nature of administrative data, cannot be captured in ABLMS. These are:
Notes for: Producing admin-based labour market status
4. Analysis of admin-based labour market status
The methodology in this publication has been developed to be our closest approximation of the Census 2021 categories. For analysis, data from the Annual Population Survey (APS) are used to provide a survey-based proxy estimate we would expect to obtain if the Census 2021 was conducted in the tax year ending 2016. Aggregate comparisons are made between admin-based labour market status (ABLMS) and APS estimates.
Confidence intervals could not be produced for the survey-based estimates, so caution should be taken when interpreting differences.
To avoid misrepresentation of small groups, some categories have been grouped in the results:
“Economically Active: Full-time student employee” and "Economically Active: Full-time student self-employed" have been grouped into “Economically Active: Student”
“Economically Active: Full-time student unemployed” has been added into “Economically Active: Unemployed”
Identifying how well we can assign admin-based labour market status
Figure 5: Percentage of individuals assigned an ABLMS remains at or above 90% from age 20
Percentage of individuals with an assigned ABLMS, England and Wales, tax year ending 2016
Source: Office for National Statistics
Download this chart Figure 5: Percentage of individuals assigned an ABLMS remains at or above 90% from age 20
Image .csv .xls94.9% of individuals aged 16 years and over (in our admin-based population estimates (ABPE)) have an assigned ABLMS, while 5.1% of individuals have an “Unallocated” assignment. Coverage for women is higher (95.4%) than for men (94.3%).
Coverage is lower for individuals aged 16 to 20 years, dipping at age 17 years (men 65.8% and women 71.5%). We attribute this decrease to individuals being in a transition period, having moved from school to further education (where we have a gap in available data) or having transitioned out of education and not yet into employment or claiming benefits.
Coverage stabilises from age 20, staying at 90% or above with proportions similar in men and women. Coverage rises slightly at state pension age because of the inclusion of state pension in ABLMS. State pension age was 63 years for women and 65 years for men in the tax year ending 2016.
Figure 6: Coverage by Lower Layer Super Output Area (LSOA) is high
Percentage of individuals with an assigned ABLMS by LSOA, England and Wales, tax year ending 2016
Source: Office for National Statistics
Download this chart Figure 6: Coverage by Lower Layer Super Output Area (LSOA) is high
Image .csv .xlsCoverage at LSOA level is high, with at least 90% of individuals within an LSOA being assigned an ABLMS in more than 99% of LSOAs.
Despite this, coverage varies by geography, with some LSOAs having coverage rates below 70%. Research ruled this out as being LSOAs with a higher proportion of residents under the age of 18 years, who are known to have the highest proportion of unallocated records. These LSOAs are, however, all located in built-up urban areas, including London, Liverpool, Birmingham, and Oxford.
These coverage figures must be interpreted within the context of the known definitional differences in the ABLMS measure and undercovereage in the population base.
What admin-based labour market status can tell us about our population
Figure 7: “Economically Active” statuses increase from 16 to 17 years to 25 to 34 years and decrease from 50 to 64 years
Percentage of individuals assigned to each lower-level ABLMS by age group, England and Wales, tax year ending 2016
Embed code
Download the data
ABLMS broken down by age group shows the population transitioning in and out of the workforce. “Economically Active” statuses increase from the age group 16 to 17 years to 25 to 34 years and then start decreasing from the age group 50 to 64 years. The opposite is seen with “Economically Inactive” statuses.
Proportions of ABLMS “Unallocated” and “Economically Inactive: Student” are high for the 16 to 17 years age group; they reduce from 18 to 24 years age group onwards, supporting the theory that it relates to the transition out of full-time education.
Figure 8: “Economically Inactive: Looking after home or family” has the most noticeable sex difference, followed by “Economically Active: Unallocated” and “Economically Active: Unemployed”
Lower-level ABLMS assignment by sex, men and women aged 16 years and over, England and Wales, tax year ending 2016
Embed code
Download the data
The largest difference in proportions of sex is seen in “Economically Active: Looking after home or family”, with 79% of records assigned to women. This category is partly determined by Child Benefit receipt, which was claimed predominantly by women (88%) in our reference period. This helps explain the uneven sex proportion for this status; however, further research is needed to fully understand this trend.
Similarly, 69% of “Economically Active: Unallocated” records are assigned to women. Such records are reliant on working tax credit, where 64% was paid to women in our reference period.
“Economically Active: Students” and “Economically Inactive: Retired” are similarly assigned to a higher proportion of women. Mid-year population estimates for 2016, England and Wales, showed the same sex split (43% males, 57% females) in people at or above state pension age; this likely explains what we see in “Economically Inactive: Retired”.
There is a higher proportion of men (70%) in the “Economically Active: Unemployed” category. Men also showed higher proportions in “Economically Active: Self-Employed”, and “Economically Inactive: Sick or disabled”. It is currently unknown why this is the case; further research is needed to explore this.
How ABLMS compares with survey-based estimates
Figure 9: APS estimates a higher proportion of individuals for all but four lower-level categories
ABLMS and aligned APS estimates by lower-level labour market status, England and Wales, tax year ending 2016
Embed code
Download the data
Figure 9 shows ABLMS produces a higher proportion for the “Economically Active (Excluding full-time students): Employee” and “Economically Active: Unallocated” categories when compared with APS estimates. We attribute these differences to the ABLMS assignment priority rules potentially overestimating the high-level “In employment” category.
Similar proportions are produced for “Economically Inactive: Retired” and “Economically Active: Student”, while APS estimates are higher for the remaining categories.
Figure 10: Percentage point difference is highest among the “Economically Active: Employee” and “Economically Active: Self-Employed (Excluding full-time students)” categories
Percentage point difference between ABLMS and APS estimates of labour market status by lower-level labour market status, England and Wales, tax year ending 2016
Embed code
Download the data
Figure 10 shows the percentage point difference between the measuers of labour market status (negative results show APS estimates are greater than ABLMS). The largest differences are seen in the “Economically Active: Employee (Excluding full-time students)”, “Economically Active: Self-Employed (Excluding full-time students)”, and “Economically Inactive: Looking after home or family” categories.
We attribute the differences shown in both figures to how this method differs from survey-based estimates of labour market status. For example, if we look at employee versus self-employed, it is plausible that ABLMS is assigning people as an employee because they have Pay As You Earn (PAYE) income. However, if asked in a survey, they may report as self-employed because they own and are the director of the business they are employed by.
Similar explanations could apply to other categories, although we believe the difference in reference period also has an impact here. The results shown for ABLMS unemployment (claimant count) imply low unemployment, which is not the case when compared with the survey-based estimates. We need to investigate this further before practical applications can be considered.
How ABLMS compares with survey-based estimates for your local area
Figure 11: ABLMS can assign the same or more categories than APS at local authority level
ABLMS and aligned APS estimates searchable by local authority, England and Wales, tax year ending 2016
Embed code
Download the data
For all local authorities (LAs), our administrative data-based methods can assign labour market status for all 11 low-level ABLMS categories shown. The survey-based estimates vary in the number of categories they can allocate, with estimates produced for four or more categories per LA in the tax year ending 2016.
We attribute this difference in granularity to LA sample sizes in the APS. Looking at the ABLMS allocations, 54% of LAs were assigned additional labour market categories when compared with the corresponding APS estimates. ABLMS also produced labour market allocations for an area hard to capture by survey because of its small population (the Isles of Scilly), where no responses were captured in the APS data for our reference period.
Our research showed promise in producing status allocations at LSOA level for the “In employment” and “Inactive” high-level ABLMS categories. However, because of low counts and associated statistical disclosure risks, we are unable to produce the high-level ABLMS “Unemployed” category or lower-level ABLMS, limiting their use.
Back to table of contents5. Glossary
Definitions for terms used in regular labour market statistics can be found in the ONS’ Guide to labour market statistics.
Economically Active (admin-based labour market status (ABLMS))
People aged 16 years and over who are either in employment or unemployed.
Economically Active (excluding Full-time students): Employee
People who have an employee income which is either the same or greater than self-employed income (if any) and are not in full-time education.
Economically Active (excluding Full-time students): Self-employed
People who have a self-employment income greater than employee income (if any) and are not in full-time education.
Economically Active (excluding Full-time students): Unemployed
People who are identified as a job seeker by Department for Work and Pensions (DWP) in receipt of an active jobseeker’s allowance (JSA) claim within the reference year, who have no employee or self-employment income and are not in full-time education.
Economically Active: Full-time student employee
People who have an employee income which is either the same or greater than any self-employed income (if any) and are in full-time education.
Economically Active: Full-time student self-employed
People who have a self-employment income greater than employee income (if any) and are in full-time education.
Economically Active: Full-time student unemployed
People who are identified as a job seeker by DWP in receipt of an active JSA claim within the reference year, who have no employment income and are in full-time education.
Economically Active: Unallocated
People who are in receipt of an employment benefit with requirement to be in some form of employment, but no data are available to distinguish between employee or self-employed.
Economically Inactive (ABLMS)
People aged 16 years and over who are neither an employee, self-employed or classified as a job seeker in DWP data.
Economically Inactive: Retired
People who have a retired DWP indicator or sole income in Pay As You Earn (PAYE) from an identified pension.
Economically Inactive: Student
People who are without employee or benefit income but have an active Higher Education Statistics Agency (HESA), English School Census (ESC) or Pupil Level Annual Schools' Census (PLASC) record.
Economically Inactive: Looking after home or family
People who have a lone parent or carer DWP indicator or people whose only source of income is from Child Benefit.
Economically Inactive: Long-term sick or disabled
People who have a sick or disabled DWP indicator or people who are without any form of employment income but in receipt of an active Personal Independence Payment (PIP) claim.
Economically Inactive: Other
People who have DWP status indicators without an equivalent Census status such as “Widower” or “Other”.
ABLMS Unallocated
People who cannot be assigned a lower-level ABLMS status because of no available data.
Reference period
The time period the data relate to and ABLMS is assigned for. For this article, the reference period is the tax year ending 2016.
DWP client group
A category assignment made by DWP based on the type of benefit(s) claimed by a person. This represents the client group assigned at the end of the benefit claim, or the start of the claim if it is ongoing. Where a person has overlapping claims, the client group is assigned in the following hierarchy:
- Pensioner
- Jobseeker
- Sick and Disabled
- Lone Parent
- Carer
- Widower
- Other
For example, if an individual is in receipt of PIP and JSA, their client group variable would be assigned as Jobseeker rather than Sick and Disabled.
This assignment is made by DWP using the legacy benefit system. Further work is needed to understand how we could use universal credit to replace legacy benefits in future ABLMS development.
Back to table of contents6. Data sources and quality
Department for Work and Pensions (DWP) benefits data
DWP benefits data contain datasets relating to benefit types claimed by a person and a client group classification assigned by DWP. These data are used to assign “Economically Inactive” subcategories.
These datasets are:
- DWP National Benefits Database (NBD)
- HM Revenue and Customs (HMRC) Tax Credits
- HMRC Child Benefit
HMRC Pay As You Earn (PAYE) Real Time Information (RTI)
HMRC PAYE RTI contains data at a transactional level for employment and pension payments recorded in the PAYE system. These data are used to identify if a person is employed or retired.
HMRC Self Assessment
HMRC Self Assessment data contain information relating to income tax returns for individuals and partnerships. We use these data to identify the self-employed and have published research describing how we derive this measure of self-employment income using Self Assessment data.
Higher Education Statistics Agency (HESA)
HESA data contain information relating to students studying at higher education institutions. We use these data to identify if a student is in full-time education.
English School Census (ESC)
The ESC is an electronic collection of pupil- and school-level data provided by all local authority maintained primary, secondary, nursery and special schools in England each year. We use these data to identify full-time students.
Pupil Level Annual Schools' Census (PLASC)
PLASC is an electronic collection of pupil and school level data provided by all Local Authority-maintained primary, middle, secondary, nursery and special schools in Wales each year. We use these data to identify full-time students.
Quality
We aim to provide users of this publication with an evidence-based assessment of its quality and the quality of the data from which it is produced, to show our commitment to complying with the UK Statistics Authority’s Code of Practice for Statistics.
The quality of the population base will impact the quality of the admin-based labour market status (ABLMS) outputs. More information about the coverage and quality of the population base is available here: Population and migration statistics system transformation – recent updates: evaluating coverage and quality in the admin-based population estimates.
Linkage when creating ABLMS uses a deterministic approach via unique identifiers present in the anonymised administrative data used. Quality of this linkage is dependent on the quality of the unique identifier recorded at source by the data supplier.
74% of records from the administrative data sources were linked to our population base (admin-based population estimates) via a unique identifier. There were around 14 million records, which could not be matched, either because these people were not part of our population base, or a link could not be made using the unique identifiers. There is potential for future work to explore this further.
Back to table of contents7. Future developments
This research shows there is potential to produce labour market status down to local authority level from administrative data. However, there are key differences in how we assign admin-based labour market status (ABLMS) compared with survey-based measures where improvements could be made, such as by:
exploring the possibility of restricting the reference period to within a tax year, to bring ABLMS more in line with the International Labour Organisations’ (ILO) definition “within a short reference period”
updating the analysis reference period to a more current year, to allow comparison with the Census 2021 and explore the impact of the coronavirus (COVID-19) pandemic on admin-based measures
comparing survey responses against ABLMS assignment for dealing with potential multiple status assignments
incorporating Department for Work and Pensions (DWP) universal credit data and investigate whether the additional information available from this source could improve the ABLMS measure of unemployment.
assessing the quality of the ABLMS input and output data sources in line with the UK Statistics Authority’s Code of Practice for Statistics and European Standard for Quality Reports
exploring the potential for alternative data sources to better understand the cases where an ABLMS category could not be assigned
exploring the use of imputation to resolve missing data in administrative sources
conducting further geographical analysis of ABLMS coverage to better understand why coverage differs across Lower Layer Super Output Areas (LSOAs).
We are inviting feedback on our research into producing an admin-based labour market status (Admin.Based.Characteristics@ons.gov.uk) and will continue to review this as we further develop our research.
Back to table of contents