Table of contents
1. Main points
Owner occupiers’ housing costs (OOH) in the UK according to rental equivalence approach have grown by 1.1% in Quarter 2 (Apr to June) 2018 compared with the corresponding quarter of the previous year.
OOH according to the net acquisitions approach have grown by 3.5% in Quarter 2 2018 compared with the corresponding quarter of the previous year.
OOH according to the payments approach experienced growth of 2.7% in Quarter 2 2018 compared with the corresponding quarter of the previous year.
2. Things you need to know about this release
Owner occupiers’ housing costs (OOH) are the costs of housing services associated with owning, maintaining and living in one’s own home. This is distinct from the cost of purchasing a house, which is partly for the accumulation of wealth and partly for housing services.
In this article, we focus on three approaches to measuring OOH: payments, rental equivalence and net acquisitions, and evaluate the performance of the different measures over time, in prevailing economic conditions. The series will be updated on a quarterly basis. We invite you to submit feedback on this release to cpi@ons.gov.uk.
The first article in the series provides more information about the different approaches to measuring owner occupiers’ housing costs to aid your understanding of the differences in concept and underlying methodology. There have also been a number of “Spotlight” sections produced, which focus in on a particular topic. For a list of subjects covered, please see Annex 1. We will continue to produce these Spotlights as and when there is need.
Two methodological changes to the payments approach to measuring OOH have been made to improve consistency. These changes have been incorporated into this article. The first methodological change is that the calculation of the sub-indices of three components of OOH(payments) now use the Jevons formula rather than the Carli formula. This change is consistent with the calculation of the other components of OOH(payments). The second methodological change is that Council Tax has been removed from within the OOH(payments) index to become its own component within the “housing, water, electricity, gas and other fuels” category. That is, Council Tax and OOH(payments) now sit alongside each other within the ”housing, water, electricity, gas and other fuels” category. This methodological change is in line with headline Consumer Prices Index including owner occupiers’ housing costs (CPIH), which uses the rental equivalence approach. The impact of these two methodological changes on the series is small. The Spotlight section in this article provides more details on the two methodological changes and assesses their impact over the series from Quarter 1 (Jan to Mar) 2005 to Quarter 2 (Apr to June) 2018.
You should note that the payments approach and net acquisitions are both experimental indices and therefore we would caution against any use other than for research purposes. More information on the methodology for each approach can also be found in the CPIH compendium.
Back to table of contents3. Results
Figure 1 presents the cumulative indices for each approach and Figure 2 shows the year-on-year quarterly growth rates. These figures take into account the methodological changes to OOH(payments) discussed previously. Figure 1 shows that the index for owner occupiers’ housing costs (OOH)(payments) has been consistently lower than the net acquisitions (NA) and rental equivalence (RE) approaches since Quarter 1 (Jan to Mar) 2009.
The year-on-year quarterly growth rate of OOH(NA) increased by 0.4 percentage points in Quarter 2 (Apr to June) 2018 to 3.5%. This is the highest growth rate of OOH(NA) since Quarter 4 (Oct to Dec) 2010. The year-on-year quarterly growth rate of OOH(payments) was 2.7% in the second quarter of 2018. The year-on-year quarterly growth rate of OOH(RE) was 1.1% in Quarter 2 2018 – the lowest since Quarter 1 2011. In the last two quarters, the difference between the growth rates of OOH(NA) and OOH(payments) diminished.
Figure 1: OOH rental equivalence (RE), OOH net acquisitions (NA) and OOH (payments) indices
UK, Quarter 1 (Jan to Mar) 2005 to Quarter 2 (Apr to June) 2018
Source: Office for National Statistics
Notes:
- Q1 refers to Quarter 1 (Jan to Mar); Q2 refers to Quarter 2 (Apr to June); Q3 refers to Quarter 3 (July to Sept); and Q4 refers to Quarter 4 (Oct to Dec).
Download this chart Figure 1: OOH rental equivalence (RE), OOH net acquisitions (NA) and OOH (payments) indices
Image .csv .xls
Figure 2: OOH rental equivalence (RE), OOH net acquisitions (NA) and OOH (payments) quarter on corresponding quarter of previous year growth rate
UK, Quarter 1 (Jan to Mar) 2006 to Quarter 2 (Apr to June) 2018
Source: Office for National Statistics
Notes:
- Q1 refers to Quarter 1 (Jan to Mar); Q2 refers to Quarter 2 (Apr to June); Q3 refers to Quarter 3 (July to Sept); and Q4 refers to Quarter 4 (Oct to Dec).
Download this chart Figure 2: OOH rental equivalence (RE), OOH net acquisitions (NA) and OOH (payments) quarter on corresponding quarter of previous year growth rate
Image .csv .xls4. What are the main contributions to these results?
This section shows which components are contributing the most to the year-on-year quarterly growth rate for the payments approach (payments) and the net acquisitions approach (NA). Because of the methodology used to calculate the owner occupiers’ housing costs the rental equivalence approach of owner occupiers’ housing costs – OOH(RE) – it is not possible to present a contributions chart for this approach. This is mainly because OOH(RE) is not constructed using a set of sub-indices that measure different concepts (for example, maintenance costs and Stamp Duty), but instead is aggregated from indices measuring the same concept across regions.
Payments approach
There have been revisions to the payments approach to improve its consistency with CPIH. The Spotlight section of this article provides more details on these methodological changes.
Figure 3 presents the contributions of the OOH(payments) sub-indices to the quarterly growth rate of OOH(payments). Mortgage interest payments contributed 1 percentage point to the quarterly growth rate of OOH(payments) in Quarter 2 (Apr to June) 2018. Major repairs and maintenance made a positive contribution for the first time since Quarter 3 (July to Sept) 2016, with a contribution of 0.2 percentage points in Quarter 2 2018. The contribution of Stamp Duty was 0.3 percentage points in Quarter 2 2018. The largest category, "other", was mainly accounted for by "dwelling insurance".
Figure 3: Contributions to year-on-year quarterly growth rate of OOH (payments) from component sub-indices
UK, Quarter 2 (Apr to June) 2018
Source: Office for National Statistics
Notes:
Contributions may not sum due to rounding. Other includes dwelling insurance, ground rent, estate agent fees, home-buyers survey and house conveyancing.
Q1 refers to Quarter 1 (Jan to Mar); Q2 refers to Quarter 2 (Apr to June); Q3 refers to Quarter 3 (July to Sept); and Q4 refers to Quarter 4 (Oct to Dec).
Download this chart Figure 3: Contributions to year-on-year quarterly growth rate of OOH (payments) from component sub-indices
Image .csv .xlsNet acquisitions approach
Figure 4 shows the contributions of the OOH(NA) sub-indices to the year-on-year quarterly growth rate of OOH(NA) in Quarter 2 2018. New dwellings remained the largest contributor to the quarterly growth rate of OOH(NA) with a contribution of 2.6% – its largest contribution since Quarter 3 2010. The components “existing dwellings new to households” and “other services related to ownership of dwellings” are not included due to lack of data and therefore contribute 0 percentage points.
Figure 4: Contributions to the year-on-year quarterly growth rate of OOH net acquisitions (NA) from component sub-indices
UK, Quarter 2 (Apr to June) 2018
Source: Office for National Statistics
Notes:
Contributions may not sum due to rounding. New Dwellings includes self-builds and renovations and the acquisition of new dwellings.
Q1 refers to Quarter 1 (Jan to Mar); Q2 refers to Quarter 2 (Apr to June); Q3 refers to Quarter 3 (July to Sept); and Q4 refers to Quarter 4 (Oct to Dec).
Download this chart Figure 4: Contributions to the year-on-year quarterly growth rate of OOH net acquisitions (NA) from component sub-indices
Image .csv .xls5. Different approaches to measuring owner occupiers’ housing costs (OOH)
The rental equivalence approach – OOH(RE) – uses the rent paid for an equivalent house as an estimate of the cost of housing services that are consumed. In other words, we value housing services by looking at the cost of the next best alternative to home ownership, namely renting a property. Importantly, OOH(RE) does not capture changes in asset value; rather it measures the change in price of housing services provided.
The payments approach – OOH(payments) – aims to measure the payments related to the ownership of owner occupied housing. This means that all payments that households make as owner occupiers when consuming housing should be included, such as mortgage interest payments, transaction costs and running costs.
OOH(payments) is not our favoured method to measuring owner occupiers’ housing costs (OOH) in the Consumer Prices Index including owner occupiers’ housing costs (CPIH). This is because a consumer price index aims to measure consumption and interest payments represent the cost of borrowing money rather than the cost of consumption. However, OOH(payments) is our preferred measure for the Household Costs Indices (HCIs), which depart from consumption principles, and aim to capture households’ experience of changing prices and costs. For more information about the HCIs please see the article Developing the Household Costs Indices (HCIs).
The net acquisitions approach – OOH(NA) – aims to measure the costs of acquiring a house with household to household transactions netted off. The approach theoretically treats a home as the purchase of a good that is part asset (the land) and part consumable (the house) and excludes the land component from the index. OOH(NA) also includes costs associated with buying and maintaining a house; for example, self-builds and renovations, repairs and maintenance, transfer costs and dwelling insurance.
In practice, while the measure presented here is the best measure of OOH(NA) that we can currently produce, the lack of available source data means that some components are not recorded fully. We therefore advise that OOH(NA) should be used and referred to with caution and it is consequently not our favoured approach of measuring OOH in the Consumer Prices Index including owner occupiers’ housing costs (CPIH).
Table 1 shows the components of these different approaches. For more information about each please see the CPIH compendium or the first article in this series.
Table 1: Components of the three approaches of measuring owner occupiers' housing
| Rental equivalence | Payments | Net acquisitions | ||
|---|---|---|---|---|
| Imputed rents | Mortgage interest payments | Acquisition of new dwellings | ||
| Dwelling insurance | Self-builds and renovations | |||
| Ground rent | Existing dwellings new to the OOH sector | |||
| Stamp duty | Services related to acquisition | |||
| Estate agent fees | Major repairs and maintenance | |||
| Home-buyers survey | Insurance connected with the dwelling | |||
| Major repairs and maintenance | Other services related to ownership of dwellings | |||
| House conveyancing | ||||
| Source: Office for National Statistics | ||||
Download this table Table 1: Components of the three approaches of measuring owner occupiers' housing
.xls (33.3 kB)6. Spotlight: changes to methodology of the OOH(payments) approach
This spotlight explains the two methodological changes to the construction of owner occupiers’ housing costs OOH(payments). It also assesses their effect over the series from Quarter 1 (Jan to Mar) 2005 to Quarter 2 (Apr to June) 2018. If you have any feedback on these changes please email cpi@ons.gov.uk.
Methodology changes from Carli to Jevons formula
OOH(payments) is aggregated together using the relevant components from the Retail Prices Index (RPI) in addition to indices that capture changes in payments of Stamp Duty and “major repairs and maintenance” (see Annex 1A of the first publication for more information). The indices for these components can be calculated from the individual price quotes using index formulae. The RPI mainly uses the Carli and Dutot formulae, whereas the Consumer Prices Index including owner occupiers’ housing costs (CPIH) and Consumer Prices Index (CPI) use the Jevons formula in place of the Carli. In light of evidence summarised in the “Shortcomings of the Retail Prices Index as a measure of inflation”, the ONS view is that the Carli formula is not a suitable method and using it is likely to result in an upward bias to measures of inflation.
Until this release, the index formulae used to calculate OOH(payments) was a mixture of Carli and Dutot indices, from the RPI indices that were used as inputs. For consistency with the other measures of OOH, we have now changed the Carli formula to the Jevons formula. This has affected three sub-components: "dwelling insurance", "home-buyers survey" and "house conveyancing". This means that components of OOH(payments) no longer use the Carli formula, in line with best practice. The "dwelling insurance", "home-buyers survey" and "house conveyancing" sub-indices are aggregated within the “other” category published in the accompanying tables.
Figure 5 shows the year-on year quarterly growth rate of OOH(payments) with and without changes to the methodology used to calculate the dwellings insurance, home-buyers survey and house conveyancing sub-indices. Changing the methodology from the Carli formula to the Jevons formula causes the year-on-year quarterly growth of OOH(payments) to be lower than previously estimated, as expected from the mathematical properties of the Carli index. However, the decrease is small, ranging from 0 to 0.1 percentage points on a quarterly basis.
Figure 5: 12-month growth rate of OOH(payments) when the “dwelling insurance”, “home-buyers survey” and “house conveyancing” sub-indices change from Carli to Jevons
UK, Quarter 1 (Jan to Mar) 2006 to Quarter 2 (Apr to June) 2018
Source: Office for National Statistics
Notes:
- Q1 refers to Quarter 1 (Jan to Mar); Q2 refers to Quarter 2 (Apr to June); Q3 refers to Quarter 3 (July to Sept); and Q4 refers to Quarter 4 (Oct to Dec).
Download this chart Figure 5: 12-month growth rate of OOH(payments) when the “dwelling insurance”, “home-buyers survey” and “house conveyancing” sub-indices change from Carli to Jevons
Image .csv .xlsRemoving Council Tax from OOH(payments)
When calculating our headline measure of CPIH, Council Tax and OOH sub-indices are aggregated along with the other sub-indices to produce the indices for the “housing, water, electricity, gas and other fuels” category. This category is one of the 12 categories that is then aggregated to create our headline CPIH, which uses the rental equivalence approach. However, when calculating CPIH(payments), Council Tax was previously included as a component of OOH(payments). To improve consistency with our headline CPIH, Council Tax will now be removed from within OOH(payments) and become its own component within the “housing, water, electricity, gas and other fuels” category. Figure 6 summarises the change in aggregation structure for this category in CPIH(payments). The “After” structure is consistent with how Council Tax is treated in the headline measure of CPIH, using rental equivalence.
Figure 6: Aggregation structure for the "housing, water, electricity, gas and other fuels" in CPIH(payments), before and after the change to Council Tax
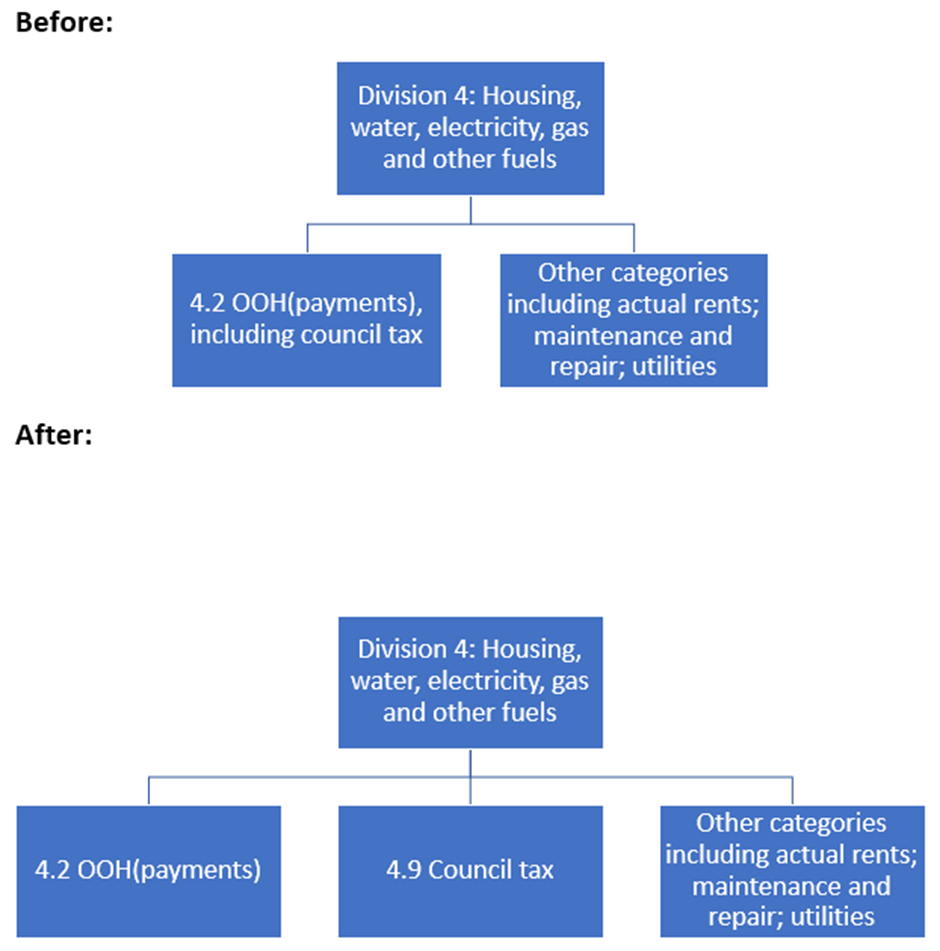
Source: Office for National Statistics
Download this image Figure 6: Aggregation structure for the "housing, water, electricity, gas and other fuels" in CPIH(payments), before and after the change to Council Tax
.png (185.4 kB)
Figure 7 shows the year-on-year quarterly growth rate of OOH(payments) with and without Council Tax when the Carli formula is used to calculate the dwellings insurance, home-buyers survey and house conveyancing sub-indices. This enables us to isolate the effect of relocating Council Tax from within OOH(payments) to sit alongside OOH(payments).
Figure 7 shows that the greatest effects of the change to Council Tax are in 2007 and 2009. This is when Council Tax contributed the most to CPIH(payments). After 2010, the quarterly growth rate of OOH(payments) became more stable in comparison to earlier years. This has meant that the OOH(payments) approach with and without Council Tax remain much closer than in earlier years.
Figure 7: 12-month growth rate of OOH(payments) with and without Council Tax
UK, Quarter 1 (Jan to Mar) 2006 to Quarter 2 (Apr to June) 2018
Source: Office for National Statistics
Notes:
- Q1 refers to Quarter 1 (Jan to Mar); Q2 refers to Quarter 2 (Apr to June); Q3 refers to Quarter 3 (July to Sept); and Q4 refers to Quarter 4 (Oct to Dec).
Download this chart Figure 7: 12-month growth rate of OOH(payments) with and without Council Tax
Image .csv .xlsFigure 8 shows the contributions of each component of OOH(payments) to quarterly growth including Council Tax, while Figure 9 shows the contributions of each component of OOH(payments) to quarterly growth without Council Tax. These figures help to identify the differences seen between the growth rates in Figure 2. After removing Council Tax from the index, mortgage interest payments remain the largest contributor to the growth rate. The magnitudes of the contributions from the other components of OOH(payments) generally increase once Council Tax is removed. This is because the removal of Council Tax causes adjustments in the weights of the other components of OOH(payments). As a result, the difference between the growth rates of OOH(payments) with and without Council Tax does not equal the contribution of Council Tax to the growth rate.
Figure 8: Contributions to percentage change in OOH(payments) 12-month growth rate with Council Tax
UK, Quarter 1 (Jan to Mar) 2006 to Quarter 2 (Apr to June) 2018
Source: Office for National Statistics
Notes:
- Q1 refers to Quarter 1 (Jan to Mar); Q2 refers to Quarter 2 (Apr to June); Q3 refers to Quarter 3 (July to Sept); and Q4 refers to Quarter 4 (Oct to Dec).
Download this chart Figure 8: Contributions to percentage change in OOH(payments) 12-month growth rate with Council Tax
Image .csv .xls
Figure 9: Contributions to percentage change in OOH(payments) 12-month growth rate without Council Tax
UK, Quarter 1 (Jan to Mar) 2006 to Quarter 2 (Apr to June) 2018
Source: Office for National Statistics
Notes:
- Q1 refers to Quarter 1 (Jan to Mar); Q2 refers to Quarter 2 (Apr to June); Q3 refers to Quarter 3 (July to Sept); and Q4 refers to Quarter 4 (Oct to Dec).
Download this chart Figure 9: Contributions to percentage change in OOH(payments) 12-month growth rate without Council Tax
Image .csv .xlsFigure 10 shows CPIH(payments) when Council Tax is included within OOH and CPIH(payments) when Council Tax sits outside of OOH from Quarter 1 2006 to Quarter 2 2018. The figure shows that CPIH(payments) is almost unaffected by the separation of Council Tax from OOH(payments). Throughout the period, approximately 20% of the quarters show a difference, with the magnitude of these differences ranging from negative 0.1 to 0.1 percentage points. The small difference in CPIH(payments) with and without Council Tax in OOH(payments) arises because of the relatively low expenditure weights allocated to Council Tax.
If Council Tax has a relatively high expenditure weight in OOH(payments) then we may expect to see greater differences. This is because Council Tax generally experiences stable price growth over time, compared with mortgage interest payments (the largest driver of changes in OOH(payments)). Consequently, the higher expenditure weight of Council Tax will be taken out of OOH(payments) and then be aggregated with a more stable index, which may lead to a greater difference.
Figure 10: 12-month growth rate of CPIH(payments) with and without Council Tax
UK, Quarter 1 (Jan to Mar) 2006 to Quarter 2 (Apr to June) 2018
Source: Office for National Statistics
Notes:
- Q1 refers to Quarter 1 (Jan to Mar); Q2 refers to Quarter 2 (Apr to June); Q3 refers to Quarter 3 (July to Sept); and Q4 refers to Quarter 4 (Oct to Dec).
Download this chart Figure 10: 12-month growth rate of CPIH(payments) with and without Council Tax
Image .csv .xls7. Annex 1: List of spotlight articles
This is a list of topics that we have focused on in previous publications:
Spotlight: the relationship between private rents and house prices
Spotlight: owner occupiers’ housing costs in the RPI
Spotlight: analysis of revisions to OOH(RE) expenditure weights
Spotlight: changes to methodology
Spotlight: exploratory analysis of the impact of errors in the OOH stratum weights
Back to table of contents