1. Other pages in this release
- Exploring religion in England and Wales
- Religion, education and work in England and Wales
- Religion and crime in England and Wales
- Religion and participation in England and Wales
Aim of this work
The Office for National Statistics (ONS) has worked with representatives from across government to identify the data that currently exist to understand the circumstances of people of different religious identities. Our aim is to assess the quality of the existing evidence base and develop plans to build on its strengths and address its limitations.
Definition of religion
Estimates presented in this release capture the concept of religious affiliation. The Government Statistical Service (GSS) harmonised principle on religion recommends that, where a single question is used in data collection, the concept that should be measured is religious affiliation. This captures how respondents connect or identify with a religion, regardless of whether they actively practise it (see The 2021 Census: Assessment of initial user requirements on content for England and Wales: Religion topic report (PDF, 780KB) for more information about concepts in relation to religion.)
Definition of health
The Equality and Human Rights Commission Measurement Framework (PDF, 15.66MB) identifies six domains or areas of life that are important to people and enable them to flourish.
The health domain is about having “the capability to be healthy, physically and mentally, being free in matters of sexual relationships and reproduction, having autonomy over care and treatment, and being cared for in the final stages of your life”.
Scope of this article
This part of the release uses data from Understanding Society, the UK Household Longitudinal Study (UKHLS) to present analysis on a range of self-reported health outcomes of people of different religious identities in England and Wales.
Throughout this release, comparisons are only made between estimates for different religious groups where the differences are statistically significant (see Uncertainty and quality in Section 9 for details of how statistical significance is assessed). Caution should therefore be exercised when making other comparisons between religious groups as observed differences may not be statistically significant.
Various factors are likely to affect an individual’s perceived health status, the most obvious being age, with people generally more likely to report poorer health as they get older. A religious group that has an older age profile is more likely to have a higher percentage of people who report poor health compared with one with a younger age profile, so health outcomes are commonly adjusted for the effects of differing age profiles.
A number of other factors are also likely to affect an individual’s health outcomes, including their sex, their ethnic group and the area where they live. In this part of the publication we present results for a variety of health outcomes that have been adjusted for the effects of age (five-year age bands), sex, broad ethnic group (White British, White non-British, and Non-white) and region (formerly known as Government Office Regions in England together with Wales as a whole). See Section 10, the Technical annex for further details of the methods used.
The adjustment for basic demographic profiles facilitates a more “like-for-like” comparison between the health outcomes of the various religious groups in the UK. We have not attempted to explain the determinants of health status, which would require adjustment for a much broader range of factors such as education, socioeconomic classification, occupation, income, housing tenure, marital status, diet, lifestyle choices, and other behavioural characteristics. Each of these factors may be influenced by religious affiliation (but might also be quite separate), and the relationships between the various factors and their effects on health are difficult to separate out.
As such, when interpreting the results of the analysis it should be remembered that the adjusted estimates may be indicative (or otherwise) of a statistical association between health outcomes and religious affiliation, but do not necessarily imply a causal relationship between the two.
Back to table of contents2. Main points
After adjusting for age, sex, broad ethnic group and region, in England and Wales in 2016 to 2018:
- those who identified with no religion were significantly less likely to be satisfied with their health than those who identified as Christian, Hindu or Jewish
- prevalence of long-standing impairment, illness or disability was significantly lower among those who identified as Sikh compared with several other religious groups
- smoking prevalence was significantly higher among those who identified with no religion than several other religious groups
- those who identified as Jewish, Christian or with no religion reported a greater mean level of physical functioning than those who identified as Muslim according to the 12-item Short-Form Health Survey (SF-12)
- those who identified as Sikh, Hindu or Christian reported a significantly greater mean level of mental functioning than those with no religion according to the SF-12
- those who identified as Sikh were significantly less likely than several other religious groups to be in probable mental ill-health according to the 12-item General Health Questionnaire (GHQ-12)
Statistician's comments
“This is part of a programme of work we are doing to explore inequalities in our society. The reasons for inequalities are complex, as today’s findings show, with a range of factors to be taken into account. These findings are not intended to provide definitive answers but to add to the growing evidence base on equalities.”
Paola Serafino, Centre for Equalities and Inclusion, Office for National Statistics
Back to table of contents3. Satisfaction with health
Following adjustment for age, sex, broad ethnic group and region, in England and Wales in 2016 to 2018, a significantly lower percentage of those with no religion (64%) were estimated to be satisfied with their overall health compared with those identifying as Christian (68%), Hindu (72%) or Jewish (77%) (Figure 1). Meanwhile, a significantly lower percentage of those who identified as “any other religion” (52%) were estimated to be satisfied with their health compared with all other religious groups, including the group who did not identify with any religion.
Those in the “any other religion” category often stand out in the other findings presented throughout the remainder of the article, but may include people with a range of different religious identities, which makes the data difficult to interpret meaningfully. Throughout the article, we highlight if this group is statistically significantly different to the others, but our focus is primarily on those identifying with one of the specified religions or none, as this provides greater insight.
Figure 1: After adjustment, those who identified as Christian, Hindu and Jewish were significantly more likely to be satisfied with their health
Percentage of adults (aged 16 years and over) who were estimated to be satisfied with their health, by religious affiliation after adjusting for age, sex, broad ethnic group and region. England and Wales, 2016 to 2018
Source: UK Household Longitudinal Study
Notes:
- "Any other religion’" encompasses those religions that are not otherwise listed separately.
- Because of the wide confidence intervals around some of these estimates, caution should be exercised when making comparisons between religious groupings.
Download this chart Figure 1: After adjustment, those who identified as Christian, Hindu and Jewish were significantly more likely to be satisfied with their health
Image .csv .xls4. Long-standing illness
The UK Household Longitudinal Study (UKHLS) includes a question on whether respondents have a long-standing (lasting or expected to last at least 12 months) physical or mental impairment, illness or disability.
After adjusting for age, sex, broad ethnic group and region, in England and Wales in 2016 to 2018, those who identified as “any other religion” were significantly more likely to have a long-standing physical or mental impairment, illness or disability (53%) than those who identified as Christian (36%), Muslim (35%), Hindu (27%) or Sikh (22%), or as having no religion (35%) (Figure 2). Prevalence of long-standing impairment, illness or disability was also significantly lower among those identifying as Sikh compared with those who identified as Christian, Muslim, or as having no religion.
Figure 2: After adjustment, the prevalence of long-standing impairment, illness or disability was significantly lower among those who identify as Sikh
Percentage of adults (aged 16 years and over) who are estimated to have a long-standing (at least 12 months) physical or mental impairment, illness or disability adjusted for age, sex, broad ethnic group and region, England and Wales, 2016 to 2018
Source: UK Household Longitudinal Study
Notes:
- "Any other religion" encompasses those religions that are not otherwise listed separately.
- Because of the wide confidence intervals around some of these estimates, caution should be exercised when making comparisons between religious groupings.
Download this chart Figure 2: After adjustment, the prevalence of long-standing impairment, illness or disability was significantly lower among those who identify as Sikh
Image .csv .xls5. Smoking prevalence
After adjusting for age, sex, broad ethnic group and region, smoking prevalence in England and Wales in 2016 to 2018 was significantly higher among those identifying as having no religion (18%) than those who identified as Muslim (11%), Christian (11%), Hindu (5%), Jewish (4%), Sikh (2%), or with “any other religion” (9%) (Figure 3). As well as being less likely to smoke than those of no religion, those who identified as Sikh were also significantly less likely to smoke than those who identified as Christian, Muslim, Buddhist (17%), or with “any other religion”.
Figure 3: After adjustment, smoking prevalence was significantly higher among those who identify as having no religion than that among most other religious groups
Percentage of adults (age 16 years and over) estimated to smoke by religious affiliation adjusted for age, sex, broad ethnic group and region, England and Wales, 2016 to 2018
Source: UK Household Longitudinal Study
Notes:
- "Any other religion" encompasses those religions that are not otherwise listed separately
- Because of the wide confidence intervals around some of these estimates, caution should be exercised when making comparisons between religious groupings.
Download this chart Figure 3: After adjustment, smoking prevalence was significantly higher among those who identify as having no religion than that among most other religious groups
Image .csv .xls6. Self-reported physical health state
The UK Household Longitudinal Study (UKHLS) includes questions relating to respondents’ perceived physical health from the Short-Form Health Survey (SF-12). Responses are combined in a Physical Component Summary (PCS) score ranging from 0 (lowest reported state of physical health) to 100 (highest reported state of physical health). Further details of the SF-12 PCS score can be found in Section 10, the Technical annex.
Following adjustment for age, sex, broad ethnic group and region, in England and Wales in 2016 to 2018, the mean PCS score was lowest among those identifying with “any other religion” (45.2); this was significantly lower than that for those identifying as Hindu (48.8), Sikh (49.0), Christian (49.7), Buddhist (49.9), Jewish (51.4), or with no religion (49.3) (Figure 4). Furthermore, those identifying as Muslim had a significantly lower mean PCS (47.3) than that for those identifying as Christian, Jewish, or with no religion.
Figure 4: After adjustment, those identifying as Muslim had a significantly lower mean Physical Component Summary (PCS) score
Mean Short-Form Health Survey (SF-12) PCS among adults (aged 16 years and over) adjusted for age, sex, broad ethnic group and region, England and Wales, 2016 to 2018
Source: UK Household Longitudinal Study
Notes:
- ‘"Any other religion" encompasses those religions that are not otherwise listed separately.
- Because of the wide confidence intervals around some of these estimates, caution should be exercised when making comparisons between religious groupings.
Download this chart Figure 4: After adjustment, those identifying as Muslim had a significantly lower mean Physical Component Summary (PCS) score
Image .csv .xls7. Self-reported mental health state
The UK Household Longitudinal Study (UKHLS) also includes questions relating to respondents’ perceived mental health from the Short-Form Health Survey (SF-12). Like the Physical Component Summary (PCS), responses are combined in a Mental Component Summary (MCS) score ranging from 0 (lowest reported state of mental health) to 100 (highest reported state of mental health). Further details of the SF-12 MCS score can be found in Section 10, the Technical annex.
Following adjustment for age, sex, broad ethnic group and region, in England and Wales in 2016 to 2018, the mean MCS score for those who identified with “any other religion” (45.8) was significantly lower than for those identifying as Christian (49.0), Muslim (49.2), Hindu (50.3), Sikh (50.5), or with no religion (48.3) (Figure 5). Furthermore, those reporting no religion had a significantly lower mean MCS score than those identifying as Christian, Hindu or Sikh.
Figure 5: After adjustment, those identifying as Sikh, Hindu or Christian had a significantly greater mean Mental Component Summary (MCS) score than those identifying with no religion
Mean Short-Form Health Survey (SF-12) MCS among adults (aged 16 years and over) adjusted for age, sex, broad ethnic group and region, England and Wales, 2016 to 2018
Source: UK Household Longitudinal Study
Notes:
- "Any other religion" encompasses those religions that are not otherwise listed separately.
- Because of the wide confidence intervals around some of these estimates, caution should be exercised when making comparisons between religious groupings.
Download this chart Figure 5: After adjustment, those identifying as Sikh, Hindu or Christian had a significantly greater mean Mental Component Summary (MCS) score than those identifying with no religion
Image .csv .xlsIn addition to the SF-12, the General Health Questionnaire (GHQ-12) can be used to identify possible cases of mental ill-health and is included in the UKHLS. Respondents answer a set of 12 questions on a four-point scale, which are then converted to a single score out of 12. Those with a score of 4 or more were defined to be in probable mental ill-health. Further details of the GHQ-12 can be found in Section 10, the Technical annex.
In England and Wales in 2016 to 2018, after adjustment for age, sex, broad ethnic group and region, those identifying as Sikh were significantly less likely to be in probable mental ill-health (11.5%) than those who identified as Christian (18.2%), with no religion (18.9%), or with “any other religion” (32.5%) (Figure 6). In turn, those identifying as having “any other religion” were significantly more likely to be in probable mental ill-health than those who identified as Muslim (19.1%), Christian, Hindu (15.5%), Sikh, or with no religion.
Figure 6: After adjustment, those identifying as Sikh were significantly less likely to be in probable mental ill-health than those identifying as one of several other religious groups
Percentage of adults (aged 16 years and over) with a score of 4 or more on the 12-item General Health Questionnaire by religious affiliation adjusted for age, sex, broad ethnic group and region, England and Wales, 2016 to 2018
Source: UK Household Longitudinal Study
Notes:
- "Any other religion’" encompasses those religions that are not otherwise listed separately.
- Because of the wide confidence intervals around some of these estimates, caution should be exercised when making comparisons between religious groupings.
Download this chart Figure 6: After adjustment, those identifying as Sikh were significantly less likely to be in probable mental ill-health than those identifying as one of several other religious groups
Image .csv .xls8. Measuring the data
The UK Household Longitudinal Study
The analysis in this part of the publication is based on cross-sectional data from Wave 8 of the UK Household Longitudinal Study. This is a longitudinal household survey of approximately 40,000 households (at Wave 1). Interviews are carried out face-to-face or through a self-completion online survey. It includes a youth questionnaire for those aged 10 to 15 years to complete (not included in this analysis), alongside the main adult survey, which is completed by respondents aged 16 years and over. It also includes an ethnic minority boost sample and an immigrant and ethnic minority boost sample, which has the effect of boosting the sample size for some religious groupings.
Back to table of contents9. Strengths and limitations
Uncertainty and quality
The statistics presented are estimates and as with all estimates, there is a level of uncertainty associated with them. Where available, 95% confidence intervals have been shown. These show the range within which we would expect the true value to lie for 95 out of every 100 samples drawn at random from the population. Wide confidence intervals, often associated with small sample sizes or large sample variance, indicate a wider range of values within which we would expect the true value to lie.
In many cases, sample sizes for specific religious groups are small and confidence intervals are large and overlap with one another. This makes it difficult to make robust comparisons between groups. Only statistically significant differences, as defined in this section, are commented on in this release.
Throughout this release, comparisons are only made between estimates where they are statistically significant. A finding is said to be “statistically significant” if it is unlikely to have occurred by chance if there is actually no underlying difference between the groups; statistical significance at the 5% level means we would expect to observe a finding as extreme just 5% of the time. This method has the limitation that some estimates with overlapping confidence intervals will not be flagged as being significantly different from one another, even though they would have been had a formal null hypothesis statistical test been carried out.
Because of the uncertainty inherent in working with a sample instead of the full population, it is inevitable that sample-based estimates will occasionally be flagged as significantly different from one another, when in reality there is no difference between the corresponding values in the population; such findings are known as “false-positives”. If we were able to repeatedly draw different samples from the population then, for a single comparison made in our analysis, we would expect 5% of the statistically significant findings to be false-positives. However, if multiple comparisons are conducted, as is the case in this article (because for each health outcome we compare the estimates for every pair of religions), then the probability of making at least one false-positive inference will generally be greater than 5%.
Strengths
An important strength of the analysis presented in this part of the article is the adjustments that have been made for demographic characteristics, other than religion, that are likely to affect health outcomes. In particular, adjusting for age has a large effect on the estimates presented in this analysis, revealing that some of the apparent differences between the religious groups before adjustment are associated with differences between the age profiles of the different populations. Comparisons between unadjusted and adjusted estimates are included in Section 10, the Technical annex.
Limitations
Although this analysis has adjusted for several characteristics that are likely to affect health outcomes, there are numerous other factors that may be correlated with both religious affiliation and health status, which, if included in the models, could alter the patterns seen here. While it will only be possible to consider factors that are included in the source data, this is an area for possible future investigation. In addition, it has only been possible to analyse the health outcomes that are included in the source.
This analysis only considers whether or not someone identifies with a particular religion, and does not take into account the intensity of their practice (for example, the frequency with which they attend religious services). Further work could seek to incorporate such information, possibly strengthening the evidence base regarding associations between health outcomes and religious practice in the UK.
In line with the 2011 Census, questions in all surveys relating to religion are voluntary and respondents can opt not to reveal their religious affiliation. Throughout this release, we have assumed that there is no link between choosing not to self-identify and the outcome being examined. For example, an individual of a particular religious affiliation who withholds that identity is no more or less likely to have reported that they are satisfied with their health than one who has indicated their religious affiliation. However, if this is not the case, this would affect the results presented here.
More generally, respondents with one or more missing dependent or independent variables (including religious affiliation) were omitted from the analysis for each of the health outcomes; imputation for item non-response was not performed. Aside from the loss of information, this approach will introduce bias into the adjusted estimates if the survey responses are not missing completely at random (that is, the probability of responding is correlated with other variables). However, given the low rates of missingness across the outcome variables, we might expect the magnitude of any such bias to be low. Further work could seek to investigate patterns of missingness in the UKHLS data in terms of health outcomes, religion and demographic characteristics and, if appropriate, assess the impact of performing imputation for missing data.
Like all surveys, the UKHLS is susceptible to respondent error and bias. In particular, given that the analysed health outcomes are self-reported rather than clinically measured, it is possible that under-reporting of these outcomes may be more prevalent among some groups than others, and in turn this would bias the adjusted estimates.
The cross-sectional nature of the analysis means that estimated associations between health outcomes and age are potentially subject to survivorship bias; that is, the data are right-censored because of death. For example, if smokers tend to die at a younger age on average compared with non-smokers, then smokers will be under-represented among the higher age-bands. Survival analysis techniques are designed to overcome the issue of censoring, but the cross-sectional UKHLS data lack the necessary time-to-event variables with which to perform such an analysis, so further work could seek to explore the longitudinal data in this respect.
When interpreting the results of this analysis, it should be remembered that the adjusted estimates may be indicative (or otherwise) of a statistical association between health outcomes and religious affiliation, but do not necessarily imply a causal relationship between the two.
Back to table of contents10. Technical annex
This section provides a technical overview of the models that were fitted to the data.
Differences in health outcomes across religious groups may be driven, in part, by differences among the groups’ demographic profiles. Here we outline the method we used to estimate adjusted mean outcomes, which mitigate the effect of important demographic characteristics. The adjusted means can be interpreted as the estimated means if all religious groups had the same demographic profile.
Data preparation
Individual-level responses to Wave 8 of the UK Household Longitudinal Study (UKHLS) were analysed for 27,584 responding adults (aged 16 years and over) after applying the eligibility criteria listed in Table 1.
| Stage | Sample size |
|---|---|
| 1. Original UKHLS Wave 8 individual-level sample | 39,293 |
| 2. After excluding those in Scotland or Northern Ireland | 33,530 |
| 3. After excluding those with proxy interviews | 32,087 |
| 4. After excluding those with zero weight | 27,584 |
Download this table Table 1: Sample eligibility criteria
.xls .csvDependent and independent variables
We constructed regression models to estimate the association between religious affiliation and each of the health outcomes (dependent variables) listed in Table 2.
| Variable | Type | Definition | |
|---|---|---|---|
| Health satisfaction | Binary | Yes: completely satisfied, mostly satisfied, somewhat satisfied No: completely dissatisfied, mostly dissatisfied, somewhat dissatisfied, neither satisfied nor dissatisfied | |
| GHQ-12 (explained below) | Binary | Yes: 4-12 affirmative responses No: 0-3 affirmative responses | |
| Smoking status | Binary | Yes: current smoker No: not current smoker | |
| Long-standing illness | Binary | Yes: has a physical or mental impairment, illness or disability that has, or is likely to, trouble the respondent for a period of at least 12 months No: does not have a physical or mental impairment, illness or disability that has, or is likely to, trouble the respondent for a period of at least 12 months | |
| SF-12 MCS and PCS (explained below) | Continuous | Scale of 0 to 100 |
Download this table Table 2: Definitions of dependent variables in models
.xls .csvThe Short-Form Health Survey (SF-12) is a self-reported assessment of general health status and is included in the UKHLS. Respondents answer a set of 12 multiple-choice questions, each reported on a Likert scale, which are then aggregated to derive Mental Component Summary (MCS) and Physical Component Summary (PCS) scores. These scores are continuous measures ranging from 0 (lowest reported state of health) to 100 (highest reported state of health). The SF-12 includes questions on various aspects of health: physical activity and achievement (such as the ability to climb several flights of stairs); pain, energy and vitality, and general health; social and emotional functioning (such as the extent to which health interferes with social activities); and mental state (such as calmness and mood).
The General Health Questionnaire (GHQ-12) is also a self-reported assessment but, unlike the SF-12, it pertains only to mental rather than physical health. Respondents answer a total of 12 questions on anxiety and depression (including losing sleep over worry or feeling unhappy), social dysfunction (such as being able to enjoy and concentrate on activities, or the capability to make decisions and face up to problems), and loss of confidence and self-worth. Each question is answered on a 0 to 3 Likert scale and then dichotomised such that a response of 2 or 3 is taken as an affirmative answer.
The resulting score ranges from 0 (highest reported mental health state) to 12 (lowest reported mental health state), and this is further dichotomised to classify respondents as being in probable mental ill-health or otherwise. There is no universally agreed threshold score for determining what constitutes probable mental ill-health but, in line with other official sources such as the Health Survey for England 2018 (PDF, 423KB), we opted for a threshold score of 4.
We included religious affiliation in each model as an explanatory (independent) variable, categorised as Buddhist, Christian, Hindu, Jewish, Muslim, Sikh, “any other religion”, or no religion (reference category). We included the following additional independent variables in the models to control for the demographic profiles of the various religious groups:
- five-year age-band: 16 to 20 (reference), 21 to 25, …, 81 to 85, 86 years and over
- sex: Female (reference), Male
- region: East Midlands (reference), East of England, London, North East, North West, South East, South West, Wales, West Midlands, Yorkshire and The Humber
- ethnicity: White British (reference), White Non-British, Non-White
These variables are potentially confounding factors, as they were each found to be significantly associated with both religious affiliation and each of the analysed health outcomes at the 5% level. Differences in health outcomes across religious groups may be partly driven by differences in these demographic characteristics. Adjusting for these confounding factors therefore allows for a more meaningful interpretation of health-religion association patterns, independently of the demographic profile of each religious group.
We omitted from the analysis respondents with one or more missing dependent or independent variable (for example, because of non-response, refusal to respond, or unknown response). This complete-case analysis resulted in the analysed sample sizes shown in Table 3. Rates of missingness ranged from 0.5% (smoking status) to 5.2% (SF-12 MCS and PCS).
| Sample | Health satisfaction | GHQ-12 | Smoking status | Long-standing illness | SF-12 MCS/PCS |
|---|---|---|---|---|---|
| Eligible sample | 27,584 | 27,584 | 27,584 | 27,584 | 27,584 |
| Religion missing | 103 | 103 | 103 | 103 | 103 |
| Age missing | 0 | 0 | 0 | 0 | 0 |
| Sex missing | 1 | 1 | 1 | 1 | 1 |
| Region missing | 0 | 0 | 0 | 0 | 0 |
| Ethnicity missing | 16 | 16 | 16 | 16 | 16 |
| Outcome missing | 1,084 | 1,216 | 18 | 54 | 1,339 |
| Any variable missing | 1,181 | 1,309 | 128 | 164 | 1,435 |
| Final sample | 26,403 | 26,275 | 27,456 | 27,420 | 26,149 |
| Missing rate | 4.3% | 4.7% | 0.5% | 0.6% | 5.2% |
Download this table Table 3: Analysed sample sizes for each health outcome
.xls .csvModel fitting
We fitted binary logistic regression models to health satisfaction, GHQ-12, smoking status and long-standing illness, and linear regression models to the two SF-12 variables. All models were estimated using the “survey” package in R version 3.4.0, allowing the appropriate sampling weights to be incorporated and the complex design of the UKHLS survey to be accounted for.
We performed likelihood-ratio tests for each independent variable in each model; chi-squared p-values are summarised in Table 4. All independent variables were statistically significant at the 5% level in all models, except for sex in the smoking status model, and region and ethnicity in the health satisfaction and GHQ-12 models. Irrespective of statistical significance, we included all five independent variables in all six models to facilitate consistency of interpretation between the health outcomes.
| Variable | Health satisfaction | GHQ-12 | Smoking status | Long-standing illness | SF-12 MCS | SF-12 PCS |
|---|---|---|---|---|---|---|
| Religion | <0.001 | <0.001 | <0.001 | <0.001 | <0.001 | <0.001 |
| Age-band | <0.001 | <0.001 | <0.001 | <0.001 | <0.001 | <0.001 |
| Sex | <0.001 | <0.001 | 0.269 | <0.001 | <0.001 | <0.001 |
| Region | 0.228 | 0.339 | <0.001 | <0.001 | 0.036 | <0.001 |
| Ethnicity | 0.765 | 0.209 | 0.012 | 0.008 | 0.018 | 0.001 |
Download this table Table 4: Omnibus p-values for independent variables in each model
.xls .csvEstimated adjusted means and percentages
We estimated religion-specific adjusted means (continuous dependent variables) and percentages (binary dependent variables) for each health outcome using the “emmeans” package in R version 3.4.0.
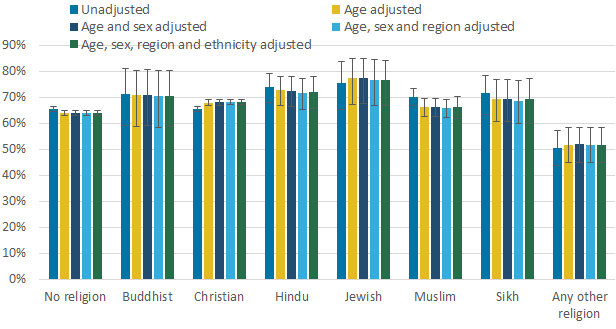
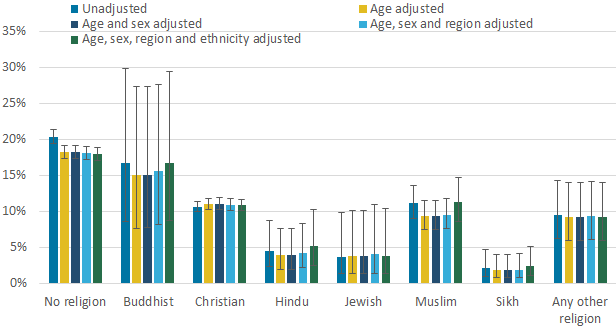
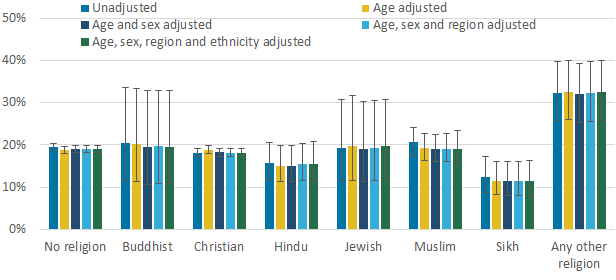
As with the unadjusted estimates, there is no consistent pattern in the estimates across religions following adjustment for demographic characteristics. In terms of magnitude, the age adjustment has the biggest impact on the estimates, most notably for smoking status, long-standing impairment, illness or disability and, to a lesser extent, SF-12 PCS. The ethnicity adjustment also has a marked impact on the estimates for some outcomes and religious groups, for example, increasing the estimated smoking prevalence for those identifying as Buddhist, Hindu or Muslim.
There exist several instances of changes to inferences following adjustment, for example, there was no significant difference in the percentage of adults who were estimated to be satisfied with their health between those with no religion and those identifying as Christian before adjustment, but this percentage was significantly greater for the latter group afterwards. Meanwhile, the percentage of adults who were estimated to have a long-standing impairment, illness or disability was significantly greater for those identifying as Christian compared with those without religion or identifying as Hindu, Muslim or Sikh before adjustment, but only the latter of these differences was significant afterwards. These examples demonstrate the importance of adjusting health outcomes for potentially confounding factors when making comparisons between religious groups.
Figure 7: Adjusted estimates of the percentage of adults (aged 16 years and over) who were satisfied with their health by religious affiliation
England and Wales, 2016 to 2018
Source: UK Household Longitudinal Study
Notes:
- "Any other religion" encompasses those religions that are not otherwise listed separately.
- Because of the wide confidence intervals around some of these estimates, caution should be exercised when making comparisons between religious groupings.
Download this image Figure 7: Adjusted estimates of the percentage of adults (aged 16 years and over) who were satisfied with their health by religious affiliation
.png (12.3 kB) .xlsx (26.1 kB)
Figure 8: Adjusted estimates of the percentage of adults (aged 16 years and over) with a long-standing (at least 12 months) physical or mental impairment, illness or disability by religious affiliation
England and Wales, 2016 to 2018

Source: UK Household Longitudinal Study
Notes:
- "Any other religion" encompasses those religions that are not otherwise listed separately.
- Because the wide confidence intervals around some of these estimates, caution should be exercised when making comparisons between religious groupings.
Download this image Figure 8: Adjusted estimates of the percentage of adults (aged 16 years and over) with a long-standing (at least 12 months) physical or mental impairment, illness or disability by religious affiliation
.png (11.6 kB) .xlsx (18.4 kB)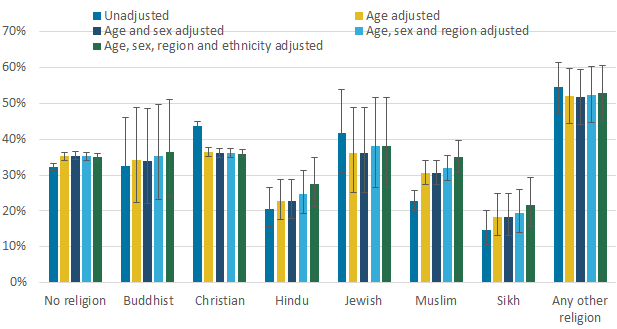
Figure 9: Adjusted estimates of the percentage of adults (aged 16 years and over) who smoke by religious affiliation
England and Wales, 2016 to 2018
Source: UK Household Longitudinal Study
Notes:
- "Any other religion" encompasses those religions that are not otherwise listed separately.
- Because of the wide confidence intervals around some of these estimates, caution should be exercised when making comparisons between religious groupings.
Download this image Figure 9: Adjusted estimates of the percentage of adults (aged 16 years and over) who smoke by religious affiliation
.png (19.1 kB) .xlsx (25.9 kB)
Figure 10: Adjusted estimates of mean 12-item Short-Form Health Survey Physical Component Summary (SF-12 PCS) among adults (aged 16 years and over) by religious affiliation
England and Wales, 2016 to 2018

Source: UK Household Longitudinal Study
Notes:
- "Any other religion" encompasses those religions that are not otherwise listed separately.
- Because of the wide confidence intervals around some of these estimates, caution should be exercised when making comparisons between religious groupings.
Download this image Figure 10: Adjusted estimates of mean 12-item Short-Form Health Survey Physical Component Summary (SF-12 PCS) among adults (aged 16 years and over) by religious affiliation
.png (9.9 kB) .xlsx (28.0 kB)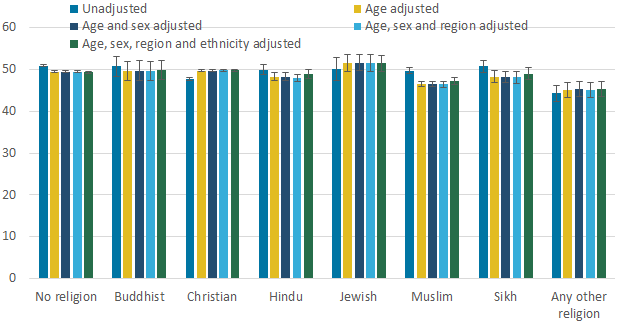
Figure 11: Adjusted estimates of mean 12-item Short-Form Health Survey Mental Component Summary (SF-12 MCS) among adults (aged 16 years and over) by religious affiliation
England and Wales, 2016 to 2018

Source: UK Household Longitudinal Study
Notes:
- "Any other religion" encompasses those religions that are not otherwise listed separately.
- Because of the wide confidence intervals around some of these estimates, caution should be exercised when making comparisons between religious groupings.
Download this image Figure 11: Adjusted estimates of mean 12-item Short-Form Health Survey Mental Component Summary (SF-12 MCS) among adults (aged 16 years and over) by religious affiliation
.png (24.6 kB) .xlsx (28.0 kB)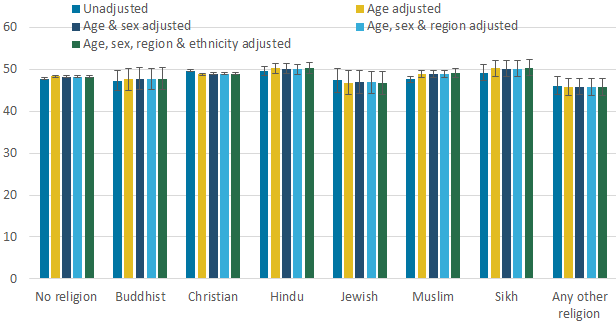
Figure 12. Adjusted estimates of the percentage of adults (aged 16 and over) with a score of 4 or more on the General Health Questionnaire (GHQ-12) by religious affiliation
England and Wales, 2016 to 2018
Source: UK Household Longitudinal Study
Notes:
- "Any other religion" encompasses those religions that are not otherwise listed separately.
- Because of the wide confidence intervals around some of these estimates, caution should be exercised when making comparisons between religious groupings.