Table of contents
- Disability data and coronavirus overview
- Main research strategies and findings
- ONS Public Health Data Asset
- Existing standards and available disability indicators
- Strategy 1: predicting impairments in alternative data sources and implementation in PHDA
- Strategy 2: finding proxies for impairment type in existing administrative health data using expert clinical knowledge
- Strategy 3: an overview of using alternative linked data to identify the disabled population
- International context and framework on disability
- Acknowledgements and collaboration
- Data
- Glossary
- Related links
2. Main research strategies and findings
To identify people who experience different impairment types and their consequent coronavirus (COVID-19) outcomes, we have used three research strategies centred around the Public Health Data Asset (PHDA):
Modelling health conditions and sociodemographic variables to predict impairment types in alternative survey data sources, with subsequent implementation of predictive modelling in the PHDA
Finding proxies for differing impairment types in existing administrative health data sources in the PHDA using expert clinical knowledge
Adding alternative linked data to the PHDA to identify the disabled population
Strategy 1
Under strategy 1, we were able to develop models to predict impairment type from health condition and sociodemographic data in survey datasets. We informed our modelling process using descriptive analysis of survey data and showed that different impairment types vary in terms of the health conditions they capture. However, these predictive models could currently not be applied to the ONS Public Health Data Asset (PHDA) because of misalignment of health condition variables. The lower level of detail of health data and alternative coding systems used in the survey sources where the predictive models were developed was too broad to compare with the fine scale records contained in the PHDA.
Strategy 2
Under strategy 2, we examined whether we could identify clinical diagnosis codes in available GP and hospital records for health conditions that are usually associated with an impairment to create proxy indicators for impairment types. While acknowledging that the health records at our disposal were not designed for our intended use, a specific selection of codes in hospital episode data were used to identify a selection of the population who experience hearing and vision impairment.
However, the use of hospital records limits identification to those that have had a hospital episode. Treatment for hearing and vision impairment may occur outside of hospital settings. The identified populations may therefore underestimate the prevalence of those impairments. Use of such proxies in any further COVID-19 analyses should caveat the selective nature of those indicators and consider appropriate research designs (for example, comparing those with and without impairment among a hospitalised population).
Strategy 3
Here, we present potential alternative data sources that may prove insightful for additional linkage to the PHDA. We provide an overview of potential data sources for linkage and a use case for collecting higher resolution data on disability and functioning from individuals (for example, within administrative health data or Census).
Should a wider selection of administrative data become available, the strategies 1 and 2 may also prove effective for future use.
Back to table of contents3. ONS Public Health Data Asset
The Public Health Data Asset (PHDA) presents a unique composition of linked data sources:
person-level information from the 2011 Census
death registrations data
person-level aggregates of General Practice Extraction Service (GPES) Data for Pandemic Planning and Research (GDPPR)
Hospital Episode Statistics (HES)
It is continuously developed with up-to-date data and new sources being linked, such as the National Immunisation Programme for Vaccination. The data linkage is facilitated by the NHS Patient Record (PR), which extracts an individual’s unique NHS number from address, date of birth and name data.
Linkage to the 2011 Census provides demographic data, as well as socio-economic and geographical characteristics. However, while the 2011 Census covers England and Wales, linked administrative health records cover England only. Further, it provides a measure of disability – albeit dated – that is not available elsewhere (see Section 4 on existing standards for more information). This sociodemographic data is accurate at the time of capture, but 11 years have elapsed since. The 2021 Census will provide a more recent indicator of disability and other demographics upon successful linkage.
In the 2011 Census, 53,483,456 individuals could be matched to an NHS Number, allowing for further linkage. This subset of census participants comprises the core spine of PHDA because both a census identifier and NHS number are known for these people. NHS numbers provide the linkage to GPES records, where journal items – including diagnoses – are recorded as SNOMED codes. 41,238,681 census IDs can be matched to at least one record in GPES. The NHS number further provides extraction information for HES records spanning between 2011 and 2020, where diagnoses are recorded as International Classification of Diseases and related health problems (ICD) 10th revision (ICD-10) codes and procedures as Classification of Interventions and Procedures OPCS codes; 45,262,224 census IDs can be matched to at least one record in HES.
The PHDA has formed the basis of many research projects conducted by the ONS in response to the coronavirus pandemic and has resulted in, among others, publications of ethnic contrasts between deaths involving COVID-19, monitoring of sociodemographic differences in vaccination rates and differences in vaccination rates by occupation.
Back to table of contents4. Existing standards and available disability indicators
Existing standards to measure disability and impairment in the UK
Across statistics producers in the UK, the Government Statistical Service (GSS) provides standards on how to measure disability and impairment. The adoption of harmonised standards has the potential to facilitate monitoring of outcomes of disabled people in a consistent manner across areas of life and data sources. This aids public authorities in carrying out their functions, monitoring and evaluating objectives as set out under the Equality Act 2010 (such as the Public Sector Equality Duty).
The measurement of disability focuses on capturing disability as understood in the Equality Act (2010) for Great Britain, and the Disability Discrimination Act (1995) in Northern Ireland, which identifies people as disabled if they have a physical or mental impairment that has a “substantial” and “long-term” negative effect on their ability to complete normal daily activities.
The harmonised impairment standard looks at the functions that a person either cannot perform or has difficulty performing because of their health condition. It identifies 10 impairment types:
vision
hearing
mobility
dexterity
learning or understanding or concentrating
memory
mental health
stamina or breathing or fatigue
socially or behaviourally
other
In 2021, the Inclusive Data Task Force (IDTF) advised to review the harmonised standards with the aim to ensure measurement of disability is grounded within ICF. The GSS harmonisation plan published in early 2022 sets out a workplan to review GSS harmonised standards and guidance.
Please see Section 8 on the international context and framework on disability for a summary of the international context on disability definitions.
Available disability and impairment indicators in the PHDA
Within the Public Health Data Asset (PHDA), the indicators designed to explicitly capture disability are limited. The 2011 Census provides the only disability measure, which is similar, but not equal, to the Equality Act (2010). Death certificates, primary care or hospital data do not contain indicators that can identify those who are disabled as understood in the Equality Act (2010) in England. The 2011 Census asked respondents:
Are your day-to-day activities limited because of a health problem or disability which has lasted, or is expected to last, at least 12 months? Include problems related to old age.
Yes, limited a lot
Yes, limited a little
No
Although the 2011 Census question is slightly different from the current GSS harmonised standard to measure disability, it provides similar information. Those respondents who reported “yes” are classified as disabled in analysis, with a potential to distinguish different severity levels between those who indicated “a lot” or “a little” activity restriction. While the measure can indicate whether an individual is disabled or not and provide a high-level estimate of severity of functioning problems experienced, it does not provide information on which body functions or which types of activities are affected.
The GSS harmonised impairment standard would provide a greater degree of resolution to the harmonised standard to measure disability. The 2011 Census, however, did not collect data on impairment type or which activity limitation people experienced.
To increase the insights into the experiences of disabled people throughout the coronavirus pandemic, attempts have been made to identify those with a learning disability within the data. Analysis of deaths involving COVID-19 by disability status has drawn on information available in primary care records, according to the same definition as that used in the QCOVID risk prediction model. While the definition employed within QCOVID differs from the available register for people with a learning disability as developed for the Quality and Outcome Framework (QOF), the logic behind identifying those with a learning disability is similar by drawing on what is registered in primary care records.
For other impairment types, insights on the impact of coronavirus on mortality and other life outcomes are lacking. This report describes the feasibility of different strategies to identify other impairment types in the data to enable more detailed future analysis.
Back to table of contents5. Strategy 1: predicting impairments in alternative data sources and implementation in PHDA
This strategy explores the development and training of predictive models of impairment types and their implementation in the Public Health Data Asset (PHDA). The model aims to estimate the relationships between available data on health conditions, socio-demographic characteristics and impairment types using alternative data sources. The development of predictive models that will derive impairment type from underlying health conditions and sociodemographic information requires presence of all three areas of data.
Three candidate data sources were explored for data that may fill the required gaps in the disability data landscape:
The EHIS asks targeted health questions but does not formalise the responses into specific diagnoses or categories.
The ELSA is an additional survey that uses the HSE as a sampling base and would provide a limited sample size because of its focus on respondents over the age of 50 years. There is a correlation between disability and age, so while it is likely that using the ELSA as a sampling base would return a higher proportion of disabled individuals, it would preclude inferences from being drawn on non-age discriminative impairments.
The HSE, however, collects detailed sociodemographic information, health condition information in the form of ICD-10 (International Classification of Diseases) chapter codes, and harmonised impairment types.
There are differences in how health data and impairment types are captured in the HSE and the PHDA. Health information (ICD-10 chapter codes) are derived variables based on health condition information presented by the participant, whereas impairment type information is directly reported by the respondent via the GSS impairment standard. Health condition data within the PHDA are not self-reported as in the HSE. Still, the HSE was deemed as the most promising dataset and selected for further analysis.
Exploration of the HSE was guided by three overarching research questions:
Can we identify common areas of functioning that are affected among disabled people who report a specific health condition?
Do disabled people with specific impairment types tend to report a specific underlying health condition?
What roles do socioeconomic and demographic characteristics play in the relationship between health conditions and impairments or activity limitations?
Exploration of the Health Survey for England data
To ensure adequate sample sizes for modelling specific impairment types in isolation, we pooled five years of publicly available HSE data (2014 to 2018) to yield an unweighted sample size of 52,127 individuals.
Identification of disability status from responses to the HSE is achieved from two questions, in line with the GSS harmonised disability standard. Firstly, “do you have any physical or mental health conditions or illnesses lasting or expected to last 12 months or more?”, and secondly, “do any of your conditions or illnesses reduce your ability to carry-out day-to-day activities?”. A third follow up question is available within the HSE, which establishes the duration of an individual’s activity limitation.
Of the respondents, 20,065 (38%) reported presence of a long-standing physical or mental health condition compared with 34,044 (62%) who did not. Activity limitation is reported as:
“yes, limited a lot”
“yes, limited a little”
“no, not at all”
Of those with a long-standing physical or mental health condition:
27% (5,373) reported significant limitations to their activity
32% (6,413) reported less severe activity limitations
41% (8,267) reported no reduction in their ability to carry-out day-to-day activities
Identification of a group experiencing a long-lasting health condition but no subsequent limitation to their day-to-day activities represents an interesting avenue for future research. Members of this group only partially meet the Equality Act (2010) definition of disability, and, as they do not report a limitation to their day-to-day activities, are not classified as disabled people. As the HSE contains detailed sociodemographic data, investigation of these two groups – those reporting an activity limitation and those that have a long-standing condition without a subsequent activity limitation – provides a unique vignette to uncover sociodemographic drivers or determinants of disability.
Differences between groups reporting varying degrees of activity limitation may be partially explainable by differences in either health condition or impairment types, or different environmental contexts. Respondents can report presence of more than one health condition in addition to more than one impairment type.
Understanding impairment types and associated health conditions
To model the associations between health conditions and impairment types, it is important to understand the composition of each impairment type. There are specific conditions that can directly lead to a particular impairment. However, multiple comorbidities frequently combine to develop similar or different experiences of impairment which may be further complicated by individual factors such as age, environment, and social conditions.
The presence of multiple impairments in an individual are likely to compound activity limitations. This raises questions such as:
Can we investigate if specific impairment types are driven by health conditions?
Are specific health conditions unique to specific impairment types?
Do closely related impairment types occur together?
Network analyses were conducted on a subset of the HSE population consisting of only those who reported a long-standing mental or physical health condition and either a more severe or less severe limitation to their day-to-day activities. No disaggregation by the length of time an individual had experienced activity limitations was made.
Figure 1 is an upset plot that displays the linkages between impairment types in the identified sample of people with a long-standing condition and a limitation to their day-to-day activities. For example, the first bar shows the number of people reporting a mobility impairment alone, indicated by a lone point in the grid in the mobility row below the first bar. The fourth bar shows the number of people who report both a mobility, and stamina or breathing or fatigue, indicated by the points in the respective rows joined in the grid.
Figure 1: Prevalence of singular and co-occurring impairment types
Frequency of reported impairment types by people with a longstanding mental or physical health condition who experience a reduction in their day-to-day activities, Health Survey for England, England, 2014 to 2018

Source: NHS Digital – Health Survey for England, UK Data Archive
Notes:
The impairment types are based on the GSS harmonised impairment standard. It looks at the functions that a person either cannot perform or has difficulty performing because of their health condition. Respondents were asked to select all impairments that applied to them.
The full title of impairment type labelled ‘Stamina’ is ‘Stamina or breathing or fatigue’.
The full title of impairment type labelled ‘Socially’ is ‘Socially or behaviourally’.
Missing impairments refer to instances where no response to harmonised impairment types was provided.
Only the 75 most frequent impairment types or combination of impairment types are visualised. Other combinations of impairments may exist within the data beyond this cut off.
Download this image Figure 1: Prevalence of singular and co-occurring impairment types
.png (55.0 kB) .xlsx (19.2 kB)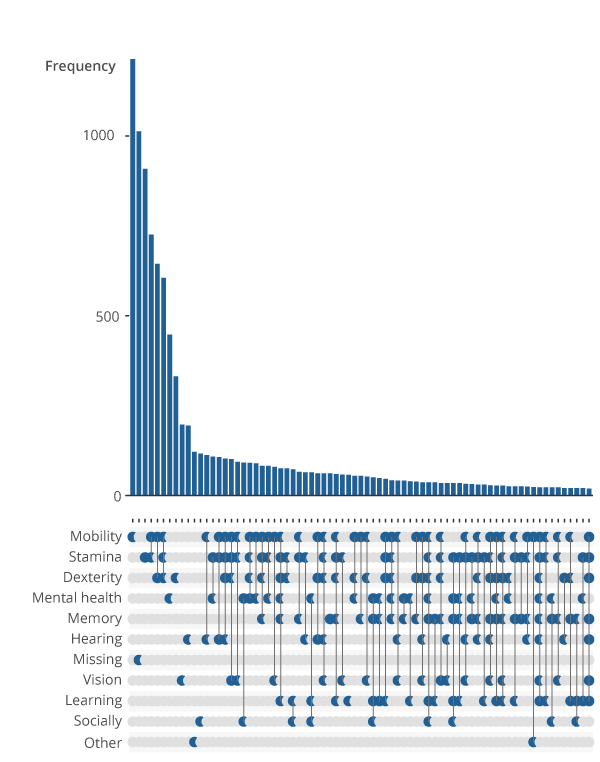
This revealed several points of interest. Firstly, impairment types that would logically occur together – for example dexterity and mobility impairments – are clustered within the dataset. Although 3,573 of identified respondents report only singular impairment types, most individuals report interactions of two or more impairment types. A considerable proportion of individuals report complex interactions of impairment types, which may reduce the effectiveness of predictive modelling approaches.
The second most frequent response was that the impairment type of an individual was missing. This means the participant either forgot or refused to answer the question regarding impairment types or did not identify with any of the impairment types listed.
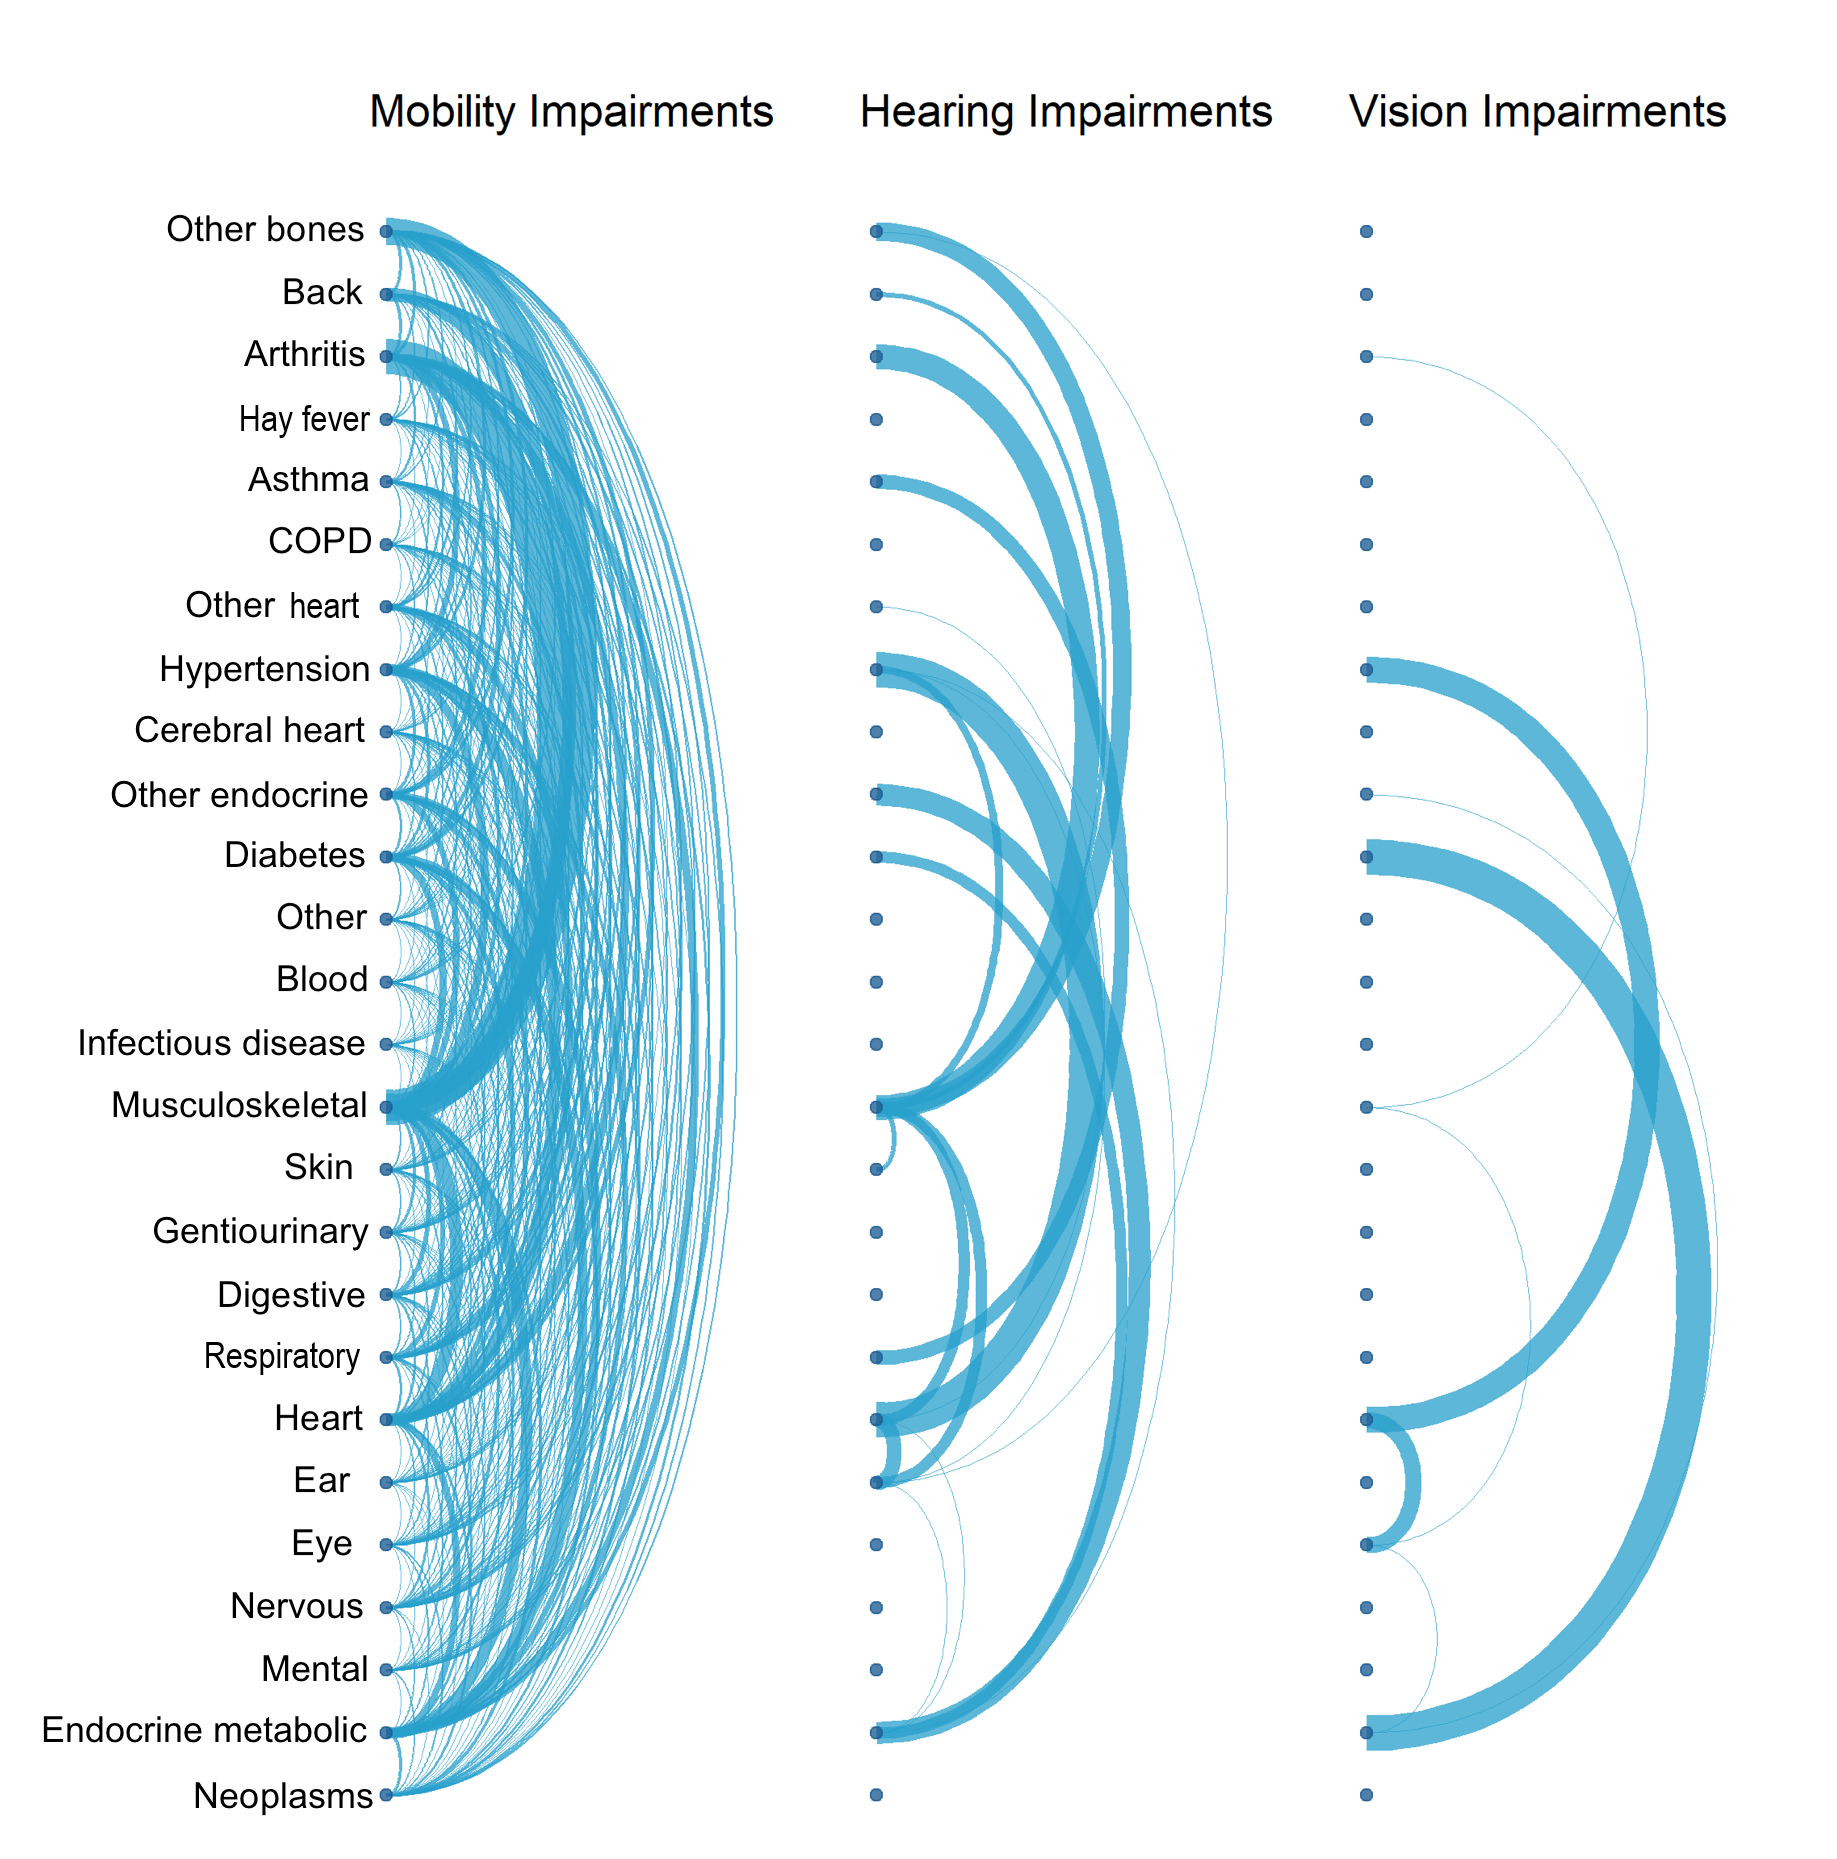
It is further important to understand the health condition composition of each impairment type. Arc plots reveal links between health conditions (ICD-10 chapters) within specific impairment types. Arcs between nodes, displayed on the y-axes, indicate a link between those conditions. The thickness, or weight, of that line indicates how many instances of that linkage there is. The thicker the line, the greater the number of people with links between those health conditions. This network analysis revealed varying degrees of complexity within discrete impairment types (Figure 2).
Many impairment types exhibit highly complex interactions of health conditions, as shown in Figure 2 for mobility. Other impairment types exhibit similar linkages, which raises questions about the appropriateness of using health conditions to differentiate impairment types.
Reliance on ICD-10 chapter level information may further preclude the nuances between underlying conditions. For example, diabetes is a wide-ranging and cross-cutting condition that is multi-faceted in its health implications. It may not be appropriate to use such a condition bracket when trying to distinguish impairment types.
Figure 2: Impairment types vary in health conditions reported
Frequency of health conditions within different impairment types reported by participants, Health Survey for England, England, 2014 to 2018
Source: NHS Digital – Health Survey for England, UK Data Archive
Notes:
Health conditions reported at the ICD-10 chapter level by respondents to the Health Survey for England across 2014 to 2018.
The impairment types are based on GSS harmonised impairment standard. It looks at the functions that a person either cannot perform or has difficulty performing because of their health condition. Respondents were asked to select all impairments that applied to them.
Only individuals reporting just the impairment type in question were included and those reporting multiple impairment types were excluded.
The thickness, or weight, of the arcs joining health condition chapters indicate the frequency of responses reported together. The thicker the arc, or larger the weight, the more frequent the response.
Download this image Figure 2: Impairment types vary in health conditions reported
.png (1.1 MB) .xlsx (34.6 kB)
Further, health conditions in some impairment types seem atypical. Hearing impairment linkages, on the surface, appear complex. There is a high frequency of linkages between endocrine metabolic disorders, musculoskeletal disorders, and heart disorders, which are perhaps not conditions expected to be associated with those who identify only as hearing impaired. That said, except for mobility impairments, the hearing-impaired category is logically the only category to note health conditions associated to the ear.
Within mobility impairments, there are linkages between every health condition chapter, with the most prominent linkages between musculoskeletal disorders, back problems, bone problems and arthritis. All these conditions occur logically within this impairment type.
The vision impairment category is markedly less complex in its composition of health conditions. Frequent linkages exist between eye conditions, heart conditions, diabetes, and endocrine metabolic disorders. This illustrates the influence that a broad disease category may have on distinguishing between impairment outcomes.
Diabetes can often result in diabetic retinopathy – a condition that may render an individual vision impaired – but can also relate to conditions of the heart and lead to amputations. The non-discriminative categorisation of diabetes may result in difficulties in inference of impairment type. It is a prime example of the scope for variation of conditions and severity within chapter level descriptors of health conditions.
Predictive modelling
Model selection
Several types of predictive models would be suited to infer impairment types from health condition and sociodemographic data in common with 2011 Census information. The sociodemographic variables within the HSE were filtered for compatibility with the 2011 Census (see the accompanying dataset). Classification models were best suited to this task.
It is a condition of binary classifiers that there are no missing values within the dataset. If the model is based upon 10 variables, only records with data for all 10 variables can be included. Incomplete records were therefore removed from the dataset. All models were run on weighted data using an 80-20 train-test split.
Only cases reporting a singular impairment type were included in predictive modelling training datasets. Models were initially attempted without instigating this filter. However, it was found that the presence of additional impairment types were strong predictors of other impairments. For example, the strongest predictor of an individual experiencing a mobility impairment was presence of a stamina impairment.
It then becomes complex to disentangle which impairment is the driver of an individual’s lived experience and which health conditions and sociodemographic variables contribute the most. Further, because of a lack of impairment data within the PHDA, use of variables as predictors that are absent from the final test data set would cause developed models to fail when applied to the PHDA.
By creating a model for each impairment type in isolation, we can iteratively run these models in the PHDA, thus they are still capable of flagging individuals with any combination of potential impairment types.
Model results
Logistic regression, penalised logistic regressions and random forest models were used to predict impairment types. Their accuracy was compared via an Area Under the Curve (AUC) value. The higher the AUC value, the better the model is at distinguishing between classes. Non-penalised logistic regressions were less effective than penalised methods, with the exceptions of memory and learning impairment classes.
Performance of the models appears unrelated to the complexity of health condition linkages revealed in the network analyses. Though not of interest for model application, the importance of specific health conditions and sociodemographic variables differed for each model. For example, logically, musculoskeletal conditions were the primary driver of mobility impairment predictions, opposed to eye conditions for vision impairment predictions.
LASSO logistic regressions were the most effective predictors of impairment type from the combination of health conditions and selected sociodemographic variables. Their success ranged from 70.1% to 93.2% accurate (Figure 3). Model performance was assessed on the 20% of data retained for testing in the train-test split.
Although random forest models performed better than LASSO logistic regression approaches, they are less informative. In logistic regression approaches, the prediction power of specific variables is calculated. For example, when modelling mobility impairments, the most powerful predictor was found to be presence of a musculoskeletal health condition. The random forest model was the highest performing model for predicting mobility impairments. However, it had been run in isolation, no information about which variables contribute to the presence of a mobility impairment could be extracted.
Figure 3: Model accuracy of three classification models used to predict impairment type
Area Under the Curve (AUC) accuracy of predictive models trained and tested on the pooled 2014 to 2018 Health Survey for England dataset
Source: NHS Digital – Health Survey for England, UK Data Archive
Notes:
Impairment types were predicted using logistic regressions, penalised (LASSO) logistic regressions and random forest models. Model accuracy was assessed using the AUC metric.
AUC is the ability for a classifier to distinguish between classes. It is calculated by comparing true negatives, true positives, false negatives, and false positives within a confusion matrix. See glossary for further information.
Random forests were the most effective predictors of impairment type from sociodemographic and health condition data.
Download this chart Figure 3: Model accuracy of three classification models used to predict impairment type
Image .csv .xlsTranslation of variables between datasets
Implementation of trained predictive models within the PHDA is dependent on alignment of variables with the development dataset (HSE). Table 1 presents a concise overview of this translation. Several incompatibilities between the development dataset (HSE) and the analytical dataset (PHDA) were observed in doing so.
| Data Set | Disability Measure | Sociodemographic data | Health condition format | Impairment type |
|---|---|---|---|---|
| HSE | Harmonised standard | Present | ICD-10 chapter codes | Present |
| PHDA (GPES) | Census 2011 | Census 2011 | SNOMED codes | Absent |
| PHDA (HES) | Census 2011 | Census 2011 | ICD-10 diagnosis codes | Absent |
Download this table Table 1: Translation of variables between model development (HSE) and analytical (PHDA) datasets.
.xls .csvFirstly, the disability measures did not align between the HSE and the PHDA. The 2011 Census disability measure does not align with GSS harmonised measure as adopted in the HSE. It is therefore possible that when subsampling the population of the HSE for model development, individuals we identified as disabled by their responses to that survey may not have been identified as disabled using the 2011 Census measure. Moreover, individuals that identified as disabled in the 2011 Census may also no longer identify as disabled at a later point. As different time periods are used across data sources, this may affect modelling results as well.
Most importantly, there is a disparity in the selection and classification of health condition data. In terms of selection, the GP records (PHDA GPES) available in the PHDA represents a selection of electronic health records selected for coronavirus (COVID-19) pandemic purposes at the start of the coronavirus pandemic. The HSE data, as a general population sample to provide data on general health outcomes, was not collected with a specific COVID-19 analytical directive. As such, the range of health conditions covered in the HSE is expected to be wider. More complete GP data would aid in ensuring main health-related predictors in the predictive modelling are representative of a wide spectrum of health conditions.
In terms of classification, health conditions in GP records (PHDA GPES) are recorded as SNOMED codes, whereas hospital episodes (PHDA HES) record diagnoses as ICD-10 codes. The health condition information in the HSE is only available at ICD-10 chapter level.
Tools were investigated to translate SNOMED codes into ICD-10 codes, including the NHS Digital SNOMED CT Browser. Several issues were presented with this approach. Firstly, the conditions within the GDPPR were selected for specific analytical pandemic purposes and were not considered reflective of a GP’s general workload and of one’s health status with, for example, a high presence of codes for rare or congenital conditions (discussed further in strategy 2).
Many conditions that were fed into the conversion tool returned “map source concept cannot be classified with available data”. There are several reasons why a concept cannot be classified, including when the concept is completely out-of-scope of ICD-10. For example, concepts within the observable entity, body structure or specimen hierarchies, or when the clinical meaning of a concept lacks essential detail required for the concept to be classified in ICD-10.
Secondly, presentation of codes to the translation tools is highly manual. Each of the 20,306 SNOMED codes contained in the GDPPR pertaining to diagnosis would have to be fed into translation tools manually. Combined with the selectiveness of GP records not leading to a good representation of health conditions, the manual conversion of SNOMED codes was not further explored.
Finally, issues in granularity of health condition descriptors across data sources were problematic. ICD-10 chapters are very broad and contain scope for health conditions to vary in severity and rendered impairment. Where it is possible to group specialised codes into these wider brackets, moving from an assignment that is very broad to very specific is not.
Two codes within the same chapter can indicate two entirely different conditions. For example, lactose intolerance and cystic fibrosis are both members of the same ICD-10 chapter: endocrine, nutritional and metabolic diseases. The severity – and arguably the capacity to render an individual impaired – of these conditions differ greatly. When considering conditions related to vision for example, conjunctivitis is bundled into the same chapter as binocular blindness.
It was therefore advised to not translate ICD-10 chapters into SNOMED clusters to avoid misassignment of impairment types.
Conclusions of strategy 1
Exploring the HSE provided a strong foundation for investigating linkages between health conditions, impairment types and wider sociodemographic data.
We revealed a varying compositional complexity of health conditions within specific impairment types as well as clustering of impairment types in individuals reporting multiple impairments.
We developed performant logistic regression models capable of predicting an individual’s impairment type. These models would be fit for purpose if applied to datasets of a similar composition. Sociodemographic variables were chosen to align with those available via the census in the PHDA.
However, barriers to implementation were encountered when translation health condition data between HSE and the PHDA. The implementation in the PHDA was hindered by the lower level of detail of health data in the HSE in which the predictive models were developed on the one hand, and the different selection and coding of the health condition information within the PHDA compared with the HSE on the other hand.
Given those barriers related to the restricted nature of medical codes within the GDPPR and different classification codes used across data sources, implementation of predictive modelling in the PHDA would be prone to miscategorising impairments. Predictive modelling techniques would be highly effective if the ambiguity in medical condition coding could be resolved. They represent a promising avenue of future research.
Back to table of contents6. Strategy 2: finding proxies for impairment type in existing administrative health data using expert clinical knowledge
This approach examined using specific codes recorded in available administrative health data as proxy indicators for impairment types. If codes indicating certain conditions that were likely to result in a specific disability could be found, then impairment types could be attributed to those specific records.
In previous releases from the Office for National Statistics (ONS), existing codelists of medical origin from the QCOVID risk model, have been used to identify those with a learning disability. While considered a viable approach with appropriate labelling of groups identified, we acknowledged the ONS does not have the requisite medical expertise to assess the assignment of conditions to specific impairment types, particularly with highly detailed SNOMED codes. We therefore consulted experts in the academic and medical fields.
Network analysis presented in strategy 1 revealed varying complexity of health condition composition between impairment types. For example, mobility impairments were highly complex, particularly when compared with vision and hearing impairments. Consultation with a purpose-formed academic and clinical expert steering group resulted in focusing on the latter two impairment types to attempt to gain proof of concept of the direct assignment approach. This is because, except for mobility, vision and hearing impairment types were the only impairment types that featured health conditions within the eye and ear International Classification of Diseases: ICD-10 chapters, respectively. This helped direct focus for the assessment of available health data as a starting point to assess this strategy.
From an ethical standpoint, it is important to stress the complex nature of disability. By using only administrative health records to assign an impairment type, and acknowledging the absence of a sociodemographic context that could have been provided using predictive modelling, one is taking a medical approach to defining disability.
This approach differs from the understanding of disability under the Equality Act (2010) and differs from social model understandings of disability. Should this strategy be used within future analysis, the medical grounding of impairment indicators must be explicitly stated.
Assessing SNOMED Codes in GPES Data for Pandemic Planning and Research
Initial exploration of this strategy centred around SNOMED codes available within the GPES Data for Pandemic Planning and Research (GDPPR). Theoretically, all England residents should be registered to a GP, which ensures a wide population base. However, the GDPPR only contains a subset of potential SNOMED codes – and by extension medical conditions – that were deemed available and necessary from a COVID-19 perspective during the coronavirus pandemic and may not include relevant information necessary for this analysis. It is therefore important to assess whether the subset of codes encompass the breadth of the harmonised impairment types.
Of the 55,199 SNOMED codes contained in the GDPPR, 28,561 concern dispensary information, prescriptions, and medications. Medical experts, ranging in their roles from academia to acting clinicians and retired practitioners, were consulted on the breath and applicability of the remaining codes for analysis. Central to this were the 20,306 describing “diagnoses and findings (including resolved and remission)”.
SNOMED codes from GPES were extracted using the logic of whether a condition was likely to manifest as a given impairment. Our method employed probing published medical codelists and holding discussions with clinical experts to construct a list of key terms that could be used to interrogate GPES data for a list of SNOMED codes that may identify people with hearing or vision impairments.
Code lists from publications and phenotype libraries were collated for peer review by experts in the fields of hearing and vision. These lists were peer reviewed under the following criteria:
do the range of conditions presented capture the spectrum of conditions that could result in the specified impairment?
are the returned conditions likely to manifest as a given impairment?
is the condition unambiguous in its severity – if two individuals have the same condition, do both share a common impairment?
In addition, the GDPPR codes were discussed with medical coding professionals from NHS Digital. Though no dedicated automated tool for translation exists, technical experts were able to return 10,864 unique SNOMED CT concepts that map to ICD-10 codes. Of these, 9,520 concepts matched to a singular code, 796 concepts mapped to more than one code, and the remaining concepts mapped to excuse codes, which means they require alternative maps to enable translation from a single SNOMED CT concept to a single ICD-10 code.
In 2020 to 2021, in excess of 4.25 billion entries were recorded against more than 126,000 SNOMED codes, a much greater number than those included in the GDPPR. Only 80.3% of those codes are available on a national level. The 10,864 codes present in the GDPPR that were translatable therefore represent a subset of codes in active circulation.
Moreover, clinical experts noted that the identified SNOMED codes, which were available within the GDPPR, were not representative of common underlying conditions often associated with hearing or vision impairment.
As a result, we consider that GDPPR data are unreliable for identifying specific populations of those with a hearing of vision impairment. This does not detract from their usefulness in establishing COVID-19 comorbidity risk factors and aid in pandemic planning and research – as was their initial purpose – only their capability of providing resolution to more nuanced harmonised impairment types.
Assessing ICD-10 Codes in Hospital Episode Statistics
The Hospital Episode Statistics (HES) records comprise ICD-10 codes. The HES dataset has the potential to include all ICD-10 codes, as opposed to the subset of codes represented in GPES. This presents a trade-off between the smaller population covered by hospital episodes discussed previously but a more complete – and arguably more applicable – set of medical codes. HES codes may capture conditions that are more representative of an individual’s impairment status but identify fewer individuals than GPES.
The nature of how a HES record arises must be considered. In a hospital context, an ICD-10 code is recorded upon diagnosis during a singular hospital episode. Questions are therefore raised about whether the underlying cause of a hospital episode is either related to or captures an individual’s impairment status. For example, if a patient were treated for physical traumas that may cause a mobility impairment, but prior to admission and after subsequent treatment suffered no mobility impairment, they could be misclassified. Further, a patient may be admitted to hospital for reasons entirely unrelated to their impairment.
Vision impairment: direct assignment
The direct assignment approach covers flagging a record as vision impaired if there is presence of a specific health condition in HES records. Based on descriptive analysis described in strategy 1 and discussion with academic and clinical experts, vision impairment represented a viable candidate for assessing the feasibility of the direct assignment method.
All ICD-10 codes relating to ICD chapter called “diseases of the eye and adnexa” were presented to experts in the field of vision impairment. Almost all of these codes were deemed not suitable for these purposes and considered not to reflect visual impairment. The major limitation of these codes was that they reflect diagnoses and not a manifest impairment. For example, age-related macular degeneration and glaucoma can both exist with either no visual impairment or severe visual impairment, with no diagnostic codes that accurately separate these by severity.
Further, codes are not assigned to one or both eyes. Someone may be blind in one eye because of a coded disease, but their other eye may remain unaffected. In such a case, that individual may not be considered visually impaired in their day-to-day activities.
However, ICD-10 codes that explicitly mention visual impairment were deemed appropriate for proof-of-concept use. If this were to be applied to other impairments, it was decided that codes must again explicitly use the impairment terminology to avoid conflation of severity arising from codes reflecting diagnoses.
The ICD-10 codes and descriptions used for deduction of visual impairment from HES records were:
H541: Severe visual impairment, binocular
H542: Moderate visual impairment, binocular
H544: Blindness, monocular
H545: Severe visual impairment, monocular
H546: Moderate visual impairment, monocular
H549: Unspecified visual impairment (binocular)
HES records were scraped for inclusion of these codes in both primary and secondary diagnosis fields from 2011 to 2020. Searches identified 140,227 individuals in the Public Health Data Asset (PHDA) with these codes, indicating a visually impaired population based on identification via hospital records.
To assess how well this search captures the visually impaired population we must understand current demographic estimates of the visually impaired population. Breakdowns of the PHDA subset were calculated by age, sex, disability and region. Where possible, these were compared with demographics identified in the Royal National Institute of Blind People (RNIB) Sight Loss Data Tool.
Based on data for 2019 to 2020 for England, the sight loss data tool estimates that the total number of people living with sight loss totals 1.84 million. Of that 1.84 million, 1.19 million experience mild sight loss, 411,000 experience moderate sight loss, and 245,000 experience severe sight loss or blindness. Considering the identification via Hospital Episode Data, it is not surprising that the population returned within the PHDA is smaller than estimates by the RNIB. In line with the RNIB Sight Loss Data Tool, NHS estimate 2 million individuals currently living in the UK experience sight loss, with 340,000 of those registered as blind or partially sighted.
Any population extracted with the outlined method in this report will be subject to having had a hospitalisation episode and their vision condition coded correctly, which in many cases requires a condition pertinent to hospital audits and re-imbursement. Therefore, absence of a code for visual impairment does not equate to absence of a condition with certainty. Given our selection of ICD-10 codes with a focus on moderate to severe visual impairment and the population coverage of HES records, any sample extracted will represent an underestimation in terms of prevalence of the impairment in general population. However, such a sample may provide adequate data to understand association with health outcomes and mortality.
Alternative methods of identifying a vision impaired population have been discussed but are yet to be explored. HES records also contain procedure codes. There is potential to attempt to identify individuals that have had procedures related to visual impairments. However, given that treatments are likely to be performed with the goal of preventing individuals from becoming visually impaired, the validity of this approach remains debatable.
Hearing impairment: direct assignment
An identical approach, with hearing-applicable medical codes, was used to infer hearing impairment. Consultation with experts revealed that issues that were present within the field of vision impairment were not as prevalent in the hearing impairment field. Codes that mention sensorineural hearing loss or the fitting of a hearing aid would represent individuals with a hearing impairment. Loss of hearing in either one or both ears was also considered to yield an impairment.
ICD-10 codes that explicitly mentioned sensorineural hearing loss were deemed specific enough to extract a population from the PHDA. These were:
H903: Sensorineural hearing loss, bilateral
H904: Sensorineural hearing loss, unilateral with unrestricted hearing on the contralateral side
H905: Sensorineural hearing loss, unspecified
H906: Mixed conductive and sensorineural hearing loss, bilateral
H907: Mixed conductive and sensorineural hearing loss, unilateral with unrestricted hearing on the contralateral side
H908: Mixed conductive and sensorineural hearing loss, unspecified
H918: Other specified hearing loss
H919: Hearing loss, unspecified
The codes listed return a population of 502,195 individuals from the PHDA, which should prove sufficient in size for use in an updated COVID-19 mortality analysis. Similar demographic breakdowns to vision impairments are presented in the dataset. This population could be further refined with the use of OPCS codes describing the fitting of a hearing aid.
The Royal National Institute for Deaf People (RNID) suggest that 12 million adults in the UK have hearing loss greater than 25 decibels hearing level (dBHL), and 1.2 million people have hearing loss greater than 65 dBHL. Similarly to vision, our extracted population constitutes an underestimation in terms of prevalence of the impairment in general population and should not be used as such. However, the identified population based on hospital records may again provide information to examine the association of hearing impairment with outcomes such as mortality within the PHDA.
Conclusions of strategy 2
In this strategy we have explored the concept of assigning impairment types based on administrative health data.
The representativeness of the subset of SNOMED codes available in GPES Data for Pandemic Planning and Research (GDPPR) data proved a poor fit for this approach. The included diagnosis codes lacked the scope of impairment types we were looking for or occurred on a scale of severity that made inference of whether an individual would be impaired ambiguous. Similar barriers were present in the use of Hospital Episode Statistics (HES) records.
To use the explored example of vision impairments, ophthalmologists were sceptical of the use of diagnosis codes to infer visual impairment. A primary reason for this was the scope of severity on which a condition can occur. An individual experiencing a cataract for example, can have a vastly different standard of vision to a second individual diagnosed with the same condition. Ophthalmologists expressed that most patients treated are not vision impaired and it is their job to ensure that they stay that way.
It was only by use of codes that specifically mention visual impairment that we were able to extract a selection of the population of people who may be visually impaired from the PHDA based on HES. A similar exercise of codes in HES for the identification of those with a hearing impairment was also performed.
Diagnosis codes in available hospital records (HES data) in the PHDA were not designed for our intended use case. This direct assignment approach may prove viable for a small selection of impairment types but is unlikely to be effective for all impairment types. While this may have some validity for visually and hearing-impaired individuals, similarly explicit codes may not be present in other ICD condition chapters and those chapters may not correlate as completely as “diseases of the eye and adnexa” did with visual impairment. For example, distinguishing between conditions causing less compositionally distinct impairment types such as mobility, stamina and dexterity may prove increasingly difficult. Exploring alternative coding approaches such as the use of procedure or referral codes may contribute to this approach but is yet to be explored.
Further, it requires confidence that the comparison groups are distinct from one another; hearing impaired individuals must be hearing impaired and the reference group for that outcome must categorically not be hearing impaired. The codes that we have established for hearing and vision impairments identify an underestimate of actual population sizes and do not guarantee capture of all impaired individuals as they are selected on hospital records.
To consider these flags for use in future COVID-19 analysis requires an assessment of representativeness of the populations extracted using the described diagnosis codes. Any future analysis making use of such indicators should clearly indicate the nature and selectiveness of the population identified and not use the indicators to discuss prevalence of impairment in the general population. However, the direct assignment method offers an opportunity to gain greater insight into the effect of COVID-19 on people with these specific impairment types.
Back to table of contents7. Strategy 3: an overview of using alternative linked data to identify the disabled population
Throughout meetings with the expert groups several potential alternative data sources were identified. Opportunities with different data sources are described in this section. Each are dependent on ethical approval and data-sharing agreements with the relevant bodies.
Annual Population Survey
The Annual Population Survey (APS) acts as one of the main population surveys in the UK and collects data on disability according to the harmonised standard, as well as information on the underlying health conditions and impairments of those people who indicate they have a long-standing illness.
The 2017 to 2019 three-year pooled APS, with a sample size of approximately 500,000 people, was put forward as the main candidate to test linkage. Linkage would enable analysis of health outcomes and deaths of those groups reporting impairments in the APS. The training of a predictive model of impairment type on the Public Health Data Asset (PHDA) linked APS sample, analogous to strategy 1, could be rolled out to predict functioning indicators for the remaining PHDA-sample.
DWP benefit data
Different benefits are provided by the Department for Work and Pensions (DWP), some of which may be used more by disabled people and those with specific impairments or activity limitations. For example, Personal Independence Payments (PIP) focus on providing help with extra living costs for those who have a long-term physical or mental health condition or disability and difficulty doing certain everyday tasks or getting around because of their condition. PIP has two elements, a daily living part and a mobility part, the latter of which may aid in identifying those people who experience difficulties with mobility.
As part of a Shared Outcomes Fund project to understand the long-term employment and health outcomes because of coronavirus (COVID-19) on disproportionately impacted groups, the Department of Health and Social Care (DHSC), DWP, Cabinet Office and the Office for National Statistics (ONS) are currently working towards linking benefits and earnings data from HM Revenue and Customs and DWP to the PHDA. This presents a unique opportunity to understand health and employment outcomes for working age adults in England. This has the potential to add an identification strategy of those groups with particular impairments, subject to shared data agreements and appropriate permissions.
Certificate for visual impairment data
When sight loss reaches certain levels, one can be certified as severely sight impaired or sight impaired by an eye specialist (ophthalmologist). In England, if the person agrees, a copy of the Certification of Vision Impairment (CVI) form is sent to the person’s local council, their GP, and Moorfields Eye Hospital. The Royal College of Ophthalmologists Certifications Office at Moorfields Eye Hospital collects information on eye conditions to improve eye care and services. Similar certificates and systems are available in Wales, Scotland and Northern Ireland.
The information of the CVI provides essential data on eye health and sight loss as part of the Public Health Outcomes Framework. Linkage of such data repository of visual impairment to the PHDA may be an option to ensure coherence in identification of those with visual impairment across statistics producers.
Expanding existing data
Further to linking additional data sources to the PHDA, the collection of future iterations of existing linked data could be expanded. For instance, adoption of the harmonised impairment standard in future census studies would provide a population-wide perspective of impairment. It would also avoid one of the major obstacles of this study in reconciling the different definitions of disability and impairment in social and medical contexts.
Additions could also be made to GP data. The use of SNOMED codes for specific impairment types could be supported, as well as the adoption of the International Classification of Functioning, Disability and Health (ICF) within administrative health records approach to classifying disability in their patients. Presence of either of these metrics in GPES and their subsequent linkage to the PHDA would have been highly beneficial in this project.
Back to table of contents8. International context and framework on disability
The UN Convention on the Rights of Persons with Disabilities and the conceptual framework set out in the World Health Organization’s (WHO’s) International Classification of Functioning, Disability and Health (ICF) underpin the international understanding of disability. In line with those approaches, disability and functioning are described as the result of interactions between an individual’s health condition and their environment.
Figure 4 presents the model of disability that is the basis for the ICF, also known as the biopsychosocial model of disability. The model synthesises insights from different conceptual models of disability and acknowledges the interaction between both features of a person and of the overall context in which the person lives.
Figure 4: Biopsychosocial model of disability as understood in the WHO’s International Classification of Functioning, Disability and Health (ICF)
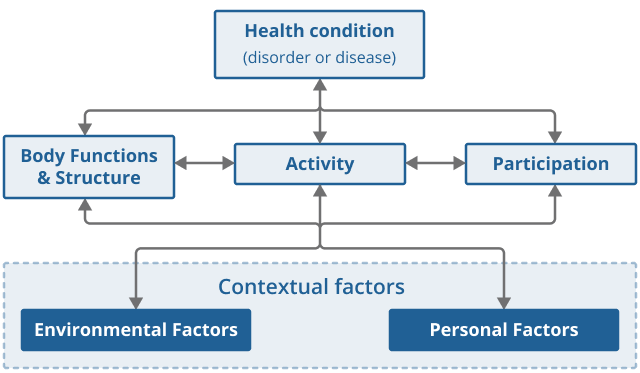
Source: World Health Organization – International Classification of Functioning, Disability and Health
Download this image Figure 4: Biopsychosocial model of disability as understood in the WHO’s International Classification of Functioning, Disability and Health (ICF)
.png (23.6 kB)
To determine if an individual should be counted as disabled statistically in line with the ICF, one ideally has data on:
their health condition or impairment
whether in their current circumstances, the combination of those aspects renders a restriction on their daily activities or participation in society
9. Acknowledgements and collaboration
Throughout the course of this research, we have collaborated with academic experts and medical professionals. The contributions of the following people have proved invaluable to the steering and development of our research strategies:
Professor Hannah Kuper, Professor of Epidemiology, London School of Hygiene and Tropical Medicine
Dr Helen Strongman, Associate Professor, London School of Hygiene and Tropical Medicine
Dr Helen McDonald, Associate Professor, London School of Hygiene and Tropical Medicine
Professor Matthew Burton, Professor of Global Eye Health, London School of Hygiene and Tropical Medicine, and Moorfields Eye Hospital
Mr Anthony Khawaja, Consultant Ophthalmic Surgeon, Moorfields Eye Hospital
Professor Kevin Munro, Professor of Audiology, Director of the Manchester Centre for Audiology and Deafness, Hearing Theme Health Lead, University of Manchester
Professor Piers Dawes, Professor of Audiology, University of Queensland
Hazel Brear, Principal Classifications Specialist, NHS Digital
Kathryn Salt, Head of Service: Open Data and Publications, NHS Digital
Marc Verlot, Cabinet Office Disability Unit
Dr Rohan Allen, Cabinet Office Disability Unit
10. Data
Improving disability data to understand the effects of coronavirus (COVID-19)
Dataset | Released 7 June 2022
Strategies exploring the use of predictive modelling and administrative data to provide more detail on the effects of coronavirus (COVID-19) on disabled people by impairment type.
11. Glossary
Area under the curve (AUC)
AUC is the ability for a classifier to distinguish between classes. It is calculated by comparing true negatives, true positives, false negatives, and false positives within a confusion matrix.
Bootstrap aggregation
Bootstrap aggregation is the equivalent of estimating quantities – in a similar approach to taking the mean average – of entire statistical models. Multiple samples and subsets of variables from training data partitions are used to construct models for each data samples.
Classification
Classification refers to a predictive modelling problem where an outcome group, in this study an impairment type, is predicted from a given input of data. More explicitly, binary classification tasks refer to classification tasks that have two outcomes, for example, impaired or not impaired. Appropriate algorithms for these cases are logistic regressions and decision trees.
Confusion matrix
A confusion matrix is a specific table layout that allows visualisation of the performance of a supervised machine learning algorithm. It represents counts from predicted and actual values, or true and false positives or negatives. True values correctly predict the outcome and false values incorrectly predict an outcome. For example, a true positive is a positive value that was classified accurate, where a false positive is a positive classification that was predicted incorrectly as a negative.
Lambda value
The lambda value describes the degree of variable shrinkage in a penalised regression model. The best lambda for the data in question can be defined as the lambda that minimises the cross-validation prediction error rate. Cross-validation is used in model selection to test the error of a predictive model. The lambda is procedurally generated and is a supervised means of fine-tuning model parameters.
LASSO logistic regression
Least Absolute Shrinkage and Selection Operator (LASSO) regression is a penalised logistic regression model that can provide more accurate predictions. Here, regularisation is used to avoid overfitting of the data. This is achieved by adding a penalty term, or lambda value, to the best fit of the model to limit variance and restrict the influence of less important predictor variables. This type of regression is useful in cases of multicollinearity or for automating aspects of model selection such as variable selection or parameter elimination.
Logistic regression
A logistic regression is a predictive analysis used to describe data and to explain the relationship between one dependent binary variable and one or more nominal, ordinal, interval, or ratio-level independent variables.
Network analysis
A network describes a structure representing a group of objects or people and the relationships between them. It can also be referred to as a graph in mathematics. A network structure consists of both nodes and edges. Nodes represent objects to be analysed, in this case impairment types, while edges depict the relationships between those objects. By analysing these networks, we can understand how objects are related to, or linked to, one another.
Phenotype
A phenotype describes a set of observable traits or characteristics. In a medical context, this may describe a physical symptom or condition.
Random forest decision tree
Decision trees are a type of model used for both classification and regression. Random forests are collections of decision trees whose results are aggregated into one final result. Randomness is introduced to creating decision tree models to build more different trees, so that when combining their prediction results, a better estimate of the true output is generated.
Train-test split
A train-test split is a technique for evaluating the performance of a machine learning algorithm or model. It concerns taking a dataset and dividing it into two subsets, test and train. Models are fine-tuned on the train split while the test split is retained to assess the performance of the model. The test split gives an indication of how well the model will perform on unseen data.
Upset plot
Upset plots are linear projections of a Venn diagram. They arrange co-occurring variables into groups and displays and show a bar chart of their frequency. In our case, the bar chart depicts the frequency of an impairment type, while the grid below shows the impairment type or type the bar refers to. A singular point in the grid denotes a single impairment type. Multiple data points vertically connected in the grid shows linkages between those impairment types.
Back to table of contents