Table of contents
- Main points
- Statistician’s comment
- Summary
- In recent periods, UK consumer and producer price inflation have followed the path of the sterling effective exchange rate
- Higher import intensity products are more sensitive to exchange rate movements
- Oil price often feeds into producer and consumer price indices
- In recent months, house prices continued to grow in the north of England, while the south saw prices levelling out
- Authors
1. Main points
The 12-month growth rate of the Consumer Prices Index including owner occupiers’ housing costs (CPIH) fell to 1.7% in August 2019, down from 2.0% in July 2019.
The input Producer Price Index (input PPI) fell by 0.8% in the 12 months to August 2019, down from a rise of 0.9% in the 12 months to July 2019.
The output Producer Price Index (output PPI) grew by 1.6% in the 12 months to August 2019, down from a growth of 1.9% in the 12 months to July 2019.
Producer and consumer prices have followed the path of the sterling effective exchange rate in recent months.
In recent months, house prices in the north of England have continued to rise, while in the south they have levelled out.
2. Statistician’s comment
Commenting on today’s figures, ONS head of inflation Mike Hardie said:
“The inflation rate has fallen noticeably into August, to its lowest rate since late 2016. This was driven mainly by a decrease in computer game prices, plus clothing prices rising by less than last year after the end of the summer sales.
“Annual growth in house prices slowed to its lowest rate since September 2012, with four of the nine English regions now seeing prices falling over the year.”
Back to table of contents3. Summary
Understanding the drivers of inflation is important from a monetary policy perspective. The Bank of England monitors inflation and growth in the UK economy in order to set the Bank interest rate. Currently the Bank of England targets a Consumer Prices Index (CPI) 12-month growth rate of 2%. The Bank of England expects growth in the UK to remain soft owing to the uncertainty regarding the UK’s exit from the EU, and for inflation to fall in the near term, reflecting lower energy prices. Monitoring inflation is also important from the labour market perspective as an inflation rate lower than nominal earnings growth leads to real rises in wages of workers.
Today’s (18 September 2019) inflation figures are in line with the Bank of England’s inflation expectations. Figure 1 shows that the 12-month growth rate of the Consumer Prices Index including owner occupiers’ housing costs (CPIH) was 1.7% in August 2019, down from 2.0% in July 2019. This is the lowest rate since November 2016.
The largest downward contributions to the change in the 12-month rate came from games, toys and hobbies, clothing and footwear, cultural services and sea fares. These downward effects were partly offset by upward contributions from air fares and, to a lesser extent, from food and non-alcoholic beverages.
The input Producer Price Index (input PPI) fell by 0.8% in the 12 months to August 2019, down from a rise of 0.9% in the 12 months to July 2019. Crude oil provided the largest downward contribution to the change in the 12-month growth rate.
The output Producer Price Index (output PPI) grew by 1.6% in the 12 months to August 2019, down from a growth of 1.9% in the 12 months to July 2019. Eight out of ten product groups provided upward contributions to the annual rate of output inflation, with petroleum, and chemicals and pharmaceuticals being the only groups providing a downward contribution.
Figure 1: The 12-month growth rates of CPIH, input PPI and output PPI all fell between July 2019 and August 2019
12-month growth rates for input Producer Price Index (PPI) (left-hand side), output PPI (left-hand side), and CPIH (right-hand side), UK, August 2010 to August 2019

Source: Office for National Statistics – Producer Price Index and Consumer Prices Index including owner occupiers' housing costs
Notes:
- These data are also available within the Dashboard: Understanding the UK Economy.
Download this image Figure 1: The 12-month growth rates of CPIH, input PPI and output PPI all fell between July 2019 and August 2019
.png (15.1 kB) .xlsx (21.6 kB)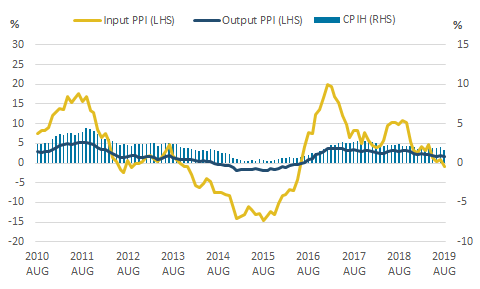
4. In recent periods, UK consumer and producer price inflation have followed the path of the sterling effective exchange rate
Uncertainty surrounding the UK’s exit from the EU has resulted in volatility in the sterling effective exchange rate in recent periods. However, as Figure 2 shows, this volatility is not unprecedented.
Understanding exchange rate movements is important because these are transmitted to import prices and then to final consumer prices via several channels, both direct and indirect. Inflation may be influenced directly – by higher prices of goods imported for direct consumption, as well as indirectly – through changes in the costs of imported goods, which are subsequently used as inputs into domestic production. The extent of the exchange rate passthrough, keeping all other things equal, is smaller and takes longer to materialise for consumer products that use fewer imported components and that have more stages in the production process.
There are many other factors that also influence the extent and speed of the exchange rate passthrough, from the cause of the appreciation or depreciation, to the expectations about its persistence and to firms’ market power and pricing strategy. More detailed analysis on extent and speed of exchange rate passthrough to consumer prices for different types of products, or products with different import intensities, can be found in Exchange rate passthrough and transmission to consumer prices following the 2015 to 2016 depreciation of sterling.
Figure 2 plots an inverted sterling effective exchange rate index such that an increase on the chart corresponds to a fall in the value of sterling, which would be expected to increase the growth rate of inflation, all else being equal, while the opposite is true for a fall in the inverted effective exchange rate.
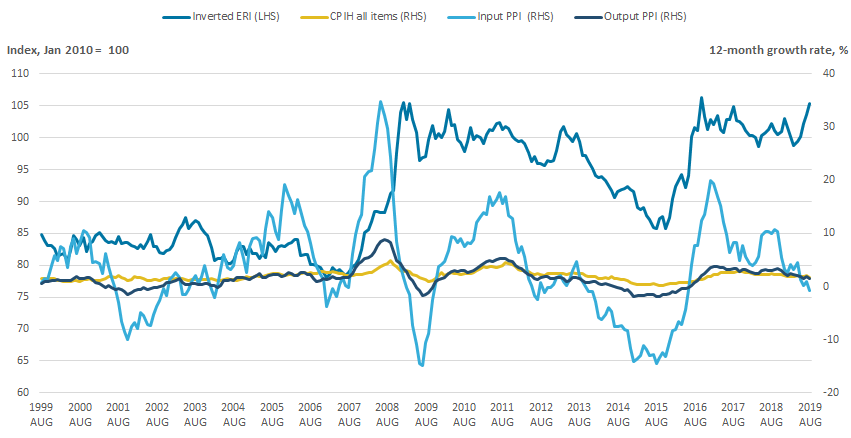
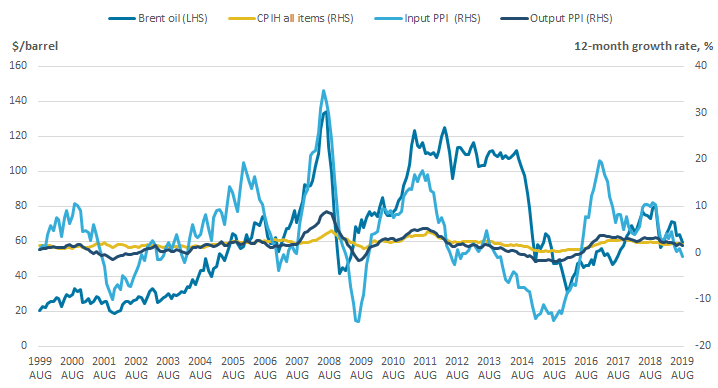
Figure 2: Changes in sterling's value affect producer price inflation more quickly and with a larger magnitude than consumer prices
CPIH all items, input PPI, output PPI 12-month growth rates (right-hand side) and inverted sterling effective exchange rate index (left-hand side), August 1999 to August 2019
Source: Office for National Statistics – Producer Price Index and Consumer Prices Index including owner occupiers' housing costs, Bank of England – Research Database
Download this image Figure 2: Changes in sterling's value affect producer price inflation more quickly and with a larger magnitude than consumer prices
.png (53.4 kB) .xlsx (26.7 kB)
Figure 2 shows movements in the value of sterling to be reflected more closely and in greater magnitude in producer price inflation compared with consumer price inflation. When sterling depreciated in 2007 and 2015, for example, input producer price inflation started to increase before output producer price inflation, which in turn started increasing before consumer price inflation. Input producer price inflation increased the most following the depreciation of sterling in 2007 and 2015, followed by output producer price inflation and then consumer price inflation. However, the same effect on price inflation did not hold when sterling appreciated in 2012 and 2014.
Inflation rates have reflected changes in sterling’s value closely since the economic downturn, with appreciations (depreciations) of sterling corresponding to falls (increases) in the inflation rate. Sterling started depreciating in late 2007, and inflation rates started to increase in early 2008 during the economic downturn. Inflation rates slowed down in late 2011 and early 2012 following the appreciation of sterling. Inflation rates slowed down further after sterling appreciated more in late 2013, 2014 and early 2015. Following the depreciation of sterling after the result of the 2016 referendum on the UK’s membership of the EU, inflation rates started increasing.
However, the relationship between exchange rate and inflation is not that straightforward. Figure 2 shows that before the 2008 economic downturn, the inflation rate followed the movements in the exchange rate less closely. The extent of the passthrough was even smaller in late 2002 and early 2003. Inflation rates also did not fall following the appreciation of sterling in late 2006. Thus, the extent and speed of exchange rate passthrough is not constant over the period. Not only do factors affecting the exchange rate passthrough change over time, there are other factors that affect consumer and producer price inflation, which may have stronger and opposing effects.
Back to table of contents5. Higher import intensity products are more sensitive to exchange rate movements
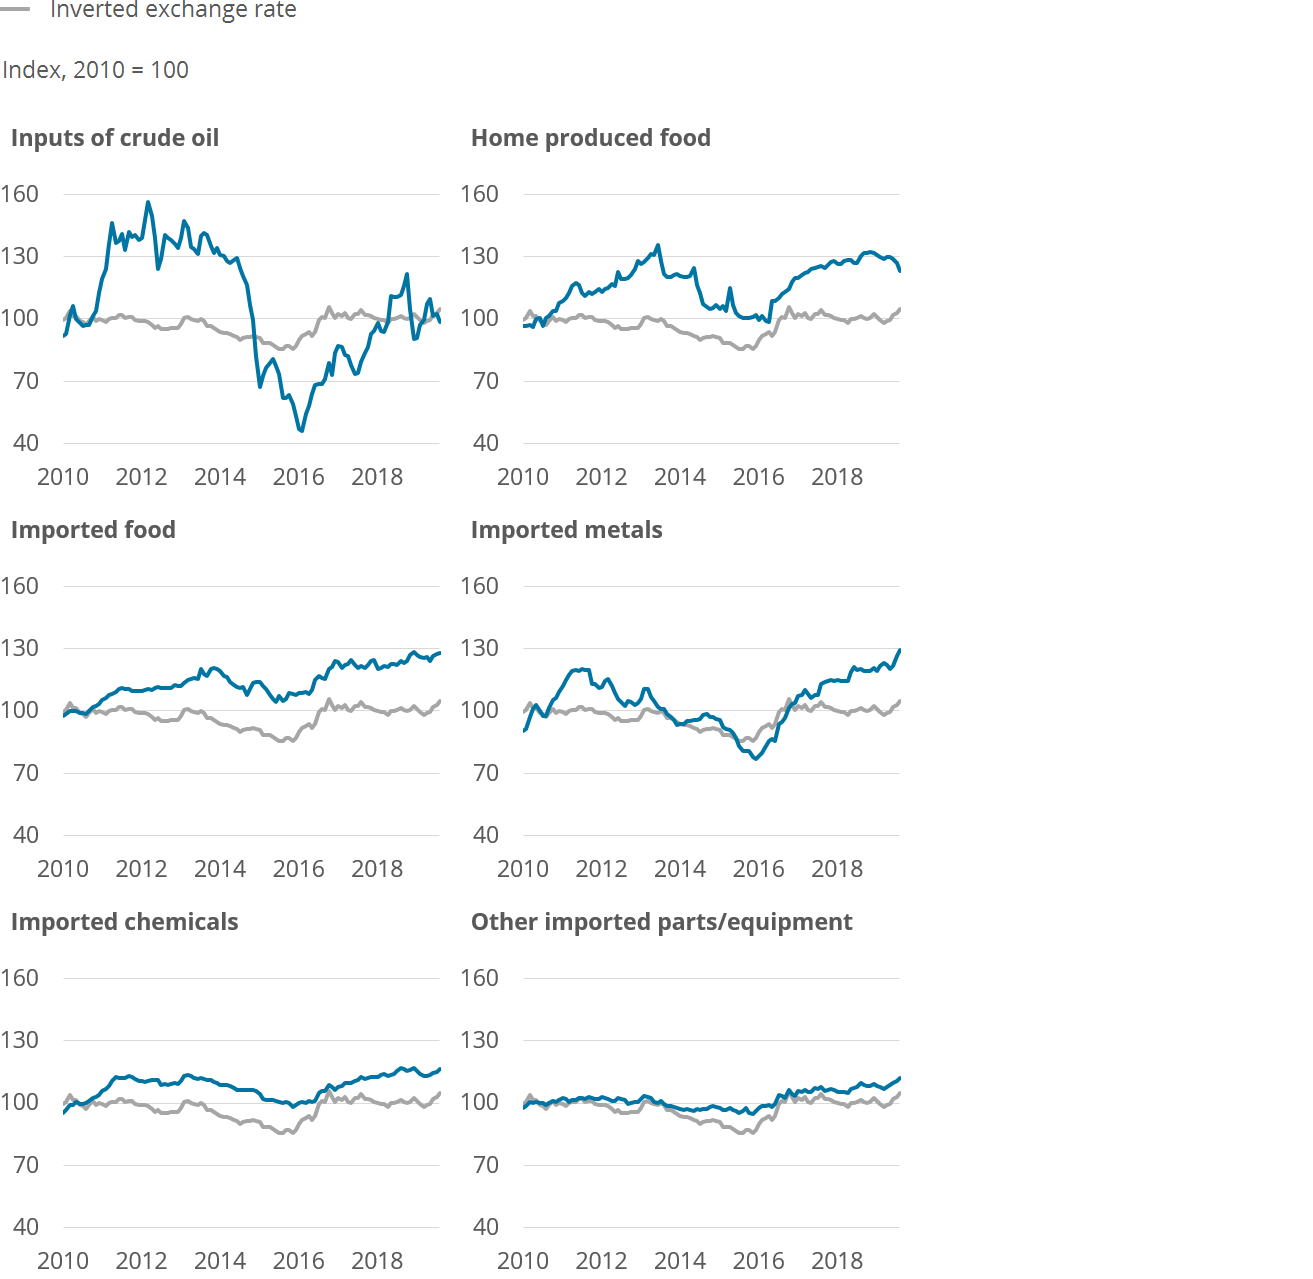
Figure 3 shows the inverted sterling effective exchange rate index and selected input Producer Price Indices (PPI) by product. It shows that most of the products are affected by changes in sterling’s value.
While exchange rate movements affect the input price of crude oil to some extent, the price is driven largely by the market price. The exchange rate passthrough is more visible for other imported parts or equipment, and for imported metals and imported chemicals, although with some lag. The extent of the exchange rate passthrough is smaller for imported food.
Figure 3: Producer price inflation is more sensitive to exchange rate movements for higher import intensity products
Inverted sterling effective exchange rate and selected input Producer Price Indices by product, UK, January 2010 to August 2019
Source: Office for National Statistics – Producer Price Index, Bank of England – Research Database
Download this image Figure 3: Producer price inflation is more sensitive to exchange rate movements for higher import intensity products
.png (99.0 kB) .xlsx (22.9 kB)
Figure 4 shows the inverted sterling effective exchange rate index and selected classes of the Consumer Prices Index including owner occupiers’ housing costs (CPIH). The classes presented in Figure 4 have been chosen as they have the highest import intensities of all classes within CPIH.
Classes with higher import intensities, keeping all other things equal, should show a greater and quicker reaction to changes in sterling’s value. Meat, the class with the highest import intensity, shows a fall in inflation starting in late 2013 and ending in mid-2016 after sterling started appreciating in mid-2012 through to mid-2014. During the same period, a weaker effect can be seen in inflation rates of spare parts and accessories, and new cars. For major durables, the effect of movement in sterling’s value is reflected to a smaller extent. Figure 4 also shows that sterling’s appreciation from mid-2012 through to mid-2014 had little effect on inflation of footwear including repairs, and pharmaceutical products.
Figure 4: Consumer price inflation is also sensitive to exchange rate movements but the passthrough is of a lower magnitude compared with producer prices
Inverted sterling effective exchange rate (right-hand side) and selected classes of the Consumer Prices Indices including owner occupiers’ housing costs (CPIH) (left-hand side), UK, January 2010 to August 2019

Source: Office for National Statistics – Consumer Prices Index including owner occupiers' housing costs, Bank of England – Research Database
Download this image Figure 4: Consumer price inflation is also sensitive to exchange rate movements but the passthrough is of a lower magnitude compared with producer prices
.png (135.7 kB) .xlsx (22.5 kB)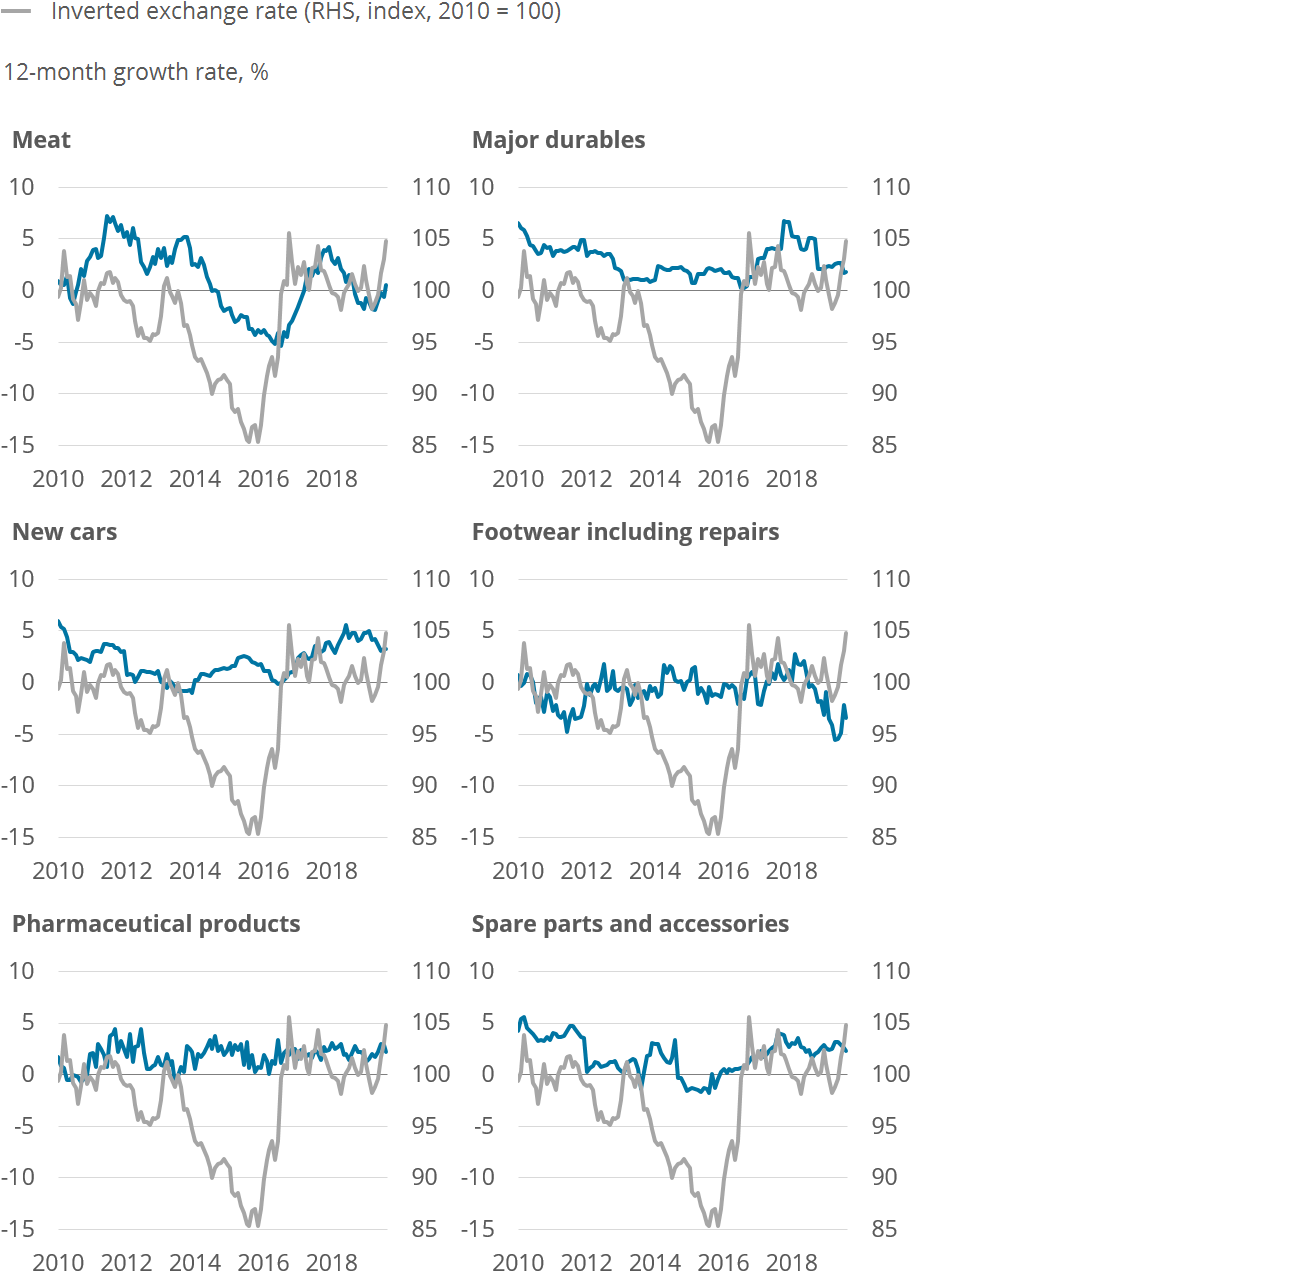
6. Oil price often feeds into producer and consumer price indices
Another driver of inflation is the price of crude oil, which is also affected by the exchange rate. Since oil is imported in US dollars, a depreciation of sterling makes importing oil more expensive, and hence feeds through to producer and consumer prices. However, even if the exchange rate is kept constant, an increase in the price of oil, for example, because of a shortage of oil supply, often also feeds through to producer and consumer prices, either via transport costs or if oil is an intermediary input.
Figure 5 shows the Crude oil, Brent price in US dollars per barrel against the 12-month growth rate of the Consumer Prices Index including owner occupiers’ housing costs (CPIH), input Producer Price Inflation (input PPI) and output Producer Price Inflation (output PPI). It shows that generally input PPI has followed the price of crude oil. Changes in the price of Brent are also reflected in output PPI and CPIH, but to a much lesser extent. Figure 5 also shows that the inflation rates were less affected by the price of Brent in 2016, which may have been because the effect of sterling depreciation was stronger then.
Figure 5: Input PPI, and to a lesser extent output PPI, and CPIH have generally followed the price of crude oil
CPIH all items, input PPI, output PPI 12-month growth rates (right-hand side) and Brent oil price (left-hand side), August 1999 to August 2019
Source: Office for National Statistics – Producer Price Index and Consumer Prices Index including owner occupiers' housing costs, World Bank – monthly commodity prices
Download this image Figure 5: Input PPI, and to a lesser extent output PPI, and CPIH have generally followed the price of crude oil
.png (33.5 kB) .xlsx (25.8 kB)
Figure 6 shows the Brent price index and selected classes of the input Producer Price Index. It shows that while all classes showed movement with changes in the price of Brent oil, certain classes of producer prices moved more than others between January 2010 and August 2019. For example, the magnitude of passthrough to imported metals was larger than that of other imported parts or equipment.
Figure 6: Some classes of producer prices are more sensitive to changes in the Brent oil price
Brent oil price index and selected input Producer Price Indices by product, UK, January 2010 to August 2019

Source: Office for National Statistics – Producer Price Index, World Bank – monthly commodity prices
Download this image Figure 6: Some classes of producer prices are more sensitive to changes in the Brent oil price
.png (110.5 kB) .xlsx (22.2 kB)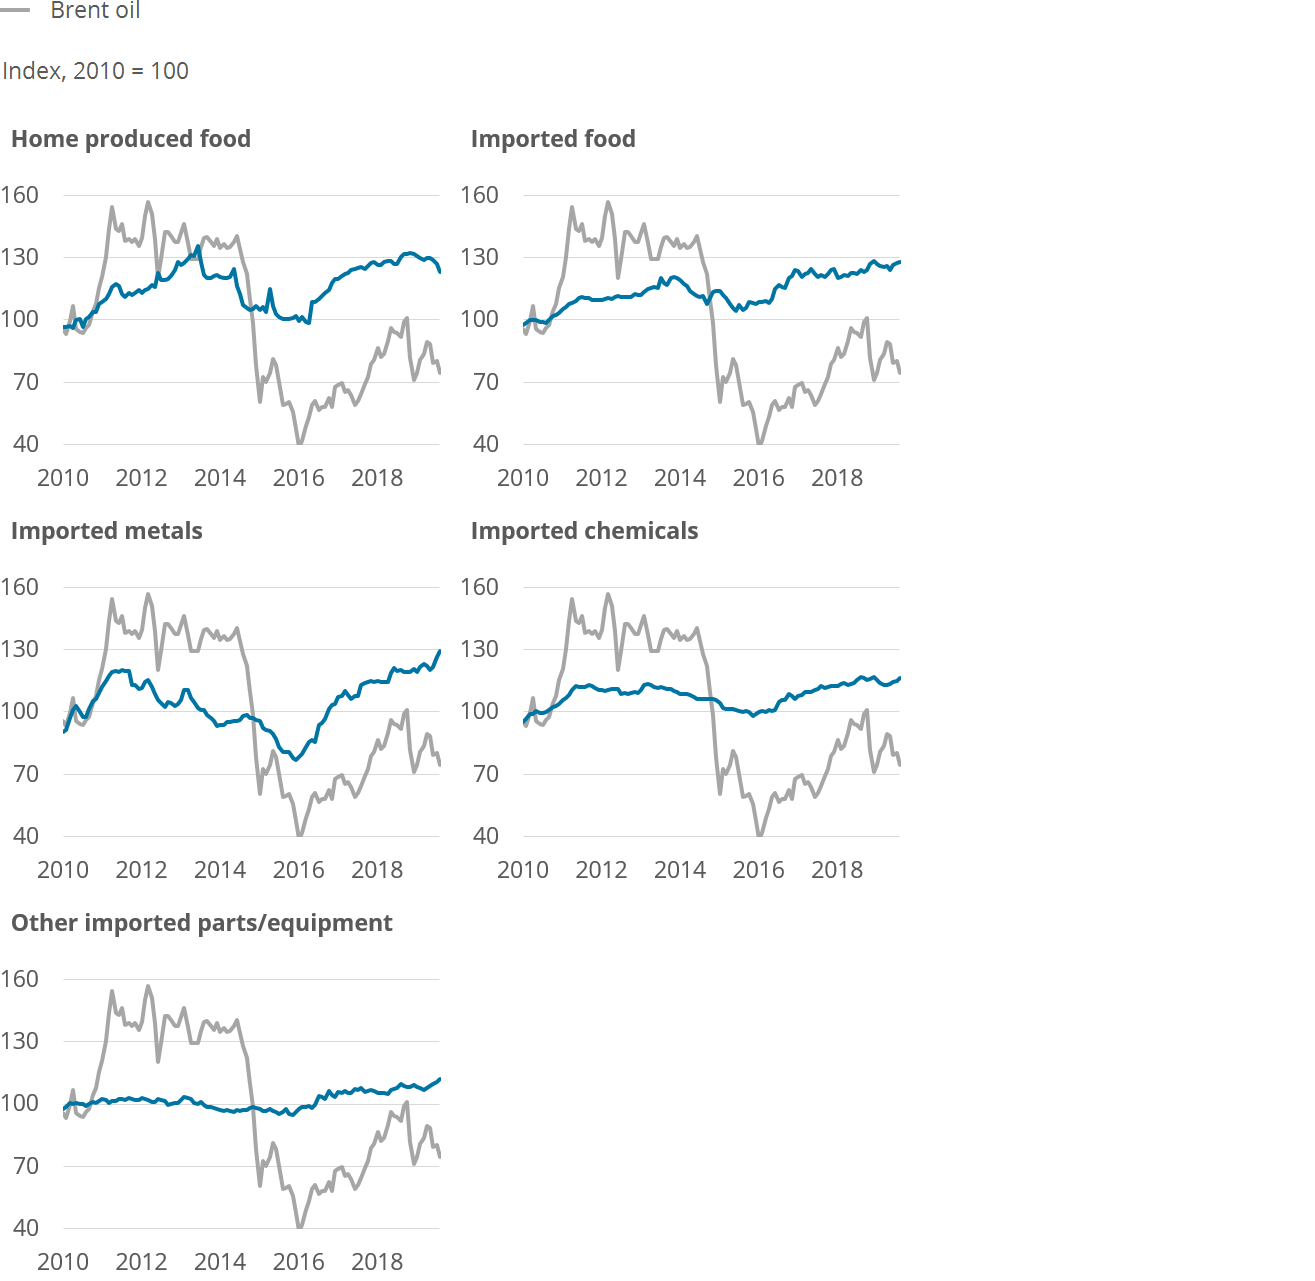
Figure 7 shows the Brent price index and selected classes of the Consumer Prices Index including owner occupiers’ housing costs (CPIH).
As for the producer price, certain classes of consumer prices were affected more by the changes in Brent price between January 2010 and August 2019. The fall in the price of Brent from mid-2014 to early 2015 was followed by falls in inflation rates of liquid fuels, fuels and lubricants, and transport by railway from late 2014 to early 2016. The inflation rate for passenger transport by road and other transport services followed the movement of the price of Brent from 2010 to 2013, but the inflation rate did not follow the Brent price in early 2017.
The inflation rates for passenger transport by air, and by sea and inland waterway are very volatile but have followed the same upward trend as the price of Brent from early and late 2016 onwards respectively.
The inflation rate for food follows the trend of oil price, possibly because of its transportation requiring oil as an intermediate input. However, as Figure 7 shows, the extent of exchange rate passthrough, keeping all other things equal, gets smaller and takes longer to materialise for consumer products than producer products using oil as an input.
Figure 7: The passthrough of changes in oil price to consumer prices is lesser in magnitude compared with producer prices
Brent oil price index (right-hand side) and selected Consumer Prices Indices including owner occupiers’ housing costs (CPIH) (left-hand side) by classes, UK, January 2010 to August 2019

Source: Office for National Statistics – Consumer Prices Index including owner occupiers' housing costs, World Bank – monthly commodity prices
Download this image Figure 7: The passthrough of changes in oil price to consumer prices is lesser in magnitude compared with producer prices
.png (119.1 kB) .xlsx (25.5 kB)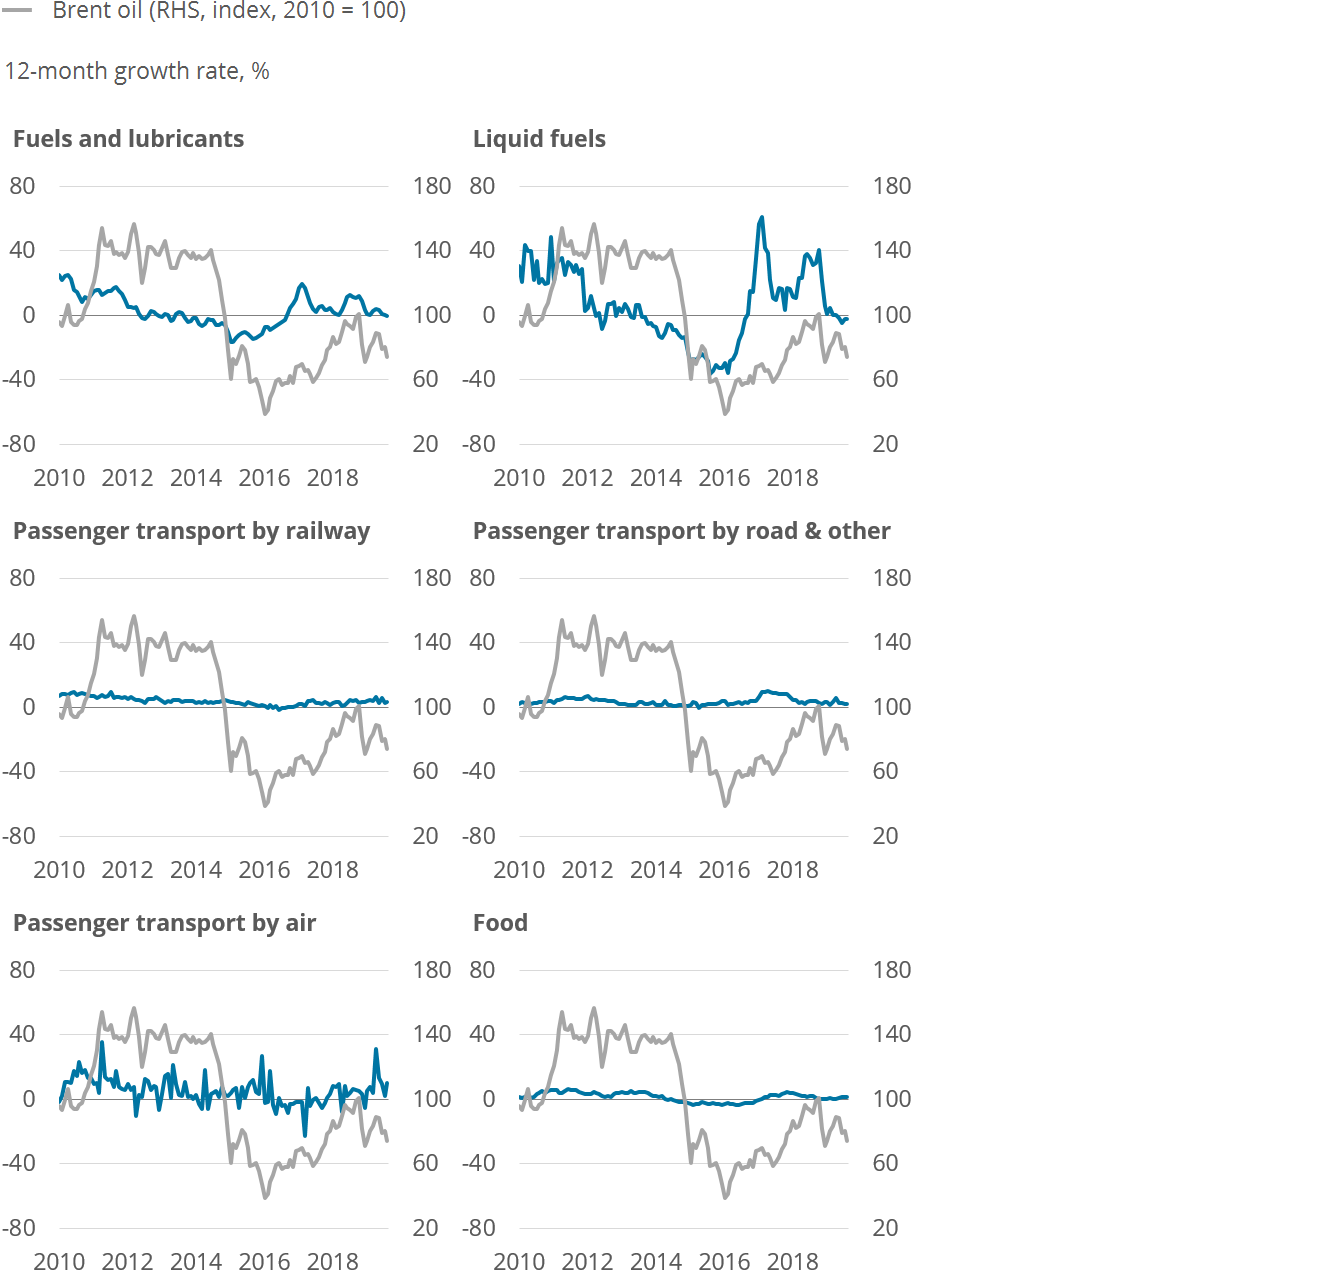
Passthrough of oil price to producer and consumer prices is not always straightforward. While oil price increases caused by a supply-side shock may increase the price of producer and consumer products via transportation costs or if oil is used as an intermediary product, demand-side shocks can have the reverse effect of reducing the price of oil if the demand for oil falls globally.
We should also note that exchange rate movement and price of oil are not the only factors that affect inflation. High inflation may also be driven by other factors such as wage pressures, inflationary pressure from domestic growth, and global events such as inflationary pressures caused by growth in the EU and the United States.
Back to table of contents7. In recent months, house prices continued to grow in the north of England, while the south saw prices levelling out
Consumer prices are a measure of cost of living faced by individuals. The 12-month growth rate of the Consumer Prices Index including owner occupiers’ housing costs (CPIH), includes owner occupied housing (OOH) costs in the measure as the name suggests. These are calculated using rental equivalence. While OOH gives a measure of the value of housing services consumed, we can also look at the direct measure of house prices using the House Price Index (HPI).
Figure 8 plots house price indices for selected regions of England: London, the north, and the south not including London, indexed to January 2015. Here north refers to the North East, North West, and Yorkshire and The Humber Nomenclature of Territorial Units for Statistics: NUTS1 regions, while south excluding London refers to the South East, South West and East of England NUTS1 regions. It shows that from January 2015 to June 2017, London house prices rose generally faster than those of the south excluding London and the north of England. Since then house prices in London and the south have generally flattened, while the north has seen a continuation of an upward trend. The 12-month growth rate in house prices for July 2019 was 1.7% for the north, negative 1.4% for London, and negative 0.8% for the south excluding London.
According to The Deloitte Consumer Tracker there is a difference in trajectory of confidence in the north compared with the south, and that among other factors house prices may have contributed to this. The boost in confidence in the north has also coincided with the Northern Powerhouse reaching a five-year milestone, which resulted in £13 billion investment in transport and the creation of 287,000 jobs.
In recent years, the gap between average house price in the north and south has persisted, with prices in July 2019 recorded at £294,237 in the south excluding London and £159,418 in the north of England. In fact, the price gap has increased by over £28,000 since January 2015.
Figure 8: House prices continued to grow in the north, while the south saw house price growth slow down
Indices for house prices in the north, London and the south not including London, January 2015 to July 2019, Index, January 2015 = 100
Source: Office for National Statistics, HM Land Registry – UK House Price Index
Notes:
North refers to North East, North West, and Yorkshire and the Humber.
South excluding London refers to South East, South West, and East of England.
Download this chart Figure 8: House prices continued to grow in the north, while the south saw house price growth slow down
Image .csv .xlsPrices in the North East of all types of properties (detached, semi-detached, terraced and flat) are still below their pre-downturn peak. In recent months, the North West, and Yorkshire and The Humber, on the other hand, experienced increasing house prices.
Back to table of contents