
Table of contents
- Key findings
- Summary
- Number of conceptions and conception rates
- Marital status at conception
- Age at conception
- Why do teenage conceptions matter?
- Conceptions leading to abortion
- Conceptions by area of usual residence
- Under 18 conceptions by area of usual residence
- Users and uses of conception statistics
- Further information
- References
- Background notes
- Methodology
1. Key findings
The under 18 conception rate for 2011 is the lowest since 1969 at 30.9 conceptions per thousand women aged 15–17
The estimated number of conceptions to women aged under 18 also fell to 31,051 in 2011 compared with 34,633 in 2010, a decrease of 10%
The estimated number of conceptions to girls aged under 16 was 5,991 in 2011, compared with 6,674 in 2010 (a fall of 10%)
In 2011 there were an estimated 909,109 conceptions, compared with 909,245 in 2010, a decrease of less than 0.1%
Conception rates in 2011 increased for women aged 30 years and over, stayed the same for women aged 25–29 and decreased for women aged under 25 years
2. Summary
This statistical bulletin presents estimated annual conceptions occurring to women usually resident in England and Wales in 2011. Conception statistics bring together records of birth registrations collected under the Births and Deaths Registration Act (1953) and abortion notifications received under the Abortion Act (1967), amended by the Human Fertilisation and Embryology Act (2008). They include all pregnancies of women usually resident in England and Wales which lead to one of the following outcomes:
a maternity registered in England and Wales at which one or more live births or stillbirths occur, or
a termination of a pregnancy by abortion under the 1967 Act, which takes place in England and Wales.
Conceptions do not include miscarriages or illegal abortions (see background note 2).
Conceptions are analysed primarily using numbers, rates and the percentage leading to abortion. The statistics are tabulated by age, area of usual residence of woman and marital status.
This is the first time that the Office for National Statistics (ONS) has published annual 2011 statistics on conceptions for women usually resident in England and Wales. Provisional under 18 quarterly data have previously been published to provide a more timely indication of trends to enable monitoring by local authorities on levels of teenage pregnancy. An explanation of the difference between provisional and final data is included in the metadata published as part of the Vital Statistics: Population and Health Reference Tables.
Conception rates for England and Wales 2002-2010 included in this publication have been calculated using revised mid-year population estimates which take account of the 2011 Census. Figures may therefore differ slightly from those previously published. The subnational conception rates for 2002-2010 will be revised in future releases following the population estimate revisions (to be published in March/April 2013) to take account of the 2011 Census.
Back to table of contents3. Number of conceptions and conception rates
In 2011, the estimated number of conceptions in England and Wales fell by less than 0.1% to 909,109 from 909,245 in 2010. Conceptions have generally been rising since 2001, despite falling slightly in 2008 and 2011. This is the second consecutive year where conceptions have exceeded 900,000 since the Abortion Act (1967) came into force. Prior to 1969, the first full year for which abortions data are available, the number of conceptions was equivalent to the number of maternities.
Figure 1: The number of conceptions (in thousands) and the conception rate in England and Wales, 1969–2011
Source: Office for National Statistics
Notes:
- Rates have been calculated using the latest population estimates. Rates for 2002-2010 have been calculated using the revised mid-year population estimates which take account of the 2011 Census.
Download this chart Figure 1: The number of conceptions (in thousands) and the conception rate in England and Wales, 1969–2011
Image .csv .xlsAs can be seen from Figure 1, following the introduction of the Abortion Act (1967) in 1968 the number of conceptions increased. The sudden decline in conceptions in the early to mid 1970s, despite a rise in the number of women in childbearing ages could be explained by the increased use of contraception (Wellings and Kane, 1999). Oral contraception was introduced in 1961, but this was only available to married women and was a chargeable prescription. Births peaked in 1964, so maternities would have been falling (in part due to use of contraception) when the Abortion Act (1967) came into force. In 1970 there was a mandate for family planning clinics to start treating single women. In 1974 contraception became free on the National Health Service (NHS), opening up services to women regardless of marital status and ability to pay.
There have been a number of scares about the safety of the contraceptive pill (Wellings and Kane, 1999). These pill scares deterred some women from using the pill as a method of contraception due to concerns about their health (Wood et al, 1997). This may have led to a number of women using less reliable methods of contraception or no contraception at all. These pill scares correspond to increases in the number of conceptions and occurred in 1976–77, 1983, 1986 and 1995–96.
The gradual increase in conceptions from 2001 onwards results from an increased number of conceptions to women at all ages with the exception of those aged under 20. Factors influencing the increasing age at conception is explored in a later section.
The conception rate for 2011 decreased very slightly to 80.4 conceptions per thousand women aged 15–44, from 80.5 in 2010, a decrease of less than 0.1%. The proportion of all conceptions resulting in a maternity in 2011 was 79%, the same as 2010. This proportion has remained fairly stable over the last two decades.
The size of the female population at child bearing age (women aged 15–44) will influence the number of conceptions. The composition of the female population will also influence the number of conceptions as there are peak age groups for maternities (25–29 and 30–34) and abortions (20–24) and the relative sizes of these groups will impact upon the number of conceptions. Changes in the size of the population are determined by births of females in previous years, mortality and migration.
The very slight fall in the overall conception rate between 2010 and 2011 was driven by a 0.1% decrease in the number of conceptions and a 0.04% rise in the female population at child bearing age.
Back to table of contents4. Marital status at conception
There has been a long-term rise in the proportion of conceptions (and births) occurring outside marriage. In 2011 conceptions outside of a marriage/civil partnership accounted for 57% of all conceptions in England and Wales, compared with 52% in 2001. In contrast, only 44% of conceptions occurred outside marriage in 1991. In 2011 the proportion of conceptions outside marriage/civil partnership which resulted in a maternity was 69%, compared with 93% of conceptions inside marriage/civil partnership.
Back to table of contents5. Age at conception
Between 2010 and 2011 conception rates in 2011 increased for women aged 30 years and over, stayed the same for women aged 25–29 and decreased for women aged under 25 years. The largest percentage increase in conception rates occurred among women aged 40 and over (3.7%). Smaller increases in conception rates were recorded among women aged 30–34 and 35–39 rising by 1.2% and 2.1% respectively. Conception rates for women aged under 20 and 20–24 have decreased by 7.6% and 2.5% respectively.
Figure 2: Relative changes in age-specific conception rates, 1990–2011
England and Wales
Source: Office for National Statistics
Download this chart Figure 2: Relative changes in age-specific conception rates, 1990–2011
Image .csv .xlsThe conception rate for women aged 40 and over has more than doubled since 1990 (Figure 2) from 6.6 to 13.9 conceptions per thousand women. The number of women in this age group conceiving has risen from 12,032 in 1990 to 28,747 in 2011. For women aged 40 and over, the percentage of conceptions leading to abortion fell from 43% in 1990 to 28% in 2011. Compared with 2010, the number of conceptions to women aged 40 and over has increased by 3.0%, but the percentage of conceptions leading to abortion decreased by 0.3 percentage points. Reasons for an increased number of women aged 40 and over conceiving include increased participation in higher education; delayed marriage and partnership formation (ONS 2012); the desire to establish a career, get on the housing ladder and ensure financial stability before starting a family ( Jefferies, 2008 (297 Kb Pdf) ; Ní Bhrolcháin, 2012).
The conception rate for women aged 35–39 continued to rise, from 61.5 conceptions per thousand women in 2010 to 62.8 in 2011, a rise of 2.1%. The number of conceptions to this age group fell by 1.4%, indicating that this rise was due to the size of the female population of childbearing age decreasing by 3.4% between 2010 and 2011.
Women aged 30–34 had the lowest proportion of conceptions leading to abortion at 13% in 2011. This is the same as 2010, when this age group also experienced the lowest proportion of conceptions leading to abortion. The conception rate continued to rise for this age group, reaching 124.9 conceptions per thousand women in 2011, compared with 89.7 in 1990 and 123.4 in 2010. The 30–34 age group is the youngest age group in which conception rates have risen almost continuously since 1990 and the rise may also be associated with the reasons outlined above.
Conceptions to women aged 25–29 have remained fairly stable, with the conception rate unchanged at 129.3 between 2010 and 2011. The conception rate for this age group declined between 1990 and 2001 when it reached 114.2 conceptions per thousand women, a fall of 17% before gradually rising. The conception rate for women aged 25–29 is now 6.3% below the 1990 level of 138.0 conceptions per thousand women aged 25–29.
Conceptions to women aged 20–24 have followed a similar pattern to the 25–29 age group, although the conception rate for this age group fell in 2011 (a 2.5% decrease). The conception rate has increased since 2001 and the conception rate for women aged 20–24 in 2011 is 14% below the 1990 level of 124.0 conceptions per thousand women.
The conception rate for women aged under 20 fell by 7.6% to 48.9 conceptions per thousand women aged 15–19 in 2011 (from 52.9 in 2010). This continues the overall downward trend in the conception rate for women aged under 20 since 2007 from 61.4 conceptions per thousand women. In 2011 conceptions to women aged under 18 accounted for 37% of all conceptions to women aged under 20, this compares with 38% in 2010.
In 2011 there were 31,051 conceptions to women aged under 18 compared with 34,633 in 2010, a decrease of 10%. This is the lowest number of conceptions in this age group since 1969. Nearly half (49%) of all conceptions to women aged under 18 in 2011 led to an abortion, this figure has remained relatively unchanged since 2006.
The under 18 conception rate for England and Wales was 30.9 conceptions per thousand women aged 15–17 in 2011 compared with 34.3 in 2010, a decrease of 9.9%. This is the lowest estimated under 18 conception rate since comparable conception statistics were first produced in 1969. This fall in the conception rate can be attributed to a 11.7% fall in the conception rate leading to abortion and a 8.1% fall in the rate of conceptions leading to a maternity. Figures for 2011 continue the overall downward trend in the conception rate for women aged under 18 since 1998 when there were 47.1 per thousand women aged 15–17, despite slight increases in 2002 and 2007. Since 1998 the conception rate for women aged under 18 has decreased by 34%.
Figure 3: Under 18 conception rate, 1975–2011
England and Wales

Source: Office for National Statistics
Notes:
- Rates have been calculated using the latest population estimates. Rates for 2002-2010 have been calculated using the revised mid-year population estimates which take account of the 2011 Census.
- ONS changed the methodology for estimating age at conception in 1997. Rates for 1987 to 1996 were revised to provide a comparable time series from 1987 onwards. The conception rates for 1975 to 1986 are not directly comparable as they have been calculated using the previous methodology for estimating age at conception. See background note 3 for more information.
Download this image Figure 3: Under 18 conception rate, 1975–2011
.png (16.5 kB) .xls (27.6 kB)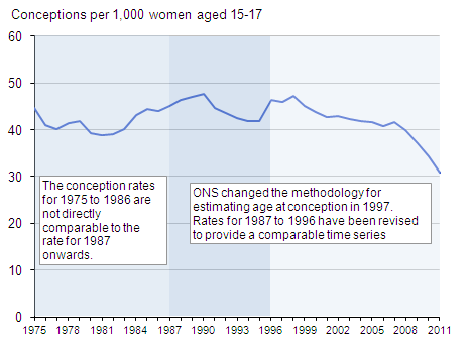
The number of conceptions to girls aged under 16 decreased by 10% from 6,674 in 2010 to 5,991 in 2011. A similar decline can also be seen in the conception rate for girls aged under 16. In 2011 there were 6.1 conceptions per thousand girls aged 13–15 compared with 6.8 in 2010, a decrease of 10%. This fall in the conception rate consists of a 12% fall in the rate of conceptions leading to abortion and a 4.0% fall in the rate of conceptions leading to a maternity. The percentage of conceptions leading to abortion for this age group has also fallen from 63% in 2010 to 60% in 2011.
Overall the under 16 conception rate has decreased over the last decade from 8.0 conceptions per thousand girls aged 13–15 in 2001 to 6.1 in 2011 despite small rises in some years. The under 16 conception rate is the lowest since 1969, the first year for which we have comparable data, when a rate of 6.9 conceptions per thousand girls aged 13–15 was recorded. Nearly three-quarters (71%) of under 16 conceptions in 2011 were to girls aged 15.
There are a number of factors which could explain the recent reduction in teenage conceptions, including:
the programs invested in by successive governments (for example sex and relationships education, improved access to contraceptives and contraceptive publicity)
a shift in aspirations of young women towards education (Broecke and Hamed, 2008)
the increased media awareness of young people and the perception of stigma associated with being a teenage mother (McDermott et al, 2004)
6. Why do teenage conceptions matter?
It is widely understood that teenage pregnancy and early motherhood can be associated with poor educational achievement, poor physical and mental health, social isolation, poverty and related factors. There is also a growing recognition that socio-economic disadvantage can be both a cause and a consequence of teenage motherhood (Swann et al, 2003). This led the previous Government to set a target to halve the teenage conception rate in England by 2010, when compared with 1998. Local authorities set ten year strategies in place, aiming to reduce the local rate between 40% and 60%. These local targets were to help underpin the national 50% reduction target.
The Teenage Pregnancy Strategy ended in 2010; however teenage pregnancy has remained an area of policy interest. The current Government has included the under 18 teenage conception rate as one of its three sexual health indicators in its Public Health Outcomes Framework (2013–2016) and it is one of the national measures of progress on child poverty. This ensures a continued focus on preventing teenage conceptions as well as the social impact upon teenage mothers.
Back to table of contents7. Conceptions leading to abortion
The percentage of conceptions leading to a legal abortion varies by age group. Over the last two decades this figure has generally increased for women aged under 20 but decreased for women aged 35 and over. For women in their twenties and early thirties the percentage of conceptions leading to a legal abortion generally increased between 1991 and 2001 but decreased steadily until 2009-2010 before increasing slightly in 2011.
Figure 4: Conceptions: percentage leading to legal abortion by age of woman at conception, 2011
England and Wales
Source: Office for National Statistics
Download this chart Figure 4: Conceptions: percentage leading to legal abortion by age of woman at conception, 2011
Image .csv .xls8. Conceptions by area of usual residence
For women usually resident in England, the overall conception rate remained unchanged from 2010 with 80.7 conceptions per thousand women aged 15–44 in 2011. For women usually resident in Wales, the overall conception rate fell by 0.8% from 75.7 conceptions per thousand women aged 15–44 in 2010 to 75.1 in 2011.
A comparison of rates across regions in England for all ages shows that the North East had the lowest conception rate in 2011, with 73.6 conceptions per thousand women aged 15–44. London had the highest overall conception rate at 89.5.
Revisions to subnational conception rates for 2002-2010 will be provided in future releases following population estimate revisions (to be published in March/April 2013) to take account of the 2011 Census.
Back to table of contents9. Under 18 conceptions by area of usual residence
For women usually resident in England the under 18 conception rate fell by 10% from 34.2 conceptions per thousand women aged 15–17 in 2010 to 30.7 in 2011. A decrease was also recorded for women usually resident in Wales where the under 18 conception rate fell by 7.3% from 36.9 conceptions per thousand women aged 15–17 in 2010 to 34.2 in 2011. In 1998, the under 18 conception rate in England was 46.6 conceptions per thousand women aged 15-17. A comparison of under 18 conception rates for England and Wales can be seen in Figure 5.
Figure 5: Under 18 conception rates 1992–2011
England and Wales
Source: Office for National Statistics
Download this chart Figure 5: Under 18 conception rates 1992–2011
Image .csv .xlsA comparison of rates across regions in England shows that the North East had the highest under 18 conception rate in 2011, with 38.4 per thousand women aged 15–17. The South East had the lowest rate for women aged under 18 in 2011 with 26.1 per thousand women aged 15–17.
It should be noted that at the local level, statistics for under 18 conceptions can fluctuate between years (either due to an unusually high number of teenage conceptions in a year, or an unusually low number).
A comparison of under 18 conception rates across local authorities is illustrated in Figure 6.
Figure 6: Under 18 conception rates by local authority, 2011
England and Wales
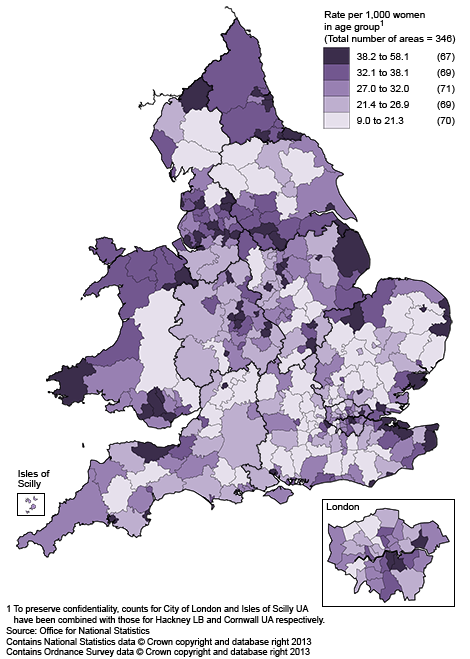
Source: Office for National Statistics
Download this image Figure 6: Under 18 conception rates by local authority, 2011
.png (227.3 kB)
Table 1: The ten areas with the highest conception rate for women aged under 18 in 2011
| England and Wales | |||
| Rank | Local Authority | Number of Conceptions 2011 | Conception rate per thousand women age 15–17, 2011 |
| 1 | Blackpool UA | 149 | 58.1 |
| 2 | Corby | 65 | 57.9 |
| 3 | Hastings | 96 | 57.0 |
| 4 | Merthyr Tydfil | 61 | 54.1 |
| 5 | Burnley | 87 | 53.2 |
| 6 | Torbay UA | 119 | 53.1 |
| 7 | Manchester | 411 | 52.5 |
| 8 | Kingston upon Hull, City of UA | 231 | 50.4 |
| 9 | Nottingham UA | 243 | 49.5 |
| 10 | Middlesbrough UA | 132 | 48.9 |
| 10 | Coventry | 285 | 48.9 |
| Source: Office for National Statistics | |||
Download this table Table 1: The ten areas with the highest conception rate for women aged under 18 in 2011
.xls (55.8 kB)As can be seen from the map (Figure 6) there is significant variation in the conception rate at the local level. When analysing figures for areas with small populations, for example Rutland UA, it is important to also take into account the numbers involved, as a slight change when numbers are small can lead to large changes in the rate. Other population characteristics can also have an impact, for example, the ethnic composition of an area, the level of deprivation and educational attainment levels.
There has been widespread variation in the success of local authorities in reducing teenage conception rates since 1998. For further information on this variation and ways in which effective reductions in teenage pregnancy can be made see the Teenage Strategy Beyond 2010, published by the previous Government in 2010 and available on the Department for Education website.
Back to table of contents10. Users and uses of conception statistics
The Department for Education (DfE) is a key user of conception statistics. DfE monitor the number and rate of under 18 conceptions and provide this data to local authorities to assist them in their wider work to reduce child poverty and narrow inequalities.
The Department of Health (DH) is also a key user of conception statistics. DH monitor the rate of under 18 conceptions under the Public Health Outcomes Framework 2013–2016 as part of the measures of health improvement. DH uses the numbers of conceptions at all ages as a marker for the success of policies on access to contraception (and other sexual health services). DH uses conception statistics by age because they are of use to maternity service providers, particularly during the antenatal period, to allow them to plan for the level of demand for antenatal services.
In Wales teenage conception rates are used widely as outcome indicators in the sexual health context for example in the Sexual Health and Well-being Action Plan for Wales, 2010–15, as well as being a general indicator of health and health inequality for example in Our Healthy Future. The conception rate for under 18 years is the most commonly used with the underage rate (under 16 years) being a key health indicator for children and young people. See for example Child Poverty targets.
Local authorities use the data, particularly the number and rate of under 18 conceptions to feed into their Joint Strategic Needs Assessments and to inform their commissioning decisions. They also use the statistics to make comparisons with other local areas and with the county, region and national level. Voluntary and community sector organisations, particularly those working in the field of sexual health, use the statistics to inform their work with local areas.
Back to table of contents