Table of contents
- Main points
- Overview
- The impact of exchange rate changes on foreign direct investment in 2016
- Foreign direct investment by continent
- UK foreign direct investment with the European Union
- Foreign direct investment by industry
- Foreign direct investment by industry and continent
- Distributional analysis using UK FDI microdata
- Future analytical plans
- Acknowledgements
- Quality and methodology
- Annex A: Details of countries within each continent for foreign direct investment statistics
- Annex B: Details of Standard Industrial Classification 2007: SIC 2007 industries for each foreign direct investment industrial grouping used
1. Main points
Growth in the value of foreign direct investment (FDI) positions held in the UK by overseas investors (FDI liabilities) exceeded that of UK FDI positions held abroad (FDI assets) in 2016, resulting in the UK’s net FDI position falling from £50.8 billion in 2015 to £12.5 billion by 2016, the lowest net position since comparable records began in 1997.
The value of FDI liabilities rose, due mainly to a handful of high-value inward mergers and acquisitions (M&A) throughout 2016; large publicly-reported M&A transactions in 2016 included the acquisitions of SABMiller, ARM Holdings and BG Group.
Analysis presented in this paper also indicates that exchange rate movements supported the value of FDI assets over 2016, and that the UK may have had a negative net direct investment position had the sterling exchange rate not depreciated.
Net UK FDI earnings fell in 2016 and turned marginally negative for the first time since comparable records began; this latest fall continues the downward trend experienced since 2011.
Most regions contributed to the fall in FDI credits in 2016, however, the majority of the fall was due to the North Americas; in contrast, UK FDI credits from the EU rose.
In terms of industry, most of the fall in UK FDI credits was attributable to falls from the mining and quarrying and the “other” industry groupings, while debits rose across all the broad industry groupings analysed.
When analysing FDI by asset value, the decline in FDI credits in 2016 appears attributable mainly to the largest 25 UK FDI companies, with the credits of the remainder of investors seeing an increase.
2. Overview
FDI statistics provide information about the value of foreign investment into and out of the UK, along with the earnings and flows of those investments
Foreign direct investment (FDI) refers to cross-border investments made by residents and businesses from one country into another, with the aim of establishing a lasting interest in the country receiving investment1. FDI assets capture the investments made by UK-based companies abroad whereas FDI liabilities cover investments in the UK made by foreign companies2. Statistics used in this analysis are presented using the asset and liability principle3, as opposed to the directional principle used in the FDI statistical bulletin. This is in line with internationally-agreed best practice and makes these data consistent with the Balance of Payments (Pink Book)4.
There are several concepts upon which the analysis in this article will focus. The position (stock) of FDI that the UK holds overseas is UK assets, whereby the earnings on those assets are credits. The position (stock) of FDI held in the UK by overseas companies is UK liabilities, with the earnings on those liabilities being debits. Net values are found by subtracting the value of liabilities from assets (net FDI position) or the value of debits from credits (net earnings). Statistics on FDI flows are a wider measure than earnings and debt transactions involving affiliates within multi-national organisations, which includes changes in share holdings (equity), debt and reinvested earnings.
The difference between UK FDI asset and liability positions and earnings narrowed in 2016
The values of UK assets and liabilities have been on an upward trend since comparable records began in 1987. However, the value of FDI assets saw little growth from 2011 to 2015, suggesting that this upward trend may have flattened. The performance of FDI liabilities has been more varied; the value in 2015 was 36.1% higher than in 2011, reflecting continued investment into the UK.
The growth in the values of UK assets and liabilities both increased considerably in 2016. The value of UK assets grew by 11.4% to £1,564.2 billion, while that of liabilities grew by 14.7% to £1,551.7 billion. For FDI assets, this is the fastest annual growth rate since 2008, when asset values increased by 25.2% over that year. The growth in UK liabilities is the highest since 2012, when the value grew by 25.8% over the year. The value of UK assets has remained higher than liabilities, as presented in Figure 1; in other words, the net position was positive. The higher growth of UK FDI liabilities has seen the UK’s net FDI position fall from £494.2 billion in 2008 to £12.5 billion by 2016.
Figure 1: UK foreign direct investment assets and liabilities, 1997 to 2016
Source: Office for National Statistics
Download this chart Figure 1: UK foreign direct investment assets and liabilities, 1997 to 2016
Image .csv .xlsThe value of credits had also exceeded the value of debits in every year since comparable records began in 1997. While both earnings series had an upward trend throughout the 2000s, these were affected by the 2007 global financial market shock. The value of debits (earnings on foreign-held investment in the UK) has been at a similar level since 2011 while the value of credits has been falling over that period (Figure 2).
These trends continued into 2016 to the extent that the UK had a marginal negative net FDI earnings balance. The value of debits was £1.7 billion greater than that of credits, which is equivalent to 1.5% of the current account balance.
Figure 2: UK credits and debits, 1997 to 2016
Source: Office for National Statistics
Download this chart Figure 2: UK credits and debits, 1997 to 2016
Image .csv .xlsImplied rates of return suggest a continued decline in profitability on UK overseas direct investment
Use of rates of return can assist in understanding whether changes in earnings reflect changes in investment, changes in the profitability of investments, or both. Rates of return are measured by calculating the value of earnings relative to the stock of investment. This captures how much income is generated per pound of investment. Therefore, if the UK receives £50,000 on an asset in Germany valued at £1 million, then this implies that the rate of return is 5%; every £100 invested generates £5 of income. The implied rates of return on UK assets and liabilities are shown in Figure 3.
Figure 3: Implied rates of return on UK foreign direct investment assets and liabilities, 1997 to 2016
Source: Office for National Statistics
Download this chart Figure 3: Implied rates of return on UK foreign direct investment assets and liabilities, 1997 to 2016
Image .csv .xlsThe implied rates of return on UK assets have typically been higher than those on UK liabilities. However, trends in these series since 1997 have been different. Rates of return on UK assets have been on a broadly downward trend after peaking at 10.8% in 1997 and falling to 3.7% by 2016. This is the lowest implied rate of return on outward FDI since comparable series began.
The rates of return on UK liabilities have been more constant by comparison, varying between 4% and 6% in 13 of the 20 years presented. The rate of return on liabilities did fall outside this range in 2016, at 3.9%. Yet this was higher than the implied rate of return on UK assets, which has now occurred for the second time since 1997; the only other time being in 2008.
The value of net FDI earnings has a direct impact on the UK’s current account balance
Foreign direct investment is a component of the balance of payments, with changes in credits and debits affecting the primary income account. The UK’s current account balance (the line in Figure 4) has been negative (that is, a current account deficit) in every year since 1983. Net FDI earnings have been positive in every year between 1997 and 2015, therefore contributing positively to the current account balance.
However, the value of net FDI earnings has deteriorated since its peak in 2011 and has fallen from £53 billion in 2011 to £9 billion in 2015. Net FDI earnings worsened further in 2016 and turned marginally negative. While the decline in net FDI earnings worsened the current account balance further, the decrease in net trade (exports less imports) was a greater factor in the increase in the current account deficit between 2015 and 2016. The current account deficit has increased as a proportion of gross domestic product (GDP) from 2.4% in 2011 to 5.2% by 2015 and then to 5.8% in 2016.
Figure 4: The UK current account balance and its components, 1997 to 2016
Source: Office for National Statistics
Notes:
- This analysis assumes that there are no revisions to the other components of the current account.
Download this chart Figure 4: The UK current account balance and its components, 1997 to 2016
Image .csv .xlsThe current account balance was increasing – becoming less negative – between 2008 and 2011, before falling markedly from 2011 onwards. Over this period, the value of net FDI earnings has also fallen notably, whereas the total values of other components of the current account have been broadly constant. Figure 2 shows that this is more as a result of earnings on UK assets held overseas falling while earnings on foreign-held assets in the UK have been largely constant since 2011. This indicates that falling earnings on UK FDI overseas has been a factor in the widening of the current account deficit.
FDI inflows increased considerably in 2016, mainly as a result of a few very high-value inward mergers and acquisitions
Previous FDI analysis articles have not covered FDI flows because these can be volatile from year to year. This stems from FDI flows also including information on equity (share) transactions along with inter-company loans between different parts of these corporate structures. Therefore changes in these statistics can be heavily affected by one-off transactions that do not necessarily re-occur again.
In 2016, there were a few very high-value inward mergers and acquisitions that completed in that year, which led to the value of FDI inflows reaching £199.4 billion – this was a record high and more than five-times greater than the value recorded in 2015. While this is the highest annual value of inward FDI flows, the 2016 inward value is comparable with outward FDI flows in 2007 and 2008, and 1999 and 2000. Some of the large publicly-reported mergers and acquisitions (M&A) transactions in 2016 included the acquisitions of SABMiller (PDF, 225KB), ARM Holdings and BG Group.
Figure 5: UK foreign direct investment flows, 1997 to 2016
Source: Office for National Statistics
Download this chart Figure 5: UK foreign direct investment flows, 1997 to 2016
Image .csv .xlsIt is difficult to observe any distinctive trends in FDI flows data. This can be seen in Figure 5, which presents inward and outward FDI flows statistics since comparable records began in 1997. The inherent variability in these estimates have periods where inward and outward flows follow each other and other times where they do not. That said, the values of both inward and outward flows have tended to be lower since 2010 than they were before 2008. Indeed, FDI asset flows were negative in 2009, 2014 and 2015, indicating that UK firms disinvested abroad in terms of both their equity and debt positions.
Another observation for FDI liability flows is that they were remarkably constant from 2011 to 2015 and especially so since 2013. This has also marked a period of negative net FDI flows for the UK, with the values of inward flows being greater than that of outward flows. This negative gap of £162.4 billion is also the greatest absolute difference since comparable records began in 1997 and only the second time that it has been above £100 billion.
Office for National Statistics publishes information on mergers and acquisitions (M&A) involving UK companies in a quarterly statistical bulletin. There are some differences between FDI and M&A statistics that make it difficult to reconcile these two estimates. For example, FDI statistics cover all inward and outward direct investments among companies that hold at least 10% of ordinary shares, whereas published M&A statistics focus on transactions resulting in control of at least 50.1% of ordinary shares. Another difference involves the treatment of inter-company loans, which are excluded from M&A statistics but included in FDI.
The time required for multi-nationals to agree and complete FDI and M&A transactions makes it very difficult to link changes in these statistics with the economic cycle or specific events. An example can be found in the annex to Mergers and acquisitions in context, 2016, which provides an overview of one such M&A deal that completed in 20165. While companies will be aware of these events, they are likely to be factored into the initial decision to announce a M&A or FDI transaction based upon the expected return on risk for the duration of the project, among other aspects.
Notes for: Overview
A minimum of 10% of the voting power is the basic criterion used to distinguish FDI relationships from portfolio investment.
Inward investment is made in the UK by non-resident companies.
The OECD has produced a comparison of these two approaches.
FDI data for 2015 presented throughout this article are based on revised estimates, which were published in the latest annual FDI bulletin. The revised estimates for 2015 are yet to be incorporated into balance of payments. Latest 2015 estimates of FDI and other components of the current account will be incorporated into Pink Book and Balance of Payments in July 2018.
Please note, the M&A statistics presented in this note may have been revised since its publication. Therefore the values may not match those in later statistical bulletins, yet the general trends – including the impact of the very-high value M&A transactions in 2016 – remains unchanged.
3. The impact of exchange rate changes on foreign direct investment in 2016
The two previous foreign direct investment (FDI) analysis articles1 included sections estimating the impact that the depreciation of the sterling exchange rate over 2016 may have had on FDI statistics. We develop this analysis using the latest annual estimates for 2016 and consider the year in the context of exchange rate movements since 2011.
The sterling exchange rate appreciated between 2011 and 2015, which was partly offset by the exchange rate depreciation in 2016
Exchange rate indices are usually weighted by the proportion of a country’s trade in each currency. For this analysis, we use exchange rate data from the Bank of England and weight each movement by the proportion of UK FDI assets or credits per currency. This gives FDI-weighted exchange rate indices, as shown in Figure 6. Both indices increased in almost every year from 2011 to 2015, with that of assets being 27.6% higher at the end of that period. In 2016, the exchange rate had a marked depreciation of 15.9%, keeping it above the 2013 rate. The appreciation of sterling is likely to have lowered the value of FDI denominated in foreign currency in sterling terms, since each unit of foreign currency buys fewer pounds. The subsequent depreciation in 2016 would have had the opposite effect.
Figure 6: Sterling effective exchange rate index, end of period, 2011 to 2016
Source: Bank of England
Download this chart Figure 6: Sterling effective exchange rate index, end of period, 2011 to 2016
Image .csv .xlsThe exchange rate impact can be examined using counterfactual analysis. A counterfactual creates an alternative estimate of what FDI might have been had the exchange rate remained fixed at a point in time. These calculations require estimating the proportion of FDI positions and earnings denominated in foreign currency.
Ahead of our July 2017 analysis, we approached 200 of the largest companies engaged in both inward and outward FDI in the UK to collect voluntary information on the currency composition of their FDI earnings and positions. We found that just over half of FDI assets could be denominated in sterling and close to three-fifths for FDI credits. A larger proportion of liabilities and debits are denominated in sterling; slightly below 90% of liabilities are held in sterling and just over 90% of debits. Therefore, while FDI debits and liabilities will still be affected by exchange rate changes, the impact will be notably smaller. This analysis focuses on the exchange rate impact on UK FDI credits and debits2.
There are three important considerations related to these counterfactual estimates.
Firstly, the voluntary responses of UK direct investors will have its own sampling variation; repeating this survey again may yield different results. Therefore, the actual exchange rate impact could be greater or lower than that presented in this analysis.
The second consideration is that the currency composition of FDI involving the UK is likely to change over time. These results are most applicable for 2016 and therefore can be less relevant for other periods of sterling depreciation (or appreciation).
The third consideration is that the counterfactuals only attempt to capture the price effect of an exchange rate movement – that is, the impact of converting non-sterling denominated earnings and assets into sterling. Other effects, such as increases or decreases in investment due to changes in the profitability of investments after the exchange rate has depreciated, are not captured.
The appreciation of sterling between 2011 and 2015 only explains a small part of the decline in the value of FDI credits and debits
The previous section noted that the value of FDI credits has followed a downward trend since 2011.The counterfactual series holding the exchange rate constant from the end of 2011 follows the same downward trend over this period. This suggests that while the appreciation did indeed lower the value of credits, it only explains a small part of the overall decline in value. The difference in the two series presented in Figure 7 was greatest in 2015, at which time the exchange rate had appreciated by over 17% from 2011. The depreciation of sterling over 2016 has seen that gap narrow considerably so that the counterfactual of FDI credits would have been very similar to published values.
Figure 7: UK foreign direct investment reported and counterfactual credits, 2011 to 2016
Source: Office for National Statistics
Download this chart Figure 7: UK foreign direct investment reported and counterfactual credits, 2011 to 2016
Image .csv .xlsSimilar counterfactual results are observed with FDI assets. While the (upward) trend in assets values is maintained using the counterfactual series, the higher value of the counterfactual between 2011 and 2015 suggests that the appreciation in sterling did apply some downward pressure on the value of assets over the period. Similarly to credits, the difference between the counterfactual and reported value of assets narrows in 2016, reflecting that the depreciation in sterling will have inflated the value of assets. The values of differences between the two series in Figure 8 are greater for assets than for credits. This partly reflects the higher value of UK FDI assets and greater proportion of FDI assets denominated in foreign currency relative to credits in Figure 7.
Figure 8: UK foreign direct investment reported and counterfactual assets, 2011 to 2016
Source: Office for National Statistics
Download this chart Figure 8: UK foreign direct investment reported and counterfactual assets, 2011 to 2016
Image .csv .xlsThis analysis suggests that the value of UK FDI assets would have been 13.2% higher in 2015 had the exchange rate remained at the 2011 rate, before narrowing to 5.6% in 2016. Overall, this analysis indicates that exchange rate movements were a factor in UK FDI credits and assets between 2011 and 2015, but do not explain the overall fall in the value of credits. In contrast, the decrease in the difference between the counterfactual and reported value of assets and credits in 2016 estimates that the depreciation reversed some of the downward pressure applied from the appreciation in previous years.
Further analysis confirms previous estimates that the values of UK FDI credits and assets would have been lower in 2016 had the sterling depreciation not occurred.
Focusing upon the exchange rate depreciation in 2016, it is possible to estimate the impact of the exchange rate on FDI statistics relative to other effects in that year. Figure 9 presents the published values of UK FDI credits between 2011 and 2015. For 2016, the solid bar is the value of FDI credits from 2015 carried forward. The counterfactual analysis is repeated, this time with the sterling effective exchange rate fixed at the end of 2015 rate. This shows that exchange rate movements acted to increase the value of credits over 2016, but this was not enough to offset the other factors that ultimately saw the value of credits being slightly lower in 2016 than in 2015. The counterfactual analysis predicts that the value of FDI credits would have been 10.0% lower had the exchange rate remained at its 2015 rate.
Figure 9: Impact of exchange rate movements on foreign direct investment credits in 2016
Source: Office for National Statistics
Download this chart Figure 9: Impact of exchange rate movements on foreign direct investment credits in 2016
Image .csv .xlsRepeating the counterfactual analysis for UK FDI assets suggests that the exchange rate depreciation over 2016 was an equal factor in that year. Figure 10 is similar to Figure 9 in that the 2015 value is carried forward to 2016, with the other effects added to it. This analysis suggests that UK FDI assets would have been £93.6 billion lower in 2016 had the depreciation not happened. Therefore the annual growth rate of assets would have been around 4.8% over 2016, compared with an increase of 11.4% using the published series. This may have also led to the UK having a negative net direct investment position in 2016, rather than the slight positive net position using the latest estimates.
Figure 10: Impact of exchange rate movements on foreign direct investment assets in 2016
Source: Office for National Statistics
Download this chart Figure 10: Impact of exchange rate movements on foreign direct investment assets in 2016
Image .csv .xlsThe counterfactual analysis presented in this section indicates that the exchange rate depreciation in 2016 partially offset the impact of exchange rate appreciation between 2011 and 2015. For both FDI assets and credits, the trends remain the same using the counterfactuals compared with published estimates. However, decomposing the effects over 2016 suggests that both values would have been lower had the exchange rate depreciation not occurred. UK FDI credits would have fallen by a greater extent than using the published estimate, whereas the growth of FDI assets would have been lower had the depreciation not taken place. The greater impact of exchange rate changes on assets than on liabilities suggests that both net FDI earnings and net FDI positions would have been lower without the depreciation; this in turn is likely to have led to a larger current account deficit in 2016.
Notes for: The impact of exchange rate changes on foreign direct investment in 2016
See A Review of UK foreign direct investment statistics, winter 2017 and UK foreign direct investment statistics: trends and analysis: summer 2017.
The counterfactuals in this article are equivalent to the adjusted counterfactual series presented in our July 2017 article. The counterfactual presented previously initially assumed that all FDI assets and credits were denominated in foreign currency, which has not been used here.
4. Foreign direct investment by continent
Foreign direct investment (FDI) statistics can be grouped by country to show FDI positions and earnings between the UK and a partner country. This analysis uses continents: Africa, Asia, Australasia and Oceania, Central and South Americas, European Union (EU), Non-EU Europe and North Americas. Details of the countries included within these continents can be found in Annex A. This section looks at regional trends for both UK credits and debits.
In line with international guidance, UK FDI statistics are presented on an immediate parent basis. Therefore, geographical compositions reflect direct relationships between investing parties rather than the residence of the ultimate parent companies of transactors. Large multi-national companies often have complex corporate structures, where a parent company controls a large network of inter-linked affiliates and branches across the globe.
Since published statistics report the immediate country partner or transactor, geographical compositions can be distorted in cases where a parent company channels investment through one or more countries before the investment reaches its final destination. It is important to note that, while affecting geographical compositions, aggregate FDI statistics are unaffected by whether they are presented on an immediate or ultimate basis. Experimental statistics showing UK FDI on an ultimate parent basis can be found in our July 2017 article.
The value of credits fell in almost all regions except the EU and the “rest of the world” in 2016
The general increase in most regions between 2011 and 2016, with the only region seeing a fall being the EU and the “rest of the world” (a grouping of Africa, and Australasia and Oceania). The decline in FDI assets in the EU occurred mainly between 2011 and 2014, before seeing a small increase in 2015 and an even greater increase in 2016. All other regions also saw an increase in the value of assets from 2015 to 2016, except for the Central and South Americas. The largest of these increases occurred in the EU where assets increased by £94.3 billion to £645.1 billion from 2015 to 2016. The broadly upward increase in asset values is likely to reflect the upward pressure applied from the depreciation in sterling over 2016, as highlighted in the previous section.
Figure 11: Total UK foreign direct investment assets by continent, 2011 to 2016
Source: Office for National Statistics
Download this chart Figure 11: Total UK foreign direct investment assets by continent, 2011 to 2016
Image .csv .xlsThe value of FDI credits has been on a downward trend since 2011, which has occurred across all continents. The value of FDI credits fell further in 2016, but the broad decline in the total was offset by increases in profits generated by UK investors in the EU and the “rest of the world”. The largest decline seen in 2016 was in the North Americas, where FDI credits fell from £13.0 billion to £6.9 billion.
Figure 12: Total UK foreign direct investment credits by continent, 2011 to 2016
Source: Office for National Statistics
Download this chart Figure 12: Total UK foreign direct investment credits by continent, 2011 to 2016
Image .csv .xlsThe implied rates of return on UK assets rose in the EU and Africa, but fell across all other regions in 2016
Implied rates of return have fallen for most continents from 2011 to 2016. The shaded area in Figure 13 represents a swathe of these rates in any given year; in other words, the difference between the highest and lowest rate of return in that year. The “Total” line is the implied rate of return on all UK assets and confirms the general downward trend in aggregate.
Rates of return from Asia have been among the highest over this period, yet even these have fallen from 13.6% in 2011 to 7.2% in 2016. Therefore, implied rates of return on UK FDI assets in Asia are nearly half their rate in 2011. Rates of return from Africa have experienced the greatest fall over the period, but it was one of two continents to see these rates increase from 2015 to 2016; the other continent being the EU. Australasia and Oceania is the only continent where the implied rate of return is higher in 2016 than was the case in 2011. Despite all these changes, returns on assets have generally converged over the period, which can be seen by the reduction in the shaded area in 2016 compared with 2011. For the first time in this period, the North Americas had the lowest rate of return for assets. Rates of return continued to decline in 2016 across most regions, with the exception of the EU, where rates of return rose from 3.4% to 3.7% and Africa, where returns rose from 2.5% to 4.8%.
Figure 13: Implied rates of return on UK assets by continent, 2011 to 2016

Source: Office for National Statistics
Download this image Figure 13: Implied rates of return on UK assets by continent, 2011 to 2016
.PNG (47.8 kB) .xlsx (23.2 kB)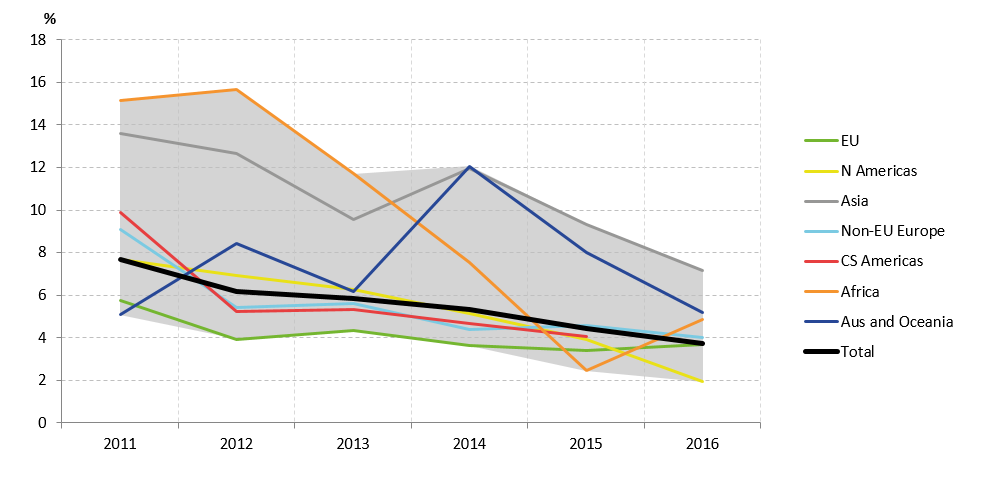
It is sometimes the case that smaller components underlying a statistic can be more volatile than some of the larger components. In this case, the large percentage changes in the smaller component would be counteracted by the relatively more stable changes in the larger one. The contributions of each component can therefore be weighted by its relative size in the total to allow for these differences. Figure 14 presents the relative contributions of continental regions to the overall implied rate of return on UK assets, weighted by the share of each continent in total assets.
Figure 14: Contributions to the implied rate of return on UK assets by continent, weighted by foreign direct investment assets per continent, 2011 to 2016
Source: Office for National Statistics
Download this chart Figure 14: Contributions to the implied rate of return on UK assets by continent, weighted by foreign direct investment assets per continent, 2011 to 2016
Image .csv .xlsDue to the relative size of EU investment, returns on those assets make the largest contributions to the UK’s overall rates of return on FDI assets abroad, as indicated in Figure 14. While the proportional contribution of the EU to the total has increased over the period (due to falls in the contributions of other regions), the fall in EU returns since 2011 has contributed the most to the overall decline in UK returns, a negative 1.3 percentage points to the overall figure, or just over one-third of the overall decline. The North Americas are the second-largest contributor to the overall rate of return and also made the second-largest negative contribution to the overall decline, a negative 1.1 percentage points.
UK liabilities and debits were generally higher in 2016 than they were in 2011
UK FDI liabilities have followed an upward trend since 2009, which is attributable to increases across all continents over the period. UK FDI liabilities rose by £198.8 billion in 2016 compared with the previous year. This rise was attributable to increases across all regions with the exception of Central and South America. The largest increase occurred in the EU, where liabilities rose by £125.6 billion – which was mainly attributable to inward M&A activity over the year.
Figure 15: Total UK foreign direct investment liabilities by continent, 2011 to 2016
Source: Office for National Statistics
Download this chart Figure 15: Total UK foreign direct investment liabilities by continent, 2011 to 2016
Image .csv .xlsThe value of earnings generated on foreign-owned assets in the UK (debits) has increased in every continent from 2011 to 2016. The Central and South Americas was the main continent with which debits increased over the period, rising from £2.0 billion to £5.4 billion.
The overall changes in debits across this period are generally lower than the changes for credits. For example, debits to the EU increased by £1.4 billion, while credits from the region fell by £15.3 billion. The £7 billion increase in debits between 2015 and 2016 was supported by increases across all regions. The largest increases came from the Central and South Americas (£2.1 billion), North Americas (£1.9 billion) and non-EU Europe (£1.9 billion)the Central and South Americas.
Figure 16: Total UK foreign direct investment debits by continent, 2011 to 2016
Source: Office for National Statistics
Download this chart Figure 16: Total UK foreign direct investment debits by continent, 2011 to 2016
Image .csv .xlsTrends in implied rates of return on UK FDI liabilities have been more stable than those on assets
The overall rate of return on UK liabilities has been largely constant since 2011. One of the highest rates of return generated in the UK between 2011 and 2016 was on North American liabilities even though these have still fallen from 7.8% to 5.3% over this period (Figure 17).
Rates of return on investment from the EU appear to have been broadly stable in this period, which will have supported the relatively constant rates of return on UK liabilities. All continents except the EU display an increase in implied rates of return on UK liabilities from 2015 to 2016, but the annual decrease shown by the EU offsets all other increases. This has led to no annual change in total implied rate of return on UK liabilities, from 3.9% in 2015 to 2016. In addition, unlike the range of continental rates of return on FDI assets, that on liabilities has remained broadly constant over the period shown by the shaded area in Figure 17.
Figure 17: Implied rates of return on UK liabilities by continent, 2011 to 2016

Source: Office for National Statistics
Download this image Figure 17: Implied rates of return on UK liabilities by continent, 2011 to 2016
.PNG (42.4 kB) .xlsx (22.6 kB)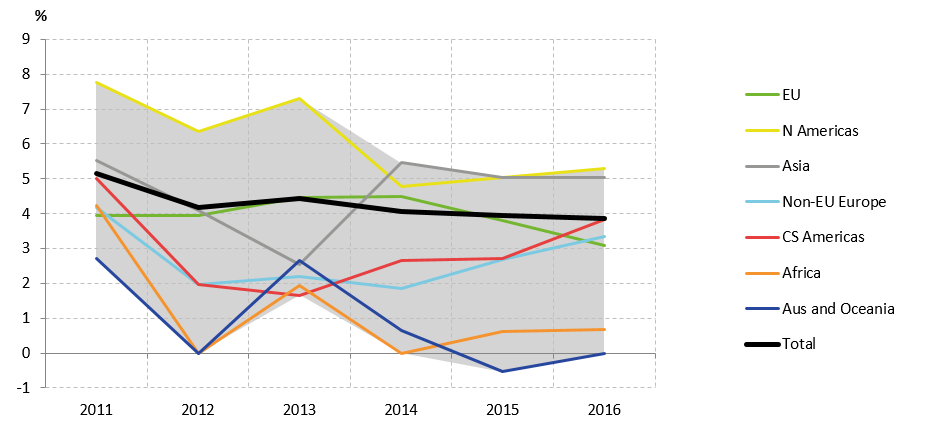
Looking at percentage point contributions of different continents to the overall rate of return on UK FDI liabilities highlights that the EU and North Americas were the main contributors to the overall rate of return – reflecting the size of these regions’ investment positions in the UK. Over the period between 2011 and 2016, returns on UK FDI liabilities fell by 1.3 percentage points – attributable mainly to falls in the North Americas (negative 0.7 percentage points) and the EU (negative 0.6 percentage points). Between 2015 and 2016, the overall rate of return on UK FDI liabilities saw little change, with small decreases in the EU and North Americas offset by rises in the Central and South Americas, and non-EU Europe.
Figure 18: Contributions to the implied rate of return on UK liabilities by continent, weighted by foreign direct investment liabilities per continent, 2011 to 2016
Source: Office for National Statistics
Download this chart Figure 18: Contributions to the implied rate of return on UK liabilities by continent, weighted by foreign direct investment liabilities per continent, 2011 to 2016
Image .csv .xls5. UK foreign direct investment with the European Union
The European Union (EU) is the region with which the UK has the greatest outward and inward foreign direct investment (FDI) relationships. FDI with the EU accounted for 41.2% of total UK assets in 2016 and 42.6% of total UK liabilities. These proportions have fallen since 2011 – from 49.6% and 48.8% respectively – yet the size of UK assets in the EU was around twice as large as the assets in the second-largest region (North Americas) in both years. These FDI statistics are presented on an immediate parent company basis, which may affect the geographic distribution of UK FDI. This includes instances where FDI is channelled through another economy before reaching its final destination.
Implied rates of return on UK assets are typically lower in the Netherlands and Luxembourg than most of the other top-ten EU outward direct investment destinations
UK FDI in the European Union is concentrated in a few member states, with nearly half of these assets in two of them. The top-ten EU partner countries included in Table 1 are in the same order in 2016 as they were in 2015. The Netherlands and Luxembourg had the first- and second-largest stock of UK assets respectively and together accounted for 45.2% of total UK assets in the EU. This is a slightly lower proportion than in 2015 (46.3%) yet, at 91.6%, the cumulative proportion of UK assets in the EU within the top-ten destinations remained the same in both years. Looking at the proportions for each country indicates that the largest increase in the proportion of UK FDI assets among these member states was in Germany, from 5.0% of UK FDI assets in the EU in 2015 to 6.1% in 2016.
Table 1: UK foreign direct investment by EU member state, top ten by asset value, 2016
| Member state | FDI assets (£ billion) | FDI credits (£ billion) | Implied rate of return (%) | Cumulative percentage of total EU assets | ||
|---|---|---|---|---|---|---|
| 1 | Netherlands | 166.5 | 3.9 | 2.4 | 25.8 | |
| 2 | Luxembourg | 125.2 | 2.2 | 1.7 | 45.2 | |
| 3 | France | 87.1 | 2.4 | 2.8 | 58.7 | |
| 4 | Ireland | 69.3 | 4.7 | 6.8 | 69.5 | |
| 5 | Spain | 58.3 | 1.2 | 2.1 | 78.5 | |
| 6 | Germany | 39.1 | 2.5 | 6.4 | 84.6 | |
| 7 | Belgium | 29.3 | 1.5 | 5.2 | 89.1 | |
| 8 | Sweden | 21.4 | 2.4 | 11.4 | 92.4 | |
| 9 | Italy | 15.9 | 0.5 | 3.4 | 94.9 | |
| 10 | Denmark | 7.8 | 0.6 | 7.7 | 96.1 | |
| Other | 25.2 | 1.5 | 5.8 | 100.0 | ||
| Source: Office for National Statistics | ||||||
Download this table Table 1: UK foreign direct investment by EU member state, top ten by asset value, 2016
.xls (121.9 kB)Despite some changes in the individual country proportions of UK assets among the top-ten EU member states by asset value, these ten still accounted for over 95% of all UK assets in the EU in 2016. Therefore, the other 17 member states together accounted for less than 5% of total UK assets in the EU. The lower asset values among these member states can make interpreting implied rates of return more difficult. The lower value of FDI assets can magnify the impact that a few companies can have on the values of credits. Therefore the range of rates of return is relatively dispersed and can display considerable fluctuations from year to year. With this in mind, the analysis will focus upon the implied rates of return among the top-ten EU member states by asset values.
Half of the top-ten EU member states by asset value had an implied rate of return below the EU average (of 3.7%) in 2016. Of the top-five countries, the implied rate of return in Ireland was the only one above average. Furthermore, the second-highest value of UK assets was located in Luxembourg, yet this had the lowest implied rate of return among the top ten. Likewise for the Netherlands, in which the greatest value of UK assets reside, these had the third-lowest implied rate of return.
The implied rates of return tend to be lower among the top-five destinations of UK FDI within the EU than the next-greatest five by asset values; Ireland and Italy were the two exceptions to this in 2016. It can also be seen that UK FDI in Sweden was the only stock of assets to have an implied rate of return above 10% in 2016 among the countries presented in Table 1.
The implied rates of return on inward direct investment from other EU member states are more mixed than that of the UK in the EU
The UK receives the most FDI from the same ten European countries as the ones in which the majority of UK investment out to the EU is located.There are some slight changes to the order by liabilities value in 2016 (Table 2) compared with that for assets, yet the Netherlands and Luxembourg still accounted for the same proportions with liabilities as they did for assets (45.2%). Furthermore, the top-ten member states by liabilities value accounted for the same proportion of total EU liabilities (96.1%) as for assets.
Table 2: UK foreign direct investment by EU member state, top ten by liabilities value, 2016
| Member state | FDI liabilities (£ billion) | FDI debits (£ billion) | Implied rate of return (per cent) | Cumulative percentage of total EU liabilities | ||
|---|---|---|---|---|---|---|
| 1 | Netherlands | 236.1 | 5.0 | 2.1 | 25.8 | |
| 2 | Luxembourg | 127.2 | 2.4 | 1.9 | 45.2 | |
| 3 | Germany | 78.1 | 5.6 | 7.1 | 51.3 | |
| 4 | France | 75.2 | -0.0 | -0.0 | 64.8 | |
| 5 | Belgium | 40.7 | 2.2 | 5.3 | 69.3 | |
| 6 | Ireland | 33.6 | 0.5 | 1.6 | 80.1 | |
| 7 | Spain | 32.7 | 2.4 | 7.4 | 89.1 | |
| 8 | Sweden | 10.2 | 0.6 | 5.6 | 92.4 | |
| 9 | Italy | 9.0 | 0.4 | 4.0 | 94.9 | |
| 10 | Denmark | 7.7 | 0.8 | 10.1 | 96.1 | |
| Other | 10.7 | 0.7 | 7.0 | 100.0 | ||
| Source: Office for National Statistics | ||||||
Download this table Table 2: UK foreign direct investment by EU member state, top ten by liabilities value, 2016
.xls (121.9 kB)However, the distinction between the implied rates of return among the top-five inward FDI countries and the next five is less clear than it is for outward investment in the EU. Implied rates of return tend to be lower among the top-five relative to the next five member states, yet the returns on liabilities from Germany (7.1%) and Belgium (5.3%) are both above the EU average (3.0%). For inward investment, the rate of return on UK liabilities with Denmark is the only one among the top ten that was above 10% in 2016.
The trends in implied rates of return for UK FDI with the top-ten EU member states by positions have been mixed between 2011 and 2016
The trends in implied rates of return on UK assets in the top-ten EU member states have been mixed since 2011. The rates are higher in 2016 than in 2011 for assets located in six of these member states (Figure 19). Yet the trends on FDI assets in the Netherlands, Luxembourg and France – the three largest by asset values – have been downwards over that period.
The implied rates of return on assets in both Luxembourg and the Netherlands have fallen by 5.0 percentage points and 5.2 percentage points respectively. This contributes to the downward trend in rates of return on UK assets in the EU and total UK assets more generally. However, there could also be downward trends on implied rates of return for assets held in Belgium and Denmark too, which are masked somewhat by rates of return more than doubling from 2015 to 2016. It can also be seen that implied rates of return have been relatively constant in both Spain and Sweden.The latter is the only member state among the top 10 by asset values to have a rate above 10% in any year.
Figure 19: Implied rates of return for UK assets in the top-ten EU member states by asset value, 2011 to 2016
Source: Office for National Statistics
Notes:
- Some values have been suppressed to mitigate disclosure.
Download this chart Figure 19: Implied rates of return for UK assets in the top-ten EU member states by asset value, 2011 to 2016
Image .csv .xlsThe trends in implied rates of return on UK FDI liabilities with the top-ten EU member states by value between 2011 and 2016 have been mixed too. Crucially, the implied rates of return for the three highest value inward investors – the Netherlands, Luxembourg and Germany – have not changed to the same extent as the top three by asset values (Figure 20 compared with Figure 19).
For example, the implied rates of return on Luxembourg and German liabilities are very similar in 2016 to the respective rates in 2011. On the other hand, the implied rates of return on Dutch liabilities were 0.6 percentage points lower in 2016 than in 2011; the equivalent figure for rates of return on assets was a fall of 5.2 percentage points. Therefore, while implied rates of return on UK FDI liabilities have also fallen between 2011 and 2016, these changes among the three main sources of inward FDI from the EU will have mitigated this downward trend.
Figure 20: Implied rates of return for UK liabilities in the top-ten EU member states by liability value, 2011 to 2016
Source: Office for National Statistics
Download this chart Figure 20: Implied rates of return for UK liabilities in the top-ten EU member states by liability value, 2011 to 2016
Image .csv .xls6. Foreign direct investment by industry
Foreign direct investment (FDI) statistics can also be grouped to show the breakdown of overall FDI positions and earnings between industries. These are defined using the UK Standard Industrial Classification of Economic Activities 2007: SIC 2007 and those used in this analysis can be found in Annex B. This article uses the following industrial groupings:
mining and quarrying
manufacturing
wholesale, transport and accommodation
information and communication
financial and insurance
professional and support
other (agriculture, real estate, government health and education plus any production and services industries not covered elsewhere)
UK credits fell across most industries despite asset positions increasing
The values of UK credits were lower in 2016 than in 2011 for all but one industry grouping. This is particularly notable in mining and quarrying, manufacturing, and professional and support, where credits were £25.5 billion, £6.8 billion and £4.2 billion lower respectively (Figure 21). The exception to this trend is wholesale, transport and accommodation, for which credit values were £1.9 billion higher in 2016 than 2011.
Between 2015 and 2016, the fall in overall UK credits was attributable mainly to the mining and quarrying industries, which turned negative for the first time, and the “other” industries, which was mainly from falls in the credits of bank holding-companies. Commodity prices have tended to fall between 2011 and 2016, including the notable decrease in oil prices over 2014 in particular. This is likely to have been a factor in the fall in UK credits for the mining and quarrying industries; more detail can be found in our January 2017 analysis article.
Figure 21: Total UK foreign direct investment credits by industry, 2011 to 2016
Source: Office for National Statistics
Download this chart Figure 21: Total UK foreign direct investment credits by industry, 2011 to 2016
Image .csv .xlsThe values of UK assets by industry have remained more stable than credits and have increased overall from 2011 to 2016. Notably, UK asset values have increased by £57.4 billion in 2016 compared with 2011 in the professional and support industry grouping (Figure 22). UK FDI assets in financial and insurance industries were the only group for which values have decreased over that period, by £22.5 billion. All industries show higher asset values in 2016 compared with 2015, most notably in manufacturing where assets increased by £44.7 billion.
Figure 22: Total UK foreign direct investment assets by industry, 2011 to 2016
Source: Office for National Statistics
Download this chart Figure 22: Total UK foreign direct investment assets by industry, 2011 to 2016
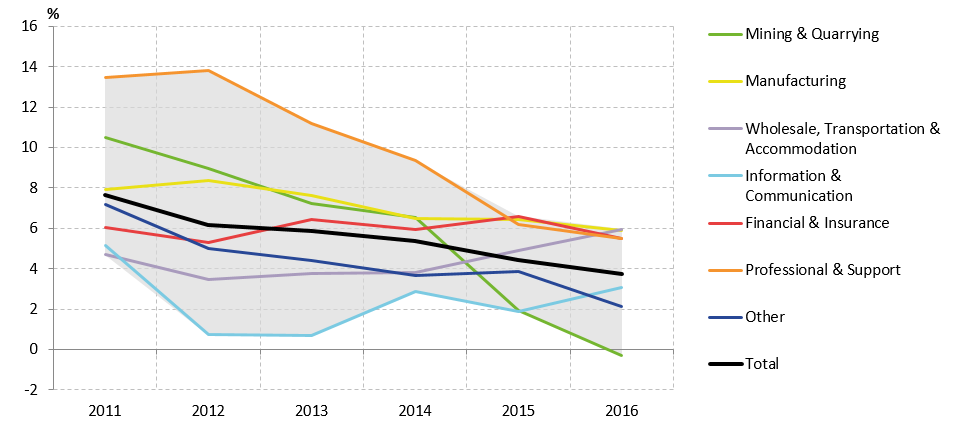
Image .csv .xlsImplied rates of return by industry on UK assets have continued to fall
The decline in the value of UK credits coincided with relatively higher asset values, indicating a fall in implied rates of return for most industries. Previous analysis noted the downward trend in the rates of return on UK assets. This is mirrored in most industrial groups with the exception of wholesale, transportation and accommodation, where rates of return rose by 1.3 percentage points to 6.0% from 2011 to 2016. Mining and quarrying experienced the largest percentage point fall in the implied rate of return, falling by over 10 percentage points from 2011 to be negative in 2016 – indicating losses within the industry exceeded profits.
Movements between 2015 and 2016 show that rates of return fell across all industries with the exception of the information and communication, and the wholesale, transportation and accommodation industries – with the latter experiencing the highest implied rate of return in 2016. The swathe of implied rates of return by industry (shaded grey in Figure 23) shows that the range of rates across these industries has narrowed considerably between 2011 and 2016. This narrowing of the range also happened for the spread of rates of return on assets by continent (Figure 13), although in this case the range widened slightly in 2016 from 2015. Most of this narrowing can be seen from changes in the highest rate of return falling relative to the lowest rate per year, with those of the remaining industries being clustered around the UK average rate of return.
Figure 23: Implied rates of return on UK FDI assets by industry, 2011 to 2016, £ billion
Source: Office for National Statistics
Download this image Figure 23: Implied rates of return on UK FDI assets by industry, 2011 to 2016, £ billion
.PNG (44.4 kB) .xlsx (502.7 kB)
Figure 24 presents the percentage point contributions made by each industry grouping to the overall implied rate of return generated on UK FDI assets. As can be seen, manufacturing has been the main contributor to the overall rate of return in all periods between 2011 and 2016 – although its contribution has fallen by 0.7 percentage points. The mining and quarrying industries used to be the second largest contributor to UK returns on FDI assets abroad; however, this declined by 1.9 percentage points and contributed negatively to the overall rate of return in 2016.
Figure 24: Contributions to the implied rate of return on assets by industry, 2011 to 2016
Source: Office for National Statistics
Download this chart Figure 24: Contributions to the implied rate of return on assets by industry, 2011 to 2016
Image .csv .xlsThe values of UK FDI debits have increased with the value of liabilities over recent years
The value of UK debits has increased by £8.9 billion between 2011 and 2016, but much of this increase has been led by two annual changes. These changes occur from 2012 to 2013 and from 2015 to 2016, the latter of which accounts for over three-quarters of the increase over the period.
Increases in the value of debits in some industries have been partially offset by decreases in others. The largest changes in FDI debits for 2016 compared with 2011 are the increase in manufacturing of £5.4 billion and decrease in mining and quarrying of £4.2 billion. The £6.8 billion increase in debits between 2015 and 2016 was attributable mainly to rises in the professional and support (£4.1 billion) and manufacturing (£2.6 billion) industries. The increases in FDI debits in 2016 were partially offset by falls in the information and communication, and other industries.
Figure 25: Total UK foreign direct investment debits by industry, 2011 to 2016
Source: Office for National Statistics
Download this chart Figure 25: Total UK foreign direct investment debits by industry, 2011 to 2016
Image .csv .xlsLiabilities have increased for all industry groupings between 2011 and 2016. The largest increases over this period were in financial and insurance industries, which were £203.2 billion higher in 2016 than in 2011; the value of liabilities in this industry has more than doubled over this period (Figure 26). This is the only grouping in which liabilities have increased consistently year-on-year.
The increase in UK FDI liabilities in 2016 from 2015 is explained largely by a pick-up in inward mergers and acquisitions activity. One industry that displays this increase is manufacturing, which was £99.3 billion higher in 2016 than in 2015. Increases in both debits and liabilities suggest a large impact of mergers and acquisitions activity.
Figure 26: Total UK foreign direct investment liabilities by industry, 2011 to 2016
Source: Office for National Statistics
Download this chart Figure 26: Total UK foreign direct investment liabilities by industry, 2011 to 2016
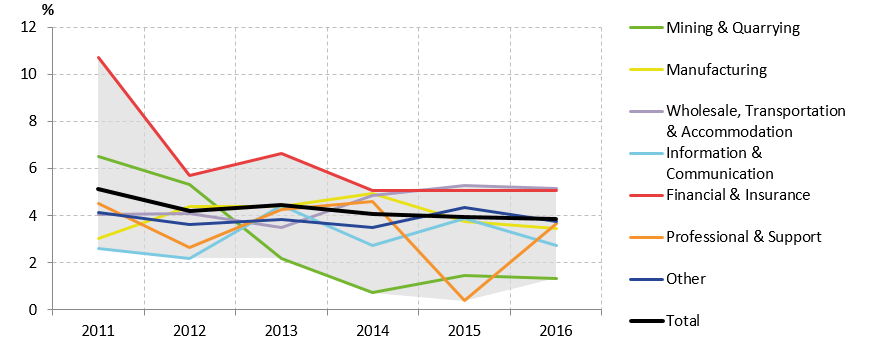
Image .csv .xlsImplied rates of return on liabilities were falling but have now stabilised
The implied rate of return for total UK FDI liabilities has shown a broadly constant trend between 2011 and 2016, but trends at an industry level have continued to vary. Implied rates of return for financial and insurance services were 5.1% in 2016, or 5.7 percentage points lower than that in 2011 (Figure 27). Financial and insurance services experienced the largest decrease in implied rates of return over the period, but remain at the second-highest rate in 2016. On the other hand, professional and support services had similar implied rates of return in 2011 and 2016, but varied over the intervening years.
As with implied rates of return for assets, the highest and lowest implied rates of return for liabilities were wholesale, transportation and accommodation, and mining and quarrying, with 5.2% and 1.3% respectively. All industry groupings showed decreases in implied rate of return from 2015 to 2016 except professional and support services, which increased by 3.3 percentage points. This offset the falls in returns for all other industry groupings, resulting in the same implied rate of return for liabilities in 2015 and 2016.
Figure 27: Liabilities implied rates of return by industry, 2011 to 2016
Source: Office for National Statistics
Download this image Figure 27: Liabilities implied rates of return by industry, 2011 to 2016
.PNG (37.4 kB) .xlsx (502.9 kB)
The two main industries contributing to the overall rate of return on UK FDI liabilities in 2016 were the financial and insurance, and manufacturing industries. The overall rate of return on UK FDI liabilities fell by 1.3 percentage points to 3.9 percentage points between 2011 and 2016. The majority of this fall was attributable to the financial and insurance, and mining and quarrying industries, which saw their contributions fall by 0.8 and 0.5 percentage points respectively over the period. Between 2015 and 2016, the rate of return on UK FDI liabilities saw little change, with positive contributions from professional and support, and manufacturing industries offset by negative contributions from other industries.
Figure 28: Contributions to the implied rate of return on foreign direct investment liabilities by industry, weighted by the share of each group in total liabilities, 2011 to 2016
Source: Office for National Statistics
Download this chart Figure 28: Contributions to the implied rate of return on foreign direct investment liabilities by industry, weighted by the share of each group in total liabilities, 2011 to 2016
Image .csv .xls7. Foreign direct investment by industry and continent
Previous sections in this article presented foreign direct investment (FDI) statistics by industry and continent separately. This section combines these approaches to show the industry composition of FDI involving the UK per continent. Details of the countries included in each continent can be found in Annex A and those for the industries in each category in Annex B.
The charts in this section show the industrial composition of FDI as a proportion of the total value for the continent. The UK has the greatest value of FDI assets and liabilities with the European Union. In 2016, these were £645.1 billion and £661.3 billion respectively. For FDI assets, this was nearly double the value for the continent with the second-highest assets value (North Americas) and more than six times greater than that with the “rest of the world”. Presenting these values on the same axis would make it difficult to view the lower-value components, whereas framing these relative to the relevant continental total facilitates these comparisons.
The proportions of UK FDI assets in 2016 are more similar to the respective proportions in 2011 than in the same comparison of credits
The industry composition of UK FDI assets across most continents in 2016 is relatively unchanged from the proportions seen in 2011. Mining and quarrying, and manufacturing industries remained the largest components for UK FDI in the EU, North Americas, Asia and “rest of the world” (Figure 29). The components of UK FDI in non-EU Europe were also relatively consistent in these two years, although here it is the “other” industries that were the largest component. The main exception to this comparison is with the Central and South (CS) Americas. Mining and quarrying accounted for over half (54.9%) of all CS American assets in 2011. This proportion has since fallen by 37.4 percentage points to 17.5% in 2016, when “other” industries were the largest component.
Figure 29: UK assets by industry and continent in 2011 and 2016
Source: Office for National Statistics
Notes:
- Some results have been suppressed to mitigate disclosure.
Download this chart Figure 29: UK assets by industry and continent in 2011 and 2016
Image .csv .xlsThe proportion of UK FDI credits from manufacturing industries was higher in 2016 than in 2011 for all continents except the North Americas. Indeed, the shares of manufacturing credits in non-EU Europe, CS Americas and “rest of the world” were all more than 10 percentage points higher in 2016 than in 2011. For Asia, the change in the proportion of credits from finance and insurance was also above 10 percentage points. The largest positive percentage-point differences were relatively smaller for the EU and North Americas in financial and insurance, and wholesale, transport and accommodation industries respectively.
Figure 30: UK credits by industry and continent in 2011 and 2016
Source: Office for National Statistics
Notes:
- Some results have been suppressed to mitigate disclosure.
Download this chart Figure 30: UK credits by industry and continent in 2011 and 2016
Image .csv .xlsFinancial and insurance industries have been part of the changing composition of inward investment in the UK
There tends to be a greater proportion of UK FDI liabilities per continent in services industries than mining and quarrying, and manufacturing relative to UK FDI assets. Services industries accounted for over 60% of liabilities per continent in 2011 and also in 2016, with the exception of liabilities with the EU. Within those services industries, financial and insurance, or wholesale, transport and accommodation tended to have the largest proportion of the groups presented in Figure 31. This is in line with the evolution of UK economic activity towards more services-based industries.
The industry proportions for the EU and North Americas for UK FDI liabilities have changed a little more than those of assets. For the EU, the proportion of liabilities in manufacturing industries increased by 9.2 percentage points, to 32.9% between these two years. This reflects the increase in manufacturing liabilities in 2016 that was mentioned earlier.
For the North Americas, the proportion of liabilities in financial and insurance industries was 13.4 percentage points higher in 2016 (at 46.8%) than in 2011. This is part of an adjustment in the distribution of financial and insurance liabilities that also saw the proportions increase with the EU, Asia and non-EU Europe. The change between 2011 and 2016 was especially notable for non-EU Europe, which went from 27.5% of total non-EU European assets in 2011 to 47.8% by 2016. This is likely to be reflecting the evolving structure of multi-national companies across these regions.
Figure 31: UK liabilities by industry and continent in 2011 and 2016
Source: Office for National Statistics
Notes:
- Some results have been suppressed to mitigate disclosure.
Download this chart Figure 31: UK liabilities by industry and continent in 2011 and 2016
Image .csv .xlsOn the other hand, the largest percentage point decrease in the proportion of continental liabilities was for FDI liabilities in wholesale, transport and accommodation industries from Asia. This proportion was 15.1 percentage points lower in 2016 than it was in 2011, from 28.0% to 12.9%. The same industry group was also 12.1 percentage points lower for FDI from the CS Americas, from 25.5% in 2011 to 13.3% by 2016. The overall trend in the value of these liabilities has seen a slight increase over these years, suggesting that FDI from other regions has acted to offset these falls, or as the values of Asian and CS American liabilities have increased, values in wholesale, transport and accommodation have increased at a slower rate.
As with the changes in FDI liabilities, the more notable differences between 2011 and 2016 for debits are within the proportions of debits in wholesale, transport and accommodation, and financial and insurance industries. The largest percentage point increase for the EU is for debits in wholesale, transport and accommodation, which was 15.3 percentage points higher (23.6% to 39.0%) between these two years (Figure 32). The proportion of debits from non-EU Europe was 11.1 percentage points higher too, with another notable increase for the “rest of the world”.
At the same time, the proportions of debits from financial and insurance industries have seen some large percentage point decreases, with Asia (29.4 percentage points to 35.8%) and the EU (13.0 percentage points to 12.6%). These appear to have had different impacts on the overall trends. The value of UK debits with the EU were lower in 2016 than in 2011, indicating a shift in the composition of UK debits between the industries over that time. However, Asian debits were higher in 2016 than 2011, suggesting that debits in financial and insurance industries may not have grown as fast as those in other industries to see this proportion lower in 2016 than in 2011.
Figure 32: UK debits by industry and continent in 2011 and 2016
Source: Office for National Statistics
Notes:
- Some results have been suppressed to mitigate disclosure.
Download this chart Figure 32: UK debits by industry and continent in 2011 and 2016
Image .csv .xls8. Distributional analysis using UK FDI microdata
UK direct investment held abroad is more concentrated among the largest investors than that of overseas direct investors in the UK
Traditionally a small number of the largest multi-national companies have accounted for a large proportion of UK assets and liabilities. These companies are defined as the top 25 by stock of foreign direct investment (FDI). Figure 33 shows that the largest 25 FDI investors accounted for half of total UK FDI assets in 2016. The importance of these companies is evident, as the next largest 25 companies only account for a further 10 percentage points of UK assets. Furthermore, the impact of adding each group diminishes despite the number of firms within the later groups increasing. All firms account for 82% of total UK FDI assets, with the rest held by monetary financial institutions (MFIs) and other categories of investment, which are counted separately.
Figure 33: Distribution of UK foreign direct investment assets grouped by asset values in descending order, 2015 and 2016
Source: Office for National Statistics
Download this chart Figure 33: Distribution of UK foreign direct investment assets grouped by asset values in descending order, 2015 and 2016
Image .csv .xlsA similar trend is evident for UK liabilities, but the stock is less concentrated among the biggest companies. The largest 25 investors held 38% of total UK FDI liabilities in 2016 (Figure 34), with the smaller companies accounting for greater proportions compared with UK assets. For example, adding the second-largest group of 25 companies increases the proportion of UK liabilities by 13 percentage points to 51%, whereas these companies add 10 percentage points to the proportion of UK FDI assets among the top 50 largest companies. Furthermore, if all companies except MFIs and other categories of investment are excluded, then 93% of UK liabilities are represented compared with 82% of UK assets.
Figure 34: Distribution of UK foreign direct investment liabilities grouped by liabilities values in descending order, 2015 and 2016
Source: Office for National Statistics
Download this chart Figure 34: Distribution of UK foreign direct investment liabilities grouped by liabilities values in descending order, 2015 and 2016
Image .csv .xlsThe different distributions for outward and inward positions can be partly explained by the structure of global multi-national companies and how UK FDI statistics are collected. These focus on the UK-side of both outward and inward investments. A parent company in the UK is likely to own a number of subsidiaries across the world, resulting in UK assets being concentrated in a small number of the largest multi-nationals. In contrast, it is companies in receipt of investment in the UK that are identified, as opposed to the foreign multi-national making the investment. Therefore, companies that all receive investment from one multi-national but are separate legal entities will be recorded in the microdata as individual companies, since the focus of the FDI survey is on the UK-side of the transaction.
The performance of the largest 25 outward and inward investors has contributed to the fall in net FDI earnings up to 2016
It is also possible to identify trends in earnings for the 25 largest FDI companies. The greatest earnings are generated by those companies with the largest positions. However, the cumulative changes in earnings presented in Figure 35 show that lower credits among the top 25 outward companies has contributed the most to falling net FDI earnings since 2011. These accounted for £42.2 billion of the £55.3 billion overall decline, or four-fifths of the change in net FDI earnings between 2011 and 2016. This is also equivalent to over half (56.5%) of the fall in the current account balance between 2011 and 2016.
In contrast, for UK debits the performance of the largest 25 inward investors has been comparatively better, with debits increasing by £1.9 billion over the period. This is shown as a negative value in Figure 35 because higher debits lower net FDI earnings. The other inward companies account for a larger proportion of the decline in net FDI earnings, with UK debits increasing by £7.1 billion while UK credits fell by £4.1 billion across the remaining outward investors.
Figure 35: Cumulative change in UK credits and debits from 2011 to 2016, broken down by the top 25 companies and the remainder

Source: Office for National Statistics
Download this image Figure 35: Cumulative change in UK credits and debits from 2011 to 2016, broken down by the top 25 companies and the remainder
.PNG (10.6 kB) .xlsx (12.6 kB)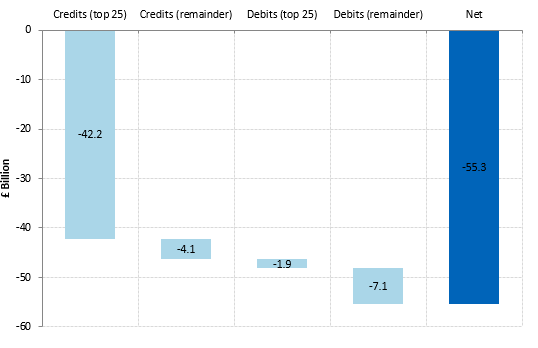
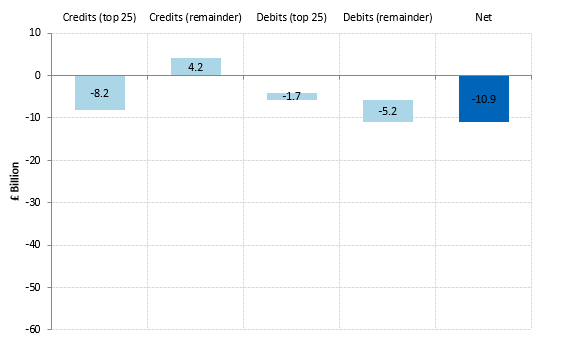
Section 2 showed that net FDI earnings continued to fall in 2016 from 2015. The value of FDI credits was lower in 2016 whereas that of debits was higher, leading to marginally-negative net FDI earnings for the UK.
Figure 36 extends the distribution of earnings among the top 25 outward and inward companies and the remainder for changes between 2015 and 2016. It is notable that credits from the remainder of investors outside of the top 25 increased by £4.2 billion. This partly offset the £8.2 billion fall in credits from the top 25 investors. The same is also true for debits from the remainder of inward investors, which together saw debits increase by more than those of the largest 25 inward investors. Overall, the decrease in the value of credits accounted for roughly one-third of the decrease in net earnings over 2016, with the increased value of debits covering the remaining two-thirds.
Figure 36: Change in UK credits and debits from 2015 to 2016, broken down by the top 25 companies and the remainder
Source: Office for National Statistics
Download this image Figure 36: Change in UK credits and debits from 2015 to 2016, broken down by the top 25 companies and the remainder
.PNG (9.8 kB) .xlsx (11.4 kB)
9. Future analytical plans
The next edition in this analytical series will look to develop the Experimental Statistics first published in summer 2017. This includes microdata linking to update estimates for UK FDI by ultimate controlling parent (rather than on the immediate controlling parent at present) and comparing the attributes of firms with and without FDI links. This article is planned for publication in summer 2018. In meantime, any suggestions on how these analyses could be developed further, or have been used to develop your own understanding, would be gratefully received at fdi@ons.gov.uk.
Back to table of contents10. Acknowledgements
Authors: Callum Cunningham, Sami Hamroush, Philip Johnson and Andrew Jowett.
The authors would like to acknowledge the contributions from John Abram, Claire Dobbins, Michael Hardie, Rachel Jones, Deborah Kennion, Laura Pullin, Blu Mansfield and Robert Satherly.
Back to table of contents11. Quality and methodology
The Foreign direct investment Quality and Methodology Information report contains important information on:
the strengths and limitations of the data and how it compares with related data
uses and users of the data
how the output was created
the quality of the output including the accuracy of the data
12. Annex A: Details of countries within each continent for foreign direct investment statistics
Asia:
Abu Dhabi, Afghanistan, Armenia, Azerbaijan, Bahrain, Bangladesh, Bhutan, Brunei Darussalam, Burma/Myanmar, Cambodia, China, Dubai, Georgia, Hong Kong, India, Indonesia, Iran, Iraq, Israel, Japan, Jordan, Kazakhstan, Kuwait, Kyrgyzstan, Laos, Lebanon, Macao, Malaysia, Maldives, Mongolia, Nepal, North Korea, Oman, Pakistan, Palestinian Territory, Philippines, Qatar, Saudi Arabia, Singapore, South Korea, Sri Lanka, Syria, Taiwan, Tajikistan, Thailand, Timor-Leste, Turkmenistan, United Arab Emirates, Uzbekistan, Vietnam, Yemen.
EU Europe:
Austria, Belgium, Bulgaria, Croatia, Cyprus, Czech Republic, Denmark, Estonia, Finland, France, Germany, Greece, Hungary, Ireland, Italy, Latvia, Lithuania, Luxembourg, Malta, Netherlands, Poland, Portugal, Romania, Slovakia, Slovenia, Spain, Sweden.
Non-EU Europe:
Albania, Andorra, Belarus, Bosnia and Herzegovina, Faroe Islands, Gibraltar, Guernsey, Holy See (Vatican City State), Iceland, Isle of Man, Jersey, Liechtenstein, Macedonia, Moldova, Montenegro, Norway, Russian Federation, San Marino, Serbia, Switzerland, Turkey, Ukraine.
North Americas:
Canada, Greenland, United States.
Central and South Americas:
Anguilla, Antigua and Barbuda, Argentina, Aruba, Bahamas, Barbados, Belize, Bermuda, Bolivia, Bonaire, Sint Eustatius and Saba, Brazil, Cayman Islands, Chile, Colombia, Costa Rica, Cuba, Curacao, Dominica, Dominican Republic, Ecuador, El Salvador, Falkland Islands, Grenada, Guatemala, Guyana, Haiti, Honduras, Jamaica, Mexico, Montserrat, Nicaragua, Panama, Paraguay, Peru, Puerto Rico, Saint Lucia, Sint Maarten, St Kitts and Nevis, St Vincent and the Grenadines, Suriname, Trinidad and Tobago, Turks and Caicos Islands, Uruguay, Venezuela, British Virgin Islands, US Virgin Islands.
Rest of the World
Algeria, American Samoa, Angola, Antarctica, Australia, Benin, Botswana, Bouvet Island, British Indian Ocean Territory, Burkina Faso, Burundi, Cameroon, Cape Verde, Central African Republic, Chad, Christmas Island, Cocos (Keeling) Islands, Comoros, Congo, Cook Islands, The Democratic Republic of the Congo (Zaire), Djibouti, Egypt, Equatorial Guinea, Eritrea, Ethiopia, Fiji, French Polynesia, French Southern and Antarctic Lands, Gabon, Gambia, Ghana, Guam, Guinea, Guinea Bissau, Heard Island and McDonald Islands, Côte d'Ivoire (Ivory Coast), Kenya, Kiribati, Lesotho, Liberia, Libya, Madagascar, Malawi, Mali, Marshall Islands, Mauritania, Mauritius, Micronesia, Morocco, Mozambique, Namibia, Nauru, New Caledonia, New Zealand, Niger, Nigeria, Niue, Norfolk Island, Northern Mariana Islands, Palau, Papua New Guinea, Pitcairn, Rwanda, Samoa, Sao Tome and Principe, Senegal, Seychelles, Sierra Leone, Solomon Islands, Somalia, South Africa, South Georgia and The South Sandwich Islands, South Sudan, St Helena, Ascension and Tristan da Cunha, Sudan, Swaziland, Tanzania, Togo, Tokelau, Tonga, Tunisia, Tuvalu, Uganda, US Minor Outlying Islands, Vanuatu, Wallis and Futuna, Zambia, Zimbabwe.
Back to table of contents13. Annex B: Details of Standard Industrial Classification 2007: SIC 2007 industries for each foreign direct investment industrial grouping used
Annex B – Details of Standard Industrial Classification 2007 industries for each foreign direct investment industrial grouping used
| Industry grouping | Section(s) within SIC07 | |
|---|---|---|
| Mining and Quarrying | B - Mining and quarrying | |
| Manufacturing | C - Manufacturing | |
| Wholesale, Transportation and Accommodation | G - Wholesale and retail trade; repair of motor vehicles and motorcycles | |
| H - Transportation and storage | ||
| I - Accommodation and food service activities | ||
| Information and Communication | J - Information and communication | |
| Financial and Insurance | K - Financial and insurance activities | |
| Professional and Support | M - Professional, scientific and technical activities | |
| N - Administrative and support service activities | ||
| Other | A - Agriculture, forestry and fishing | |
| D - Electricity, gas, steam and air conditioning supply | ||
| E - Water supply, sewerage, waste management and remediation activities | ||
| F - Construction | ||
| L - Real estate activities | ||
| O - Public administration and defence; compulsory social security | ||
| P - Education | ||
| Q - Human health and social work activities | ||
| R - Arts, entertainment and recreation | ||
| S - Other service activities | ||
| T - Activities of households as employers; undifferentiated goods- and services-producing activities of households for own use | ||
| U - Activities of extra-territorial organisations and bodies | ||
| Source: Office for National Statistics | ||