Table of contents
- Main points
- Things you need to know about this release
- Government spending on science, engineering and technology down as a percentage of GDP
- Civil departments increase their share of total UK government spending, to almost a third
- Research councils' expenditure falls for third consecutive year
- Civil departments' expenditure increases for the sixth successive year
- Higher education funding councils' expenditure remains a fifth of the UK total despite decrease
- Long-term downward trend for UK defence R&D expenditure continues
- UK contribution to EU R&D expenditure more than double that in 2005
- Links to related statistics
- Quality and methodology
1. Main points
The UK government’s expenditure on science, engineering and technology (SET) continued to grow in 2016, expanding £0.1 billion to £11.5 billion, an increase of 1.2%.
The 2016 SET estimate consists of expenditure on research and development (R&D) of £10.3 billion, UK contributions to EU R&D expenditure of £0.9 billion and knowledge transfer of £0.3 billion.
The UK research councils contributed the most to expenditure on SET in 2016 at £3.4 billion, 30% of the total.
In constant prices, since 2013, UK government expenditure on SET has remained relatively stable, falling by just £0.1 billion (0.9%) to £11.5 billion in 2016.
Civil departments’ expenditure on SET over the long-term grew by 27%, from £2.6 billion in 2005 in constant prices (adjusted to remove the effects of inflation) to £3.3 billion in 2016.
Defence expenditure on SET decreased from 2005 by 41% in constant prices to £1.6 billion in 2016.
2. Things you need to know about this release
UK government expenditure on science, engineering and technology (SET) covers estimates of expenditure by government departments, research councils and higher education funding councils (HEFCs). Most estimates are on a net expenditure basis, that is, in-house research and development (R&D) performed, plus purchased or funding provided for R&D, less funding received for R&D. Estimates of expenditure on knowledge transfer and the UK’s contribution to the EU’s R&D budget are also included.
SET should not be confused with the Gross domestic expenditure on research and development, UK: 2016 statistical bulletin published on 15 March 2018, which only includes expenditure on R&D performed “in-house”, that is, by organisations themselves, by all sectors of the economy. This is explained in more detail in the UK gross domestic expenditure on research and development Quality and Methodology Information. R&D and related concepts follow internationally-agreed standards defined by the Organisation for Economic Cooperation and Development (OECD), as published in the Frascati Manual (2015).
The main source of estimates for this publication is the annual Government Research and Development survey (GovERD).
The gross domestic product (GDP) measure used is non-seasonally adjusted money GDP between 1955 to 1956 and 2015 to 2016 (1955 to 2016) consistent with UK Economic Accounts published on 22 November 2017.
Most of the data series started in 2001 and constant price comparisons have been made using the start of the current dataset in 2005.
All figures quoted are in current prices unless otherwise stated.
Back to table of contents3. Government spending on science, engineering and technology down as a percentage of GDP
UK government expenditure on science, engineering and technology (SET) was £11.5 billion in 2016. This was up from £11.4 billion in 2015, an increase of 1.2% (£141 million).
In constant prices, since 2013, UK government expenditure on SET has remained relatively stable, falling by just £0.1 billion (0.9%) to £11.5 billion in 2016. While there was growth of £0.3 billion in expenditure by civil and defence departments and in the contribution to the EU research and development (R&D) budget, this was offset by a decline in expenditure by research councils and higher education funding councils over this period, of £0.4 billion.
Total expenditure on SET represented 0.58% of gross domestic product (GDP), a decrease from 0.60% in 2015.
In comparison, government expenditure on performing R&D (in-house) as detailed in the Gross domestic expenditure on research and development, UK: 2016 and Table 15 of the SET datasets represented 0.11% of GDP, unchanged from 2015.
Purchased or funded R&D fell to 0.49% of GDP compared with 0.50% in 2015. Figure 1 shows SET, purchased or funded R&D and in-house R&D as a percentage of GDP from 2011 to 2016.
Figure 1: UK government expenditure on science, engineering and technology, purchased or funded R&D, and in-house R&D as percentage of gross domestic product
2011 to 2016
Source: Office for National Statistics
Download this chart Figure 1: UK government expenditure on science, engineering and technology, purchased or funded R&D, and in-house R&D as percentage of gross domestic product
Image .csv .xls4. Civil departments increase their share of total UK government spending, to almost a third
UK government estimates of science, engineering and technology (SET) are categorised into expenditure by research councils, higher education funding councils (HEFCs) and by civil and defence departments, most of which include elements of knowledge transfer. Estimates of the UK’s contribution to the EU’s research and development (R&D) expenditure made by HM Treasury are also included.
Figure 2 shows the contribution each sector of government made to the SET estimate in 2016. Almost a third (30%) of UK government expenditure on SET was by research councils, with civil departments and HEFCs contributing 29% and 20% respectively. Defence expenditure and contributions to EU R&D expenditure made up the remaining 14% and 8% respectively.
Figure 2: Composition of UK government expenditure on science, engineering and technology, 2016

Source: Office for National Statistics
Notes:
- Percentages sum to 101 due to rounding.
- HEFCs - Higher Education Funding Councils.
Download this image Figure 2: Composition of UK government expenditure on science, engineering and technology, 2016
.png (42.0 kB) .xls (33.3 kB)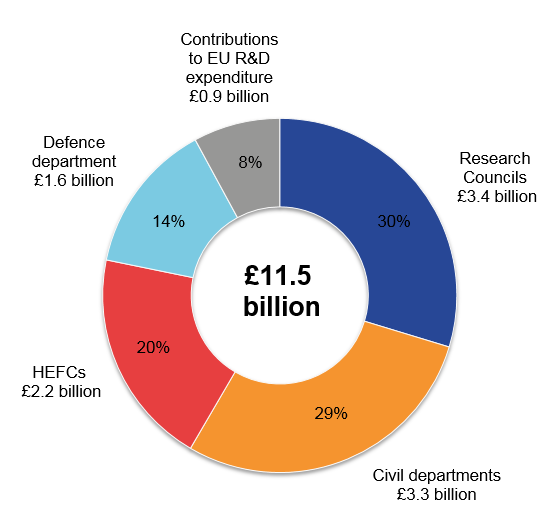
Figure 3 shows changes in SET components between 2005 and 2016 in constant prices. Defence expenditure decreased by £1.1 billion (41%) from £2.8 billion in 2005 to £1.6 billion in 2016. Over the same period there was growth in civil departments’ expenditure on SET of £0.7 billion (27%).
Figure 3: Components of UK government expenditure on science, engineering and technology in constant prices, 2005 to 2016
Source: Office for National Statistics
Notes:
- HEFCs - Higher Education Funding Councils.
Download this chart Figure 3: Components of UK government expenditure on science, engineering and technology in constant prices, 2005 to 2016
Image .csv .xls5. Research councils' expenditure falls for third consecutive year
UK Research and Innovation (UKRI) has been created as a result of the Higher Education and Research Act (HERA). The strategic partnership of the UK's seven Research Councils, Research Councils UK (RCUK) will transition into UKRI in 2018.
Each year, the research councils perform research and development (R&D) covering the full spectrum of academic disciplines, from the medical and biological sciences to astronomy, physics, chemistry, engineering, social sciences, economics, environmental sciences and the arts and humanities.
Expenditure on science, engineering and technology (SET) by research councils was £3.4 billion in 2016. This was down £5 million (0.2%) since 2015. In constant prices, this was a fall of £82 million (2%) since 2015.
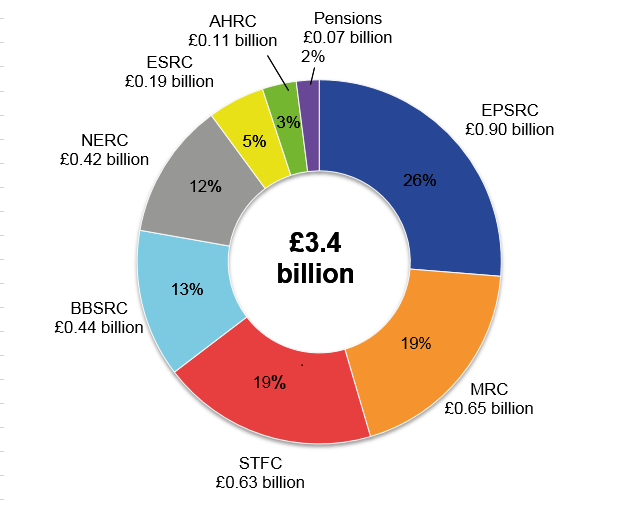
The research council with the highest expenditure on SET (£0.9 billion in 2016) continued to be the Engineering and Physical Sciences Research Council (EPSRC), representing 26% of research councils' SET expenditure.
The majority of EPSRC expenditure was funding of R&D for UK higher education institutes at £0.8 billion. However, it did not perform any R&D itself. While the EPSRC saw a rise of 3% in expenditure on SET, the Medical Research Council’s expenditure saw the largest movement, falling by 21% (£168 million) from its high of £0.8 billion in 2015. This represented 19% of all research councils’ expenditure on SET.
The Science and Technology Funding Council had the highest year-on-year growth of the research councils, with £80 million (15%). Over the long-term, the EPSRC had the highest growth since 2005, in constant prices, of 32% (£218 million).
In the category of health, the NHS saw its second successive year-on-year decrease in constant prices with “Health” as a socio-economic objective, falling from 23% of total net government funding of R&D to 21% over the same period (Table 8 of the SET datasets).
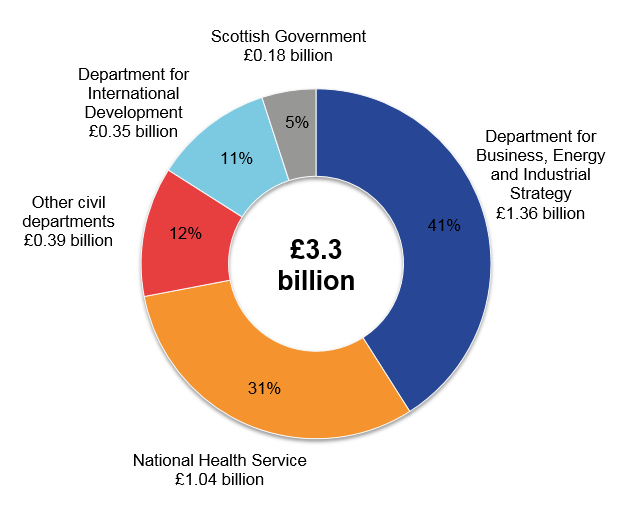
In 2016, expenditure on SET by the NHS was £1.0 billion and accounted for 31% of total civil departments’ expenditure on SET. This proportion was down from 33% in 2015, although the NHS remained at 9% of total UK expenditure on SET.
The research councils’ estimated expenditure on SET includes their pension arrangements. These pension contributions are included separately in the datasets associated with this publication and in Figure 4.
Figure 4: Breakdown of UK Research Councils’ expenditure on science, engineering and technology, 2016
Source: Office for National Statistics
Notes:
- EPSRC – Engineering and Physical Sciences Research Council.
- MRC – Medical Research Council.
- BBSRC – Biotechnology and Biological Sciences Research Council.
- STFC – Science and Technology Facilities Council.
- NERC – Natural Environment Research Council.
- ESRC – Economic and Social Research Council.
- AHRC – Arts and Humanities Research Council.
- Percentages sum to 99 due to rounding.
Download this image Figure 4: Breakdown of UK Research Councils’ expenditure on science, engineering and technology, 2016
.png (47.4 kB) .xls (33.3 kB)
6. Civil departments' expenditure increases for the sixth successive year
The UK government owns many research institutes and laboratories that carry out research and development (R&D) and are managed by various government departments. It also uses a range of suppliers with facilities to carry out research, both inside and outside the UK.
In 2016, expenditure by civil departments on science, engineering and technology (SET) was £3.3 billion, showing growth of £184 million (6%) since 2015. In constant prices, the growth since 2005 was £708 million (27%). In 2016, four departments contributed £2.9 billion (88%) to the total. The Department for Business, Energy and Industrial Strategy (BEIS) was the largest contributor to this, with expenditure of £1.4 billion, making up 41% of total civil departments’ expenditure on SET (Figure 5).
Figure 5: Breakdown of UK government civil departments’ expenditure on science, engineering and technology, 2016
Source: Office for National Statistics
Download this image Figure 5: Breakdown of UK government civil departments’ expenditure on science, engineering and technology, 2016
.png (45.8 kB) .xls (33.3 kB)
7. Higher education funding councils' expenditure remains a fifth of the UK total despite decrease
Higher education funding councils (HEFCs) promote and fund teaching and research in higher education institutions (HEIs).
All HEIs provide finance statistics to the Higher Education Statistics Agency (HESA). Grant income provided by HEFCs is used as a proxy to estimate government-funded research and development (R&D) expenditure in HEIs. This is explained in more detail in the UK gross domestic expenditure on research and development Quality and Methodology Information.
In 2016, expenditure on science, engineering and technology (SET) by HEFCs was £2.2 billion, a decrease of £10 million (0.5%) since 2015. In constant prices, this was a decrease of £61 million (2.7%) since 2015 and a decrease of £128 million (5.4%) since 2005. This contrasted with the decrease from the peak of £2.7 billion in 2009 (Figure 3).
The Higher Education Funding Council for England (HEFCE) provides the most research funding as it funds the highest number of HEIs. In 2016, expenditure by HEFCE on SET was £1.8 billion. This was 79% of the total HEFCs' expenditure on SET, a similar level to recent years.
Back to table of contents8. Long-term downward trend for UK defence R&D expenditure continues
Defence expenditure on science, engineering and technology (SET) was £1.6 billion in 2016, a drop of £12 million (0.8%) since 2015. This was the second consecutive fall since 2014, but still higher than its lowest point in 2011 when expenditure was £1.3 billion. In constant prices, since 2005, defence expenditure has decreased by £1.1 billion (41%) (Figure 3). While defence research fell by 18% over this period to £0.6 billion, defence experimental development fell by 50% to £1.0 billion. However, it continued to account for 16% of government net research and development (R&D) funding by socio-economic classification (see Table 8 of the SET datasets).
Back to table of contents9. UK contribution to EU R&D expenditure more than double that in 2005
In 2016, the UK contributed £0.9 billion to EU research and development (R&D) expenditure. In constant prices, this is more than double the value in 2005 (£0.4 billion). These figures were provided by HM Treasury and are broad estimates. This is because member states’ contributions are not made to individual expenditure programmes, but to the EU budget as a whole. They are therefore referred to as “indicative UK contributions to EU R&D expenditure”.
Back to table of contents11. Quality and methodology
The UK government expenditure on science, engineering and technology Quality and Methodology Information report contains important information on:
- the strengths and limitations of the data and how they compare with related data
- uses and users of the data
- how the output was created
- the quality of the output including the accuracy of the data