1. Main points
The 12-month growth rate of the Consumer Prices Index including owner occupiers’ housing costs (CPIH) was 1.7% in September 2019, unchanged from August 2019; this is the lowest annual rate since November 2016.
The input Producer Price Index (input PPI) fell by 2.8% on the year to September 2019, down from a fall of 0.9% in August 2019; this is the lowest annual rate since May 2016.
The output Producer Price Index (output PPI) grew by 1.2% in the 12 months to September 2019, down from growth of 1.7% in the 12 months to August 2019; this is the lowest annual rate since September 2016.
Average house prices in the UK increased by 1.3% in the year to August 2019, up from 0.8% in July 2019; however, over the past three years there has been a general slowdown in UK house price growth.
2. Statistician’s comment
Commenting on today’s inflation figures, ONS Head of Inflation Mike Hardie said:
“Inflation remained unchanged into September at its lowest rate since late 2016. Motor fuel and second-hand car prices fell, but were offset by price increases for furniture, household appliances and hotel rooms.
“Annual growth in UK house prices showed a moderate pick-up in August although it remains below the increases seen throughout 2018. Wales saw the strongest growth with prices continuing to fall in London and the South East”.
Back to table of contents3. Summary
Understanding inflation is important because it gives us knowledge about the cost of living faced by individuals, and firms. From a labour market perspective, an inflation rate lower than nominal earnings growth leads to real rises in wages of workers. These then feed into higher costs for firms using labour as an input, who may choose to pass these on to consumers.
It is also important to understand inflation from a monetary policy perspective. The Bank of England monitors inflation and growth in the UK economy in order to set the Bank interest rate. Currently the Bank of England targets a Consumer Prices Index (CPI) 12-month growth rate of 2%. The Bank of England expects growth in the UK to remain soft owing to the uncertainty regarding the UK’s exit from the European Union, and for inflation to fall in the near term, reflecting lower energy prices.
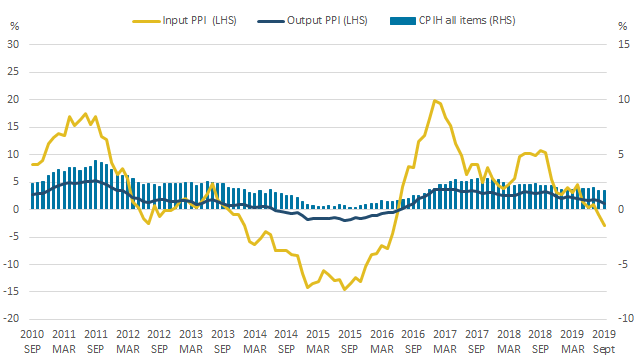
Today’s (16 October 2019) inflation figures are in line with the Bank of England’s inflation forecast. Figure 1 shows that the 12-month growth rate of the Consumer Prices Index including owner occupiers’ housing costs (CPIH) was 1.7% in September 2019, unchanged from August 2019. This is the lowest rate since November 2016.
The largest downward contributions to the change in the 12-month rate came from transport, and housing and household services. These downward effects were entirely offset by upward contributions from furniture, household equipment and maintenance, restaurants and hotels, and recreation and culture, leading to an overall effect of no change to the headline rate.
The input Producer Price Index (input PPI) fell by 2.8% on the year to September 2019, down from a fall of 0.9% in August 2019. This is the lowest annual rate since May 2016. Crude oil provided the largest downward contribution to the change in the 12-month growth rate.
The output Producer Price Index (output PPI) grew by 1.2% in the 12 months to September 2019, down from growth of 1.7% in the 12 months to August 2019. This is the lowest annual rate since September 2016. Eight out of ten product groups provided upward contributions to the annual rate of output inflation, with petroleum products, and chemical and pharmaceutical being the only groups providing a downward contribution.
Figure 1: The 12-month growth rates of input PPI and output PPI fell while that of CPIH was unchanged between August 2019 and September 2019
12-month growth rates for input Producer Price Index (PPI) (left-hand side), output PPI (left-hand side), and CPIH (right-hand side), UK, September 2010 to September 2019
Source: Office for National Statistics – Producer Price Index and Consumer Prices Index including owner occupiers' housing costs
Notes:
- These data are also available within the Dashboard: Understanding the UK economy.
Download this image Figure 1: The 12-month growth rates of input PPI and output PPI fell while that of CPIH was unchanged between August 2019 and September 2019
.png (17.8 kB) .xlsx (20.0 kB)
4. Core inflation
Inflation can often be driven by temporary factors that may be volatile. “Core inflation” is a measure that attempts to capture underlying inflationary pressure in the economy by excluding the more volatile energy, food, alcoholic beverages and tobacco components from the headline measure of Consumer Prices Index including owner occupiers’ housing costs (CPIH). This core measure of inflation is illustrated in Figure 2, alongside the headline measure of CPIH.
Figure 2: Core consumer prices inflation has generally followed the headline CPIH measure but has been less volatile since 1997
12-month growth rates for Consumer Prices Index including owner occupiers' housing costs (CPIH) inflation and “Core” CPIH inflation, %, UK, January 1997 to September 2019
Source: Office for National Statistics - Consumer Prices Index including owner occupiers' housing costs and “Core” Consumer Prices Index including owner occupiers' housing costs
Notes:
- “Core” inflation comprises all items in the CPIH, less energy, food, drink and tobacco.
Download this chart Figure 2: Core consumer prices inflation has generally followed the headline CPIH measure but has been less volatile since 1997
Image .csv .xlsCore inflation has generally followed the headline CPIH measure but has been less volatile over the time period presented in Figure 2. Both the core and headline measures of inflation have been generally slowing over the last 18 months. The core inflation rate increased to 1.6% in September 2019, up from 1.5% in August 2019.
Figure 3: The recent slowdown in growth of core inflation can be attributed to transport, and recreation and culture divisions
“Core” inflation (%) and contributions from divisions (percentage points), UK, January 2006 to September 2019
Source: Source: Office for National Statistics - “Core” Consumer Prices Index including owner occupiers' housing costs
Notes:
- "Core" inflation comprises all items in the CPIH, less energy, food, drink and tobacco.
- Stacked bars reflect the percentage point contributions of selected class-level items in the Classification of Individual Consumption by Purpose (COICOP) to the annual percentage change in the Core Consumer Prices Index including owner occupied housing. The contribution of each class-level item is estimated separately, before being aggregated to the categories above. Note that a reduction in the contribution of series to the annual rate of change need not imply falling prices but could also reflect a lower rate of increase.
- Housing is composed of actual rents for housing, owner occupiers’ housing costs, regular maintenance and repair of the dwelling, other services relating to the dwelling, water supply, sewerage collection and Council Tax and rates. Transport includes the purchase of vehicles, operation of personal transport equipment, transport services, passenger transport by road, rail, air and sea. Restaurant and hotels includes restaurants and cafes, canteens and accommodation services. Education reflects the division-level contribution. Recreation and culture reflects the division-level contribution. The ‘other goods and services’ category reflects the combined contributions of the remaining class-level items (clothing and footwear, furniture, household equipment and maintenance, health, communication, miscellaneous goods and services) and a small rounding error, bringing the sum of contributions to the Core CPIH. Please see the Consumer Prices Indices Technical Manual, 2019 on the ONS website for more details.
- Contributions may not sum to the total due to rounding.
Download this chart Figure 3: The recent slowdown in growth of core inflation can be attributed to transport, and recreation and culture divisions
Image .csv .xlsThe recent slowdown in the growth of core inflation can be attributed to transport, and recreation and culture divisions, as shown in Figure 3. The contributions made by the transport and catering categories are volatile over time but have declined in most recent months. This was offset partially by an increase in the contribution from the other goods and services category. The contributions made by restaurants and hotels, education and housing have been relatively stable in recent months.
Back to table of contents5. Producer price inflation
Differences in the rates of consumer goods and services inflation have become a persistent feature of the Consumer Prices Index including owner occupiers' housing costs (CPIH) and are reflected partly in the evolution of producer price indices – the prices that producers receive for their products from other firms.
While the 12-month growth rate of CPIH was 1.7% in September 2019, the prices of goods included in the CPIH grew by 0.9%, and the prices of consumer services grew by 2.2%. This divergence is particularly marked and is consistent with trends in the producer prices series, shown in Figure 4.
Figure 4: Annual inflation rate for producer manufacturing output prices has experienced greater changes than the annual inflation rate for producer services output prices
Annual growth rate of Gross Services Producer Price Index and Gross Output Manufacturing Producer Price Index, %, UK, Quarter 1 (January to March) 2003 to Quarter 3 (July to September) 2019
Source: Office for National Statistics – Producer Price Index
Notes:
- The manufacturing index used is gross, so it is comparable with the services index. This is different from the headline Producer Price Index which is a net measure.
Download this chart Figure 4: Annual inflation rate for producer manufacturing output prices has experienced greater changes than the annual inflation rate for producer services output prices
Image .csv .xlsThe output inflation rates of producers’ manufactured goods and services have followed similar tends since 2003, with the manufacturing inflation rate often being much higher in magnitude. Since Quarter 1 (Jan to Mar) 2017, the services inflation rate has been fluctuating around 1.5%, while the manufacturing inflation rate has fallen from 6.7% in Quarter 1 2017 to 1.3% in Quarter 3 (July to Sept) 2019. Similar trends are seen in the inflation rates of consumer goods and services, relative to producer goods and services respectively, over the same period. The range of change of the goods inflation rates is smaller in magnitude for consumers than for producers.
Recent movements in the effective exchange rate can explain some of the recent weakness in price pressure but is likely to affect different goods and services prices to differing extents. Movements in the exchange rate affect both producer and consumer prices, as it affects the price of both direct imports and products that use imported components. All other things being equal, if sterling appreciates (depreciates) against a foreign currency, the price of imports from that country will fall (rise), with a corresponding impact on domestic inflation.
Figure 5 plots an inverted sterling effective exchange rate index along with input and output producer inflation rates and the consumer inflation rate. An inverted effective exchange rate index means that an increase on the chart corresponds to a fall in the value of sterling, which would be expected to increase the growth rate of inflation, all else being equal, while the opposite is true for a fall in the inverted effective exchange rate.
Figure 5: Changes in sterling's value affect producer price inflation more quickly and with a larger magnitude than consumer prices
12 months growth rates of CPIH all items, input PPI, output PPI (left-hand side) and inverted sterling effective exchange rate index (right-hand side), UK, September 1999 to September 2019

Source: Office for National Statistics – Producer Price Index and Consumer Prices Index including owner occupiers' housing costs, Bank of England – Research Database
Download this image Figure 5: Changes in sterling's value affect producer price inflation more quickly and with a larger magnitude than consumer prices
.png (40.3 kB) .xlsx (27.4 kB)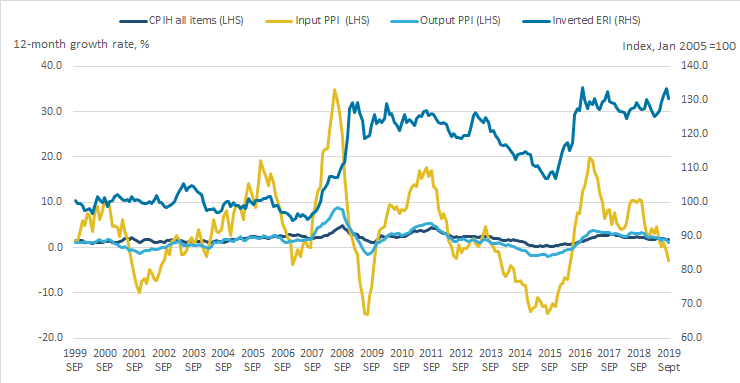
Figure 5 shows movements in the value of sterling to be reflected more closely and in greater magnitude in producer price inflation compared with consumer price inflation. Inflation rates have reflected changes in sterling’s value closely since the economic downturn, with appreciations (depreciations) of sterling corresponding to falls (increases) in the inflation rate.
More detailed analysis on extent and speed of exchange rate passthrough to consumer prices for different types of products, or products with different import intensities, can be found in Exchange rate passthrough and transmission to consumer prices following the 2015 to 2016 depreciation of sterling and the Prices economic commentary: September 2019.
Back to table of contents6. Import intensity
Total import intensity refers to percentage of the final household consumption that is either directly or indirectly due to imports. Both direct and indirect estimates of import intensity are reflected in the final price consumers face and include the effects of taxes, subsidies and margins. Indirect import intensity refers to goods and services that are produced domestically but use a degree of imported materials or services to make up the final production. Direct import intensity refers to goods and services that are produced abroad but imported into the UK.
Estimating the import intensity of the Consumer Prices Index including owner occupiers' housing costs (CPIH) basket is particularly relevant given the recent sterling exchange rate movements. The extent to which a weaker pound makes imports relatively more expensive for UK consumers depends upon the import intensity of consumer demand and the extent of the passthrough of the exchange rate. Analysis of the passthough is presented in the July 2019 Economic review. Figure 6 plots the contributions to the 12-month growth rate of CPIH by import intensity groups.
Figure 6: Changes to the inflation rate have been driven mainly by changes within the higher import intensity groups and energy
Contributions to the 12-month growth rate of CPIH by import intensity group, UK, September 2014 to September 2019
Source: Office for National Statistics - Consumer Prices Index including owner occupiers' housing costs
Notes:
- This analysis uses import intensity estimates for Consumer Prices Index including owner occupiers’ housing costs (CPIH) released on 17 July 2019, based on the methodology published in the January 2018 Economic review.
- Energy includes fuels and lubricants, electricity, gas, liquid fuels and solid fuels.
- Contributions may not sum to the total due to rounding.
Download this chart Figure 6: Changes to the inflation rate have been driven mainly by changes within the higher import intensity groups and energy
Image .csv .xlsSince January 2014, the lower import intensity groups and owner occupiers’ housing costs have made a relatively stable contribution to the headline 12-month growth rate for CPIH. Changes to the inflation rate have been driven mainly by changes within the contributions made by higher import intensity groups (25% to 40% and 40% and over) and energy. Since February 2017, the higher import intensive groups and energy have made a positive contribution to the overall growth rate of CPIH.
More recently, the contribution of energy to the 12-month growth rate of CPIH fell to 0.07 percentage points in January 2019, after the introduction of the constraint by the Office of Gas and Electricity Markets (Ofgem) on energy prices. In April 2019, the cap for the default tariff increased by 10%, increasing the contribution of energy to 0.38 percentage points. Since April 2019, all import intensity groups have provided a relatively stable contribution to the 12-month growth rate of CPIH.
The lowest import intensity category, 0 to 10%, has provided the largest contribution to CPIH from December 2017. Energy has maintained a positive contribution since October 2016. The 40% and over category has seen a steady increase over the period in its average yearly contribution, up to an average of around 0.26 percentage points in 2018, but has since seen a fall, with the current 2019 average being around 0.13 percentage points.
Back to table of contents7. Real wages
In recent months, wages have started to grow faster than inflation, resulting in workers experiencing real pay growth. The annual growth for regular average weekly earnings (AWE) for the three months to August 2019 was 3.8%, while the annual Consumer Price Index including owner occupiers’ housing costs (CPIH) for August was 1.7%.
Figure 7 shows the 12-month growth rate of regular AWE and CPIH from January 2005 to September 2019. It shows that from 2005 to mid-2008, real wage growth was positive. However, the onset of the economic downturn from mid-2008 saw real wages starting to become negative. After mid-2014, real wages started growing positively once again, but stalled after the UK voted to leave the EU, resulting in an increase in inflation caused by the depreciation of sterling. Once again, we have started seeing real wages pick up.
Positive real wages are good for workers as they increase their purchasing power. However, continued real wage growth eventually feeds into unit labour costs via the Producer Price Index (PPI) and raises inflation faced by consumers, reducing their purchasing power.
Figure 7: In recent months there has been an increase in wage growth in real terms
Annual growth rates for regular average weekly earnings and CPIH, UK, January 2005 to September 2019
Source: Office for National Statistics - Consumer Prices Index including owner occupiers' housing costs, and Monthly Wages and Salaries Survey
Notes:
- Regular average weekly earnings (AWE) data are for Great Britain and measure the amount of money paid to each worker per job per week, excluding benefits-in-kind, unearned income and arrears of pay.
- Earnings from people who are self-employed are excluded from the AWE estimates.
- The estimates are calculated before tax and other deductions and are seasonally adjusted.
- Regular pay excludes earnings from bonuses.
Download this chart Figure 7: In recent months there has been an increase in wage growth in real terms
Image .csv .xls8. House prices
Average house prices in the UK increased by 1.3% in the year to August 2019, up from 0.8% in July 2019. However, over the past three years, there has been a general slowdown in UK house price growth, driven mainly by a slowdown in the south and east of England.
The lowest annual growth was in London, where prices fell by 1.4% over the year to August 2019, followed by the South East, where prices fell by 0.6% over the year. The average UK house price was £235,000 in August 2019.
Even though the House Price Index has been falling in recent years, housing affordability remains an issue. Figure 8 shows the UK’s affordability ratio for former owner occupiers and first-time buyers. The affordability ratio has been calculated as the average dwelling price divided by the average recorded income of the borrowers. A higher ratio represents a less-affordable housing market.
Figure 8: Housing affordability has been decreasing since the late 1990s for both first-time buyers and former owner occupiers
Affordability ratio for former owner occupiers and first-time buyers, UK, Quarter 2 (April to June) 1992 to Quarter 2 2019
Source: Office for National Statistics - House price data: quarterly tables data based on a sub-sample of the Regulated Mortgage Survey
Notes:
- Affordability ratio is the simple average dwelling price divided by the simple average recorded income of borrowers.
- Simple averages are more volatile to changes in the structure of the underlying data than mix-adjusted averages.
- The simple average dwelling prices and simple average recorded incomes were rounded to the nearest £1,000.
- Data up to and including 2002 are from 5% sample. Data from 2003 are based on a significantly enhanced sample size. Data from September 2005 are collected via the Regulated Mortgage Survey. 2005 data are based on combined data from the Survey of Mortgage Lenders and the Regulated Mortgage Survey.
Download this chart Figure 8: Housing affordability has been decreasing since the late 1990s for both first-time buyers and former owner occupiers
Image .csv .xlsThe affordability ratio has been higher for former owner occupiers than for first-time buyers from the start of the series in Quarter 2 (Apr to June) 1992 to Quarter 2 2019. The average dwelling price has been consistently higher for previous owner occupiers and the average recorded income of the borrowers has been consistently lower for first-time buyers over the period. This suggests that the housing that previous owner occupiers purchased is less affordable than the housing purchased by first-time buyers. This is likely explained by previous owner occupiers having more capital, likely through reinvesting the capital gains made on their previous property, than first-time buyers. This helps previous owner occupiers to purchase dwellings of higher prices relative to their incomes and “move up the property ladder”.
Some people look at the affordability ratio to examine whether the housing market is overpriced. If the ratio deviates above the long-term trend and prices increase too much, demand for housing and prices would be corrected down. This seems to have happened in late 2005, when the ratio fell back sharply to its linear trend of the entire series, after having increased dramatically above it in mid-2003, for both owner occupiers and first-time buyers. However, as Figure 8 shows, there is no fixed trend for the ratio and using it to determine pricing of the housing market may not be very accurate.
The affordability ratio has been on a general upward trend for both the first-time buyers and former owner occupiers since the late 1990s. This means that housing in the UK has been getting less affordable according to the price to income ratio. However, in recent months slowing house price growth has seen the ratio fall, improving housing affordability.
Changes in the ratio over time should be interpreted with caution. The Bank of England’s base rate has been reduced from 9.9% in May 1992 to 0.75% in May 2019, allowing borrowers to purchase higher priced dwellings. When interest rates are not considered, the affordability ratio can overstate the affordability issues. However, base rate changes are not always passed through to mortgage rates, especially if the lenders decide to ration.
An increase in house prices relative to incomes also has different effects on different individuals. A house owner that has already paid off a mortgage or bought a property outright will make capital gains and benefit when the affordability ratio increases, while low income or first-time buyers would struggle. More detailed analysis of affordability using the affordability ratio by region and property type can be found in Housing affordability in England and Wales: 2018.
Another aspect of affordability is the deposit rate. Figure 9 shows the effective deposit rate, calculated as the percentage of the average house price not made up by the average recorded advance, for first-time buyers.
Figure 9: Housing deposit rates are much higher for first-time buyers in 2019 compared with 1992
Deposit rate for first-time buyers, UK, Quarter 2 (April to June) 1992 to Quarter 2 2019
Source: Office for National Statistics - House price data: quarterly tables data based on a sub-sample of the Regulated Mortgage Survey
Notes:
- Deposit rate is the simple average advance minus the simple average dwelling price divided by the simple average dwelling price, shown as a percentage.
- Simple averages are more volatile to changes in the structure of the underlying data than mix-adjusted averages.
- The simple average dwelling prices and simple average recorded incomes were rounded to the nearest £1,000.
- Data up to and including 2002 are from 5% sample. Data from 2003 are based on a significantly enhanced sample size. Data from September 2005 are collected via the Regulated Mortgage Survey. 2005 data are based on combined data from the Survey of Mortgage Lenders and the Regulated Mortgage Survey.
Download this chart Figure 9: Housing deposit rates are much higher for first-time buyers in 2019 compared with 1992
Image .csv .xlsThe deposit rate for first-time buyers has generally increased from the mid-1990s to 2010, from around 17% in Quarter 2 1992 to 33% in Quarter 1 2010. With the affordability ratio on an upward trend, this shows how much harder it has been for first-time buyers to get onto the property ladder.
Since early 2010, the deposit rate for first-time buyers has been on a downward trend, with the ratio being 23% in Quarter 2 2019. This coupled with a low Bank of England base rate shows that, since the economic downturn, conditions have started to improve for first-time buyers. However, first-time buyers are also using a longer mortgage duration to keep house purchases affordable.
Figure 10 shows the distribution of mortgage periods and the average mortgage period for the UK from 1990 to 2018. The distribution is measured by the percentage a certain mortgage period makes up of all mortgage periods on the left-hand side vertical axis. The average mortgage period is measured in years on the right-hand side vertical axis. Data for 2003, 2004 and 2005 are missing, so there is a continuity break in the figure.
Figure 10: The average (mean) mortgage period, and the 30 years and over mortgage share of all mortgages have been increasing since 2006
Distribution of mortgage periods and average mortgage period, UK, 1990 to 2018 (2003, 2004 and 2005 missing)

Source: Office for National Statistics - House Price Index: annual tables 20 to 39 based on a sub-sample of the Regulated Mortgage Survey
Notes:
- Data up to and including 1992 were based on returns from Building Societies only. Data from 1993 onwards are based on returns from all mortgage lenders.
- The period of the loan is no longer collected by the Survey of Mortgage Lenders form for the years 2003, 2004 and 2005.
- From October 2005, the Regulated Mortgage Survey (RMS) replaced the Survey of Mortgage Lenders. The RMS is an enlarged sample of mortgage completions data. Data on the period of the loan were available from 2006 onwards.
- The data published in these tables are based on a sub-sample of RMS data. These results will therefore differ from results produced using full sample data.
Download this image Figure 10: The average (mean) mortgage period, and the 30 years and over mortgage share of all mortgages have been increasing since 2006
.png (28.5 kB) .xlsx (19.6 kB)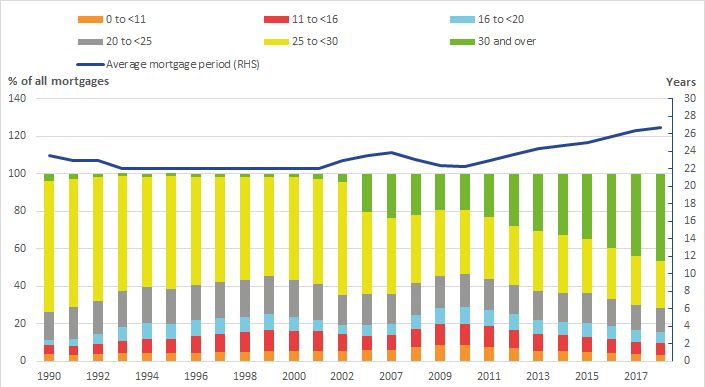
From 1990 to 2002, by far the most popular mortgage period for borrowers was 25 to 29 years, making up on average a 59.8% share of all mortgage periods. The 25-year period accounted for 59.3% within the (59.8%) share. In the same period, the second-largest share belonged to the 20 to 24-year period, making up on average 18.4%.
In 2006, there was a sharp increase in the share of the 30 years and over mortgage period. The share increased from 4.3% in 2002 to 20.3% in 2006. Its share has also been steadily rising since 2010 and was 46.1% in 2018. The rise in share of the 30 years and over mortgage period has been reflected mostly in the fall of the 25 to 29-year period’s share.
The structural change in mortgage periods chosen by borrowers is reflected in the increasing average mortgage period, as shown in Figure 10. The average mortgage period has been increasing steadily since 2010 and was 26.7 years in 2018. Increasing the mortgage period decreases the monthly mortgage payments, keeping everything else constant. However, the total outlay at the end of the mortgage is greater than if a shorter period was chosen, as more is paid out in interest. Therefore, the decision on the period of a mortgage is a trade-off between the speed, total cost and monthly affordability of repayment. In recent periods, borrowers could be making the choice to take out mortgages for longer periods to lower their monthly payments and to increase affordability. Changes in the mortgage age limit could also have influenced their decisions.
Back to table of contents