Table of contents
- Main points
- Things you need to know about this release
- Total trade deficit widened £2.3 billion in the three months to October 2019
- The trade in goods deficit widened with EU and non-EU countries in the three months to October 2019
- Removing the effect of inflation, the total trade deficit widened in the three months to October 2019
- Explore UK trade in goods country-by-commodity data for 2018 with our interactive tools
- The total trade deficit widened in the 12 months to October 2019
- The trade in goods deficit widened more with non-EU countries than EU countries in the 12 months to October 2019
- Revisions
- Data
- Links to related statistics
- Quality and methodology
1. Main points
The total UK trade deficit (goods and services) widened £2.3 billion to £7.2 billion in the three months to October 2019, as imports grew faster than exports.
Excluding unspecified goods (which includes non-monetary gold), the total trade deficit narrowed £4.3 billion to £2.9 billion in the three months to October 2019.
Removing the effect of inflation, the total trade deficit in volume terms widened £1.1 billion to £4.4 billion in the three months to October 2019.
In current prices, the trade in goods deficit widened £6.8 billion to £35.6 billion, largely driven by rising imports; the trade in services surplus widened £4.4 billion to £28.4 billion, largely driven by rising exports.
The trade in goods deficit with EU countries widened £3.5 billion to £25.0 billion in the three months to October 2019, while with non-EU countries it widened by £3.3 billion to £10.6 billion.
The total trade deficit widened £23.2 billion to £48.7 billion in the 12 months to October 2019, mainly because of the trade in goods deficit, which widened £19.3 billion to £154.9 billion.
2. Things you need to know about this release
Data revision policy
In accordance with National Accounts Revisions Policy, data in this release have been revised back to January 2018 when compared with our previous trade bulletin from 11 November 2019. Revisions were mainly as a result of the inclusion of the 2018 Annual Survey of International Trade in Services (ITIS), which incorporates a larger sample size than the quarterly ITIS survey that is typically used. Further details are provided in the Revisions section of this release.
National Statistics designation status
The UK Statistics Authority suspended the National Statistics designation of UK trade (PDF 72.8KB) on 14 November 2014. We have now responded to all of the specific requirements of the reassessment of UK trade and, as part of our engagement with the Office for Statistics Regulation team we are sharing our continuous improvement and development plans to support UK trade statistics regain National Statistics status. We welcome feedback on our new trade statistics, developments and future plans. If you have any comments, please send them by email to trade@ons.gov.uk.
We are undertaking a programme of improvements to UK trade statistics in line with the UK trade development plan, including more detail and improvements now published to address anticipated future demands. On 24 October 2018, we published an article outlining our achievements so far and forward look with regards to the transformation of our trade statistics.
UK trade data
Unless otherwise specified, data within this bulletin are in current prices, in other words, they have not been adjusted to remove the effects of inflation.
UK trade data within our monthly trade bulletin are published at around a six-week lag because of the timeliness of source data. For example, the January 2020 publication will include data up to the end of November 2019.
Erratic commodities
Trade statistics for any one month can be erratic. For that reason, we recommend comparing the latest three months against the preceding three months, and the same three months of the previous year.
Oil and other “erratic” commodities can make a large contribution to trade in goods, but often mask the underlying trend in the export or import values because of their volatility. The “erratics” series includes ships, aircraft, precious stones, silver and non-monetary gold. Non-monetary gold can have a particularly large impact because of the large volumes of gold traded on the London markets. Therefore, we also publish data exclusive of these commodities, which may provide a better guide to the emerging trade picture.
Non-monetary gold
In line with international standards, the Office for National Statistics’ (ONS’s) headline trade statistics contain the UK’s exports and imports of non-monetary gold. Non-monetary gold is the technical term for gold bullion not owned by central banks.
Because a significant amount of the world’s trade in non-monetary gold takes place on the London markets, this trade can have a large impact on the size of and change in the UK’s headline trade figures.
Non-monetary gold is one subcomponent of the commodity group “unspecified goods”.
More information about the ONS’s recording of non-monetary gold is available.
Trade asymmetries
These data are our best estimates of bilateral UK trade flows, compiled following internationally agreed standards and using a wide range of robust data sources. However, in some cases alternative estimates of bilateral trade flows are available from the statistical agencies for those countries or through central databases such as UN Comtrade. Differences between estimates are known as trade asymmetries and are a known aspect of international trade statistics, affecting bilateral estimates across the globe, not just the UK.
We are heavily engaged in analysis of these asymmetries, developing strong bilateral relationships with other countries to understand, explain and potentially reduce them. We have published a series of analyses showing comparisons and the relative strengths of different estimates, which users may wish to reference to help them better understand the quality of our bilateral trade estimates.
The base year
This year, because of the very demanding set of changes in the annual update, we have not fully reconciled 2017 annual data, instead producing an indicative balance to allow further time for final quality assurance of the data. Consequently, the reference year and last base year for all chained volume measure (CVM) series remains as 2016.
Back to table of contents3. Total trade deficit widened £2.3 billion in the three months to October 2019
The total trade deficit (goods and services) widened £2.3 billion to £7.2 billion in the three months to October 2019. This was because of imports increasing £9.7 billion to £182.7 billion, while exports increased by a lesser £7.4 billion to £175.5 billion.
The widening of the total trade deficit in the three months to October 2019 was because of a widening of the trade in goods deficit by £6.8 billion to £35.6 billion. Goods imports increased £10.0 billion to £129.2 billion, while goods exports increased £3.2 billion to £93.6 billion.
The trade in services surplus widened £4.4 billion to £28.4 billion, this was largely driven by a £4.2 billion increase in services exports to £81.9 billion. Services imports decreased by £0.3 billion to £53.5 billion.
Figure 1 and Table 1 show the changes to goods, services and total trade balances, along with exports and imports in the three months to October 2019 compared with the three months to July 2019.
Figure 1: Rising goods imports drove the widening of the trade deficit in the three months to October 2019
Changes in the UK trade balances, exports and imports, three months to October 2019 compared with three months to July 2019

Source: Office for National Statistics
Notes:
- The arrow direction indicates whether a component has increased or decreased, while the colour denotes the impact the direction of a movement has on the trade balance.
- For example, an increase in imports is denoted by an upward red arrow, as a rise in imports has a negative impact on the trade balance. An increase in the trade in goods deficit will be indicated by an upwards red arrow as this would have a negative impact on the balance.
Download this image Figure 1: Rising goods imports drove the widening of the trade deficit in the three months to October 2019
.PNG (51.3 kB) .pptx (57.6 kB)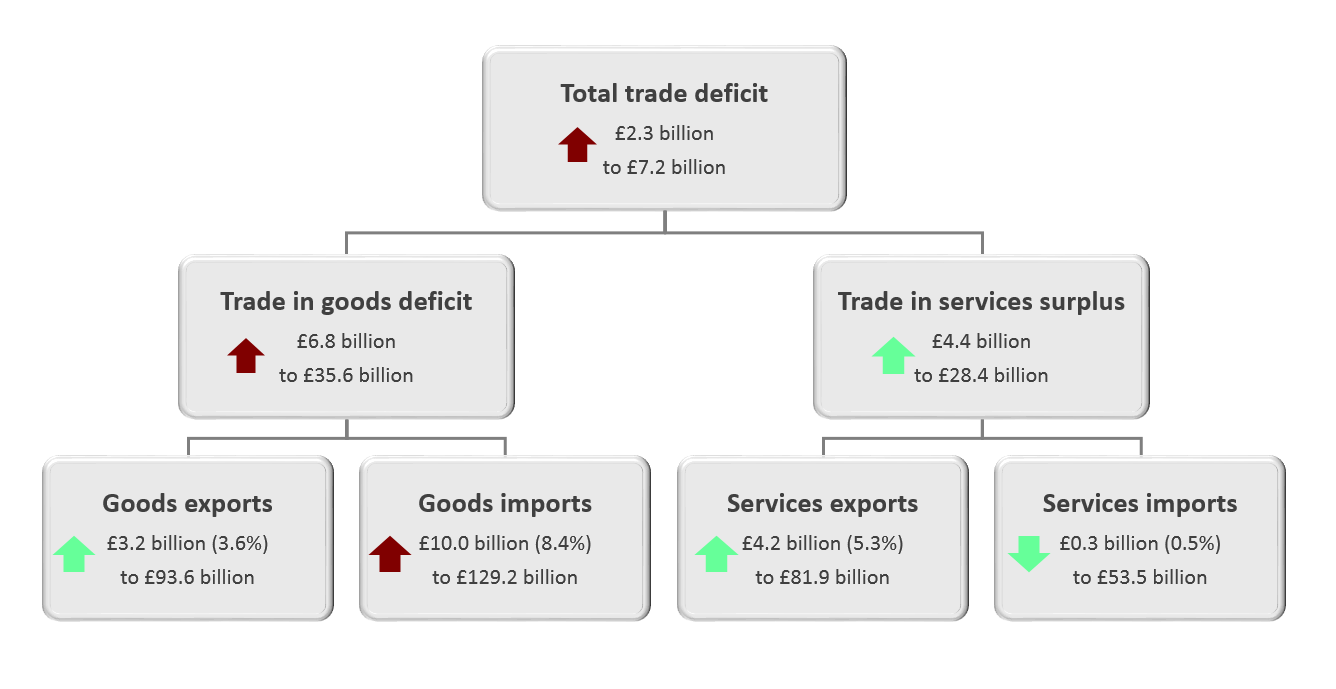
| Three months to October 2019 compared with three months to July 2019 | |||
|---|---|---|---|
| Exports | Imports | Balance | |
| Total trade | Increased £7.4 billion (4.4%) to £175.5 billion | Increased £9.7 billion (5.6%) to £182.7 billion | Widened £2.3 billion to £7.2 billion (deficit) |
| Trade in goods | Increased £3.2 billion (3.6%) to £93.6 billion | Increased £10.0 billion (8.4%) to £129.2 billion | Widened £6.8 billion to £35.6 billion (deficit) |
| Trade in services | Increased £4.2 billion (5.3%) to £81.9 billion | Decreased £0.3 billion (0.5%) to £53.5 billion | Widened £4.4 billion to £28.4 billion (surplus) |
Download this table Table 1: The trade deficit widened in the three months to October 2019, largely because of rising imports
.xls .csvThe widening of the trade in goods deficit in the three months to October 2019 was largely because of a £10.0 billion rise in goods imports to £129.2 billion, driven by unspecified goods (which includes non-monetary gold), machinery and transport equipment, and chemicals, which rose by £4.1 billion, £3.2 billion and £1.5 billion respectively.
Goods exports increased by a lesser £3.2 billion to £93.6 billion, largely driven by machinery and transport equipment, chemicals and miscellaneous manufactures, which increased by £3.1 billion, £1.4 billion and £1.4 billion respectively. These increases were partially offset by decreases in exports of unspecified goods and fuels, which fell by £2.5 billion and £1.3 billion respectively.
Excluding unspecified goods, the total trade deficit narrowed £4.3 billion to £2.9 billion in the three months to October 2019. Exports increased £9.9 billion to £175.1 billion, while imports rose £5.6 billion to £177.9 billion. The trade in goods deficit, excluding unspecified goods, widened £0.1 billion to £31.2 billion.
In July, excluding unspecified goods, the total trade balance remained in deficit at £0.7 billion in July 2019; however, including unspecified goods (which includes non-monetary gold), total trade returned a surplus of £0.6 billion in July 2019.
Figure 2 shows the UK trade balances on a three-month on three-month basis between October 2017 and October 2019.
Figure 2: The trade deficit widened in the three months to October 2019
UK trade balances, three-month on three-month, October 2017 to October 2019
Source: Office for National Statistics
Notes:
- Excluding unspecified goods, the total trade deficit narrowed £4.3 billion to £2.9 billion in the three months to October 2019.
Download this chart Figure 2: The trade deficit widened in the three months to October 2019
Image .csv .xls4. The trade in goods deficit widened with EU and non-EU countries in the three months to October 2019
The trade in goods deficit with EU countries widened £3.5 billion to £25.0 billion, while with non-EU countries it widened £3.3 billion to £10.6 billion, in the three months to October 2019. The widening of the deficit with both EU and non-EU countries was largely because of rising goods imports, and in both cases was only partially offset by a lesser increase in goods exports (Figure 3).
Imports from non-EU countries rose by £5.3 billion to £61.0 billion in the three months to October 2019. This was largely driven by a £3.9 billion increase in unspecified goods (which includes non-monetary gold), and a £1.1 billion increase in machinery and transport equipment.
Imports from EU countries rose by £4.7 billion to £68.2 billion in the three months to October 2019. This was largely driven by machinery and transport equipment, and chemicals, which increased by £2.2 billion and £1.3 billion respectively. Exports to non-EU countries rose by £2.0 billion to £50.5 billion in the three months to October 2019. This was largely driven by machinery and transport equipment, and miscellaneous manufactures, which increased by £2.6 billion and £1.2 billion respectively, and was partially offset by a £2.3 billion fall in unspecified goods.
Exports to EU countries rose by £1.2 billion to £43.2 billion in the three months to October 2019. This was largely driven by chemicals, and machinery and transport equipment, which increased by £0.6 billion and £0.5 billion respectively, and was partially offset by a £0.8 billion fall in fuels.
Figure 3: The widening of the trade in goods deficit was largely because of increased imports from both EU and non-EU countries
Changes in UK goods exports, imports and trade balance with EU and non-EU countries, three months to October 2019 compared with the three months to July 2019
Source: Office for National Statistics
Download this chart Figure 3: The widening of the trade in goods deficit was largely because of increased imports from both EU and non-EU countries
Image .csv .xls5. Removing the effect of inflation, the total trade deficit widened in the three months to October 2019
This section presents volume and price estimates of UK trade exports, imports and balances, using chained volume measures (CVMs) and implied deflators (IDEFs). A CVM is a “real” measure in that it has had the effect of inflation removed. An IDEF shows the implied change in average prices for the respective components of the trade balance, for example, the IDEF for imports will show the average price movement for imports.
In volume terms, the total trade deficit (goods and services) widened £1.1 billion to £4.4 billion in the three months to October 2019. The trade in goods deficit widened £5.2 billion to £31.8 billion and the trade in services surplus widened £4.2 billion to £27.4 billion (Figure 4).
Goods imports increased £8.7 billion to £115.0 billion in the three months to October 2019, goods exports increased by a lesser £3.4 billion to £83.3 billion. The rise in goods imports was largely because of increases in unspecified goods (which includes non-monetary gold), and machinery and transport equipment of £4.0 billion and £2.8 billion respectively. The rise in goods exports was mainly because of increases in machinery and transport equipment, and chemicals of £2.6 billion and £1.6 billion respectively, partially offset by a £2.4 billion decrease in unspecified goods.
Services exports increased £3.8 billion to £76.7 billion, while services imports fell £0.4 billion to £49.3 billion.
Figure 4: The trade deficit in volume terms widened in the three months to October 2019
Total trade balances, chained volume measures, three-month on three-month, October 2017 to October 2019
Source: Office for National Statistics
Download this chart Figure 4: The trade deficit in volume terms widened in the three months to October 2019
Image .csv .xlsIn volume terms, July and August 2019 saw a trade surplus of £1.3 billion and £1.2 billion respectively. As a result, Quarter 3 (July to Sept) 2019 had a trade surplus of £1.5 billion.
Back to table of contents6. Explore UK trade in goods country-by-commodity data for 2018 with our interactive tools
Explore the 2018 trade in goods data using our interactive tools. Our data breaks down UK trade in goods with 234 countries by 125 commodities.
Use our map to get a better understanding of what goods the UK traded with a particular country. Select a country by hovering over it or using the drop-down menu.
Embed code
Notes:
For more information about our methods and how we compile these statistics, please see Trade in goods, country-by-commodity experimental data: 2011 to 2016. Users should note that the data published alongside this release are official statistics and no longer experimental.
These data are our best estimate of these bilateral UK trade flows. Users should note that alternative estimates are available, in some cases, through the statistical agencies for bilateral countries or through central databases such as UN Comtrade.
Interactive maps denote country boundaries in accordance with statistical classifications set out within Appendix 4 of the Balance of Payments (BoP) Vademecum (PDF, 1.1MB).
What about trade in a particular commodity in 2018? What percentage of UK car exports went to the EU? Where did UK imports of tea and coffee come from last year?
Use our interactive tools to understand UK trade of a particular commodity in 2018.
Select a commodity from the drop-down menu or click through the levels to explore the data.
Embed code
Embed code
Notes:
For more information about our methods and how we compile these statistics, please see Trade in goods, country-by-commodity experimental data: 2011 to 2016. Users should note that the data published alongside this release are no longer experimental.
These data are our best estimate of these bilateral UK trade flows. Users should note that alternative estimates are available, in some cases, via the statistical agencies for bilateral countries or through central databases such as UN Comtrade.
Interactive maps denote country boundaries in accordance with statistical classifications set out within Appendix 4 of the Balance of Payments (BoP) Vademecum (PDF, 1.1MB).
Back to table of contents7. The total trade deficit widened in the 12 months to October 2019
The total trade deficit (goods and services) widened £23.2 billion to £48.7 billion in the 12 months to October 2019, mainly because of a widening of the trade in goods deficit of £19.3 billion to £154.9 billion (Figure 5).
Imports of goods increased £28.4 billion to £513.0 billion, while exports increased by a lesser £9.2 billion to £358.1 billion.
Rising imports of goods in the 12 months to October 2019 were largely because of unspecified goods (which includes non-monetary gold), machinery and transport equipment, and miscellaneous manufactures, which increased by £14.0 billion, £8.1 billion and £4.5 billion respectively. This was partially offset by a fall of £3.9 billion in fuel imports.
The £9.2 billion increase of goods exports to £358.1 billion was driven mainly by an increase in miscellaneous manufactures, which increased by £6.8 billion. Other drivers were machinery and transport equipment, and unspecified goods, which increased by £2.5 billion and £1.7 billion respectively. These increases were partially offset by falling exports of fuels and chemicals, by £2.1 billion and £1.7 billion respectively.
The trade in services surplus narrowed £3.9 billion to £106.2 billion in the 12 months to October 2019, as imports increased by £19.1 billion to £211.2 billion and exports increased by a lesser £15.1 billion to £317.4 billion.
Figure 5: The trade deficit widened in the 12 months to October 2019, largely because of a widening of the trade in goods deficit
Changes to UK trade balances, exports and imports, 12 months to October 2019 compared with 12 months to October 2018

Source: Office for National Statistics
Notes:
- The arrow direction indicates whether a component has increased or decreased, while the colour denotes the impact the direction of a movement has on the trade balance.
- For example, an increase in imports is denoted by an upward red arrow, as a rise in imports has a negative impact on the trade balance. An increase in the trade in goods deficit will be indicated by an upwards red arrow as this would have a negative impact on the balance.
Download this image Figure 5: The trade deficit widened in the 12 months to October 2019, largely because of a widening of the trade in goods deficit
.png (45.4 kB) .pptx (57.7 kB)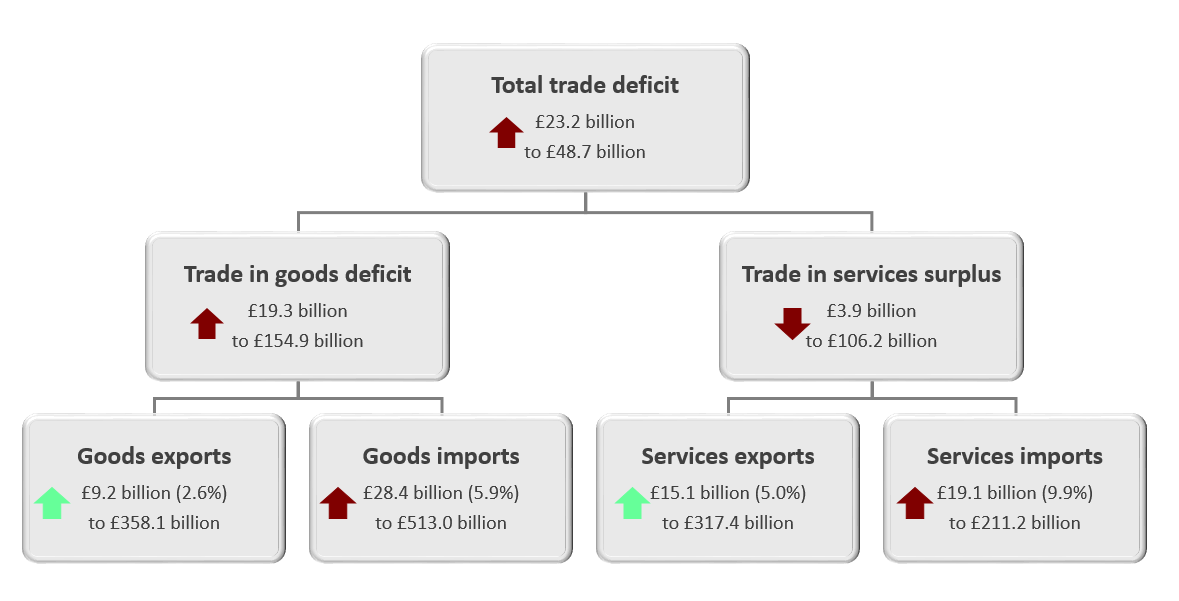
| 12 months to October 2019 compared with 12 months to October 2018 | |||
|---|---|---|---|
| Exports | Imports | Balance | |
| Total trade | Increased £24.3 billion (3.7%) to £675.5 billion | Increased £47.5 billion (7.0%) to £724.2 billion | Widened £23.2 billion to £48.7 billion (deficit) |
| Trade in goods | Increased £9.2 billion (2.6%) to £358.1 billion | Increased £28.4 billion (5.9%) to £513.0 billion | Widened £19.3 billion to £154.9 billion (deficit) |
| Trade in services | Increased £15.1 billion (5.0%) to £317.4 billion | Increased £19.1 billion (9.9%) to £211.2 billion | Narrowed £3.9 billion to £106.2 billion (surplus) |
Download this table Table 2: The trade deficit widened in the 12 months to October 2019, largely because of a widening of the trade in goods deficit
.xls .csv8. The trade in goods deficit widened more with non-EU countries than EU countries in the 12 months to October 2019
The £19.3 billion widening of the trade in goods deficit to £154.9 billion in the 12 months to October 2019 was mainly because of trade with non-EU countries (Figure 6). The trade in goods deficit with non-EU countries widened £13.5 billion to £56.9 billion, while the trade in goods deficit with EU countries widened by a lesser £5.8 billion to £98.0 billion, in the 12 months to October 2019.
The widening of the trade in goods deficit with non-EU countries in the 12 months to October 2019 was mainly because of imports, which increased £23.2 billion to £243.7 billion, while exports increased by a lesser £9.7 billion to £186.8 billion.
The largest contributors to the increase in imports from non-EU countries were unspecified goods (which includes non-monetary gold), machinery and transport equipment, and miscellaneous manufactures, which increased by £14.2 billion, £4.5 billion and £2.5 billion respectively.
The increase in non-EU exports was driven largely by a £5.4 billion increase in miscellaneous manufactures, as well as unspecified goods and chemicals, which both increased by £1.4 billion.
The £5.8 billion widening of the trade in goods deficit with EU countries in the 12 months to October 2019 was because of a £5.2 billion increase in imports to £269.3 billion. Exports decreased by £0.6 billion to £171.3 billion.
The increase in imports from EU countries were largely because of machinery and transport equipment, and miscellaneous manufactures, which increased £3.6 billion and £2.0 billion respectively, partially offset by a £2.7 billion fall in imports of fuels.
Figure 6: The widening in the trade in goods deficit in the 12 months to October 2019 was mainly because of a widening in the deficit with non-EU countries
Changes in UK goods exports, imports and trade balance with EU and non-EU countries, 12 months to October 2019 compared with 12 months to October 2018
Source: Office for National Statistics
Download this chart Figure 6: The widening in the trade in goods deficit in the 12 months to October 2019 was mainly because of a widening in the deficit with non-EU countries
Image .csv .xls9. Revisions
In accordance with the National Accounts Revisions Policy data within this release have been revised when compared with estimates in the release published 11 November 2019. Figure 7 shows the revisions to the goods, services and total trade balances from Quarter 1 (Jan to Mar) 2018 to Quarter 3 (July to Sept) 2019.
Revisions were mainly because of improved data with the inclusion of the 2018 Annual Survey of International Trade in Services (ITIS) for the first time, which incorporates a larger sample size than the quarterly ITIS survey that is typically used. The inclusion of the 2018 annual ITIS survey resulted in revisions to both goods and services for 2018 and 2019, as changes have been made to the 2019 data rebased on 2018 data. The annual ITIS survey has also made methodological improvements that resulted in changes to data. Because of the size of these changes these improvements have not been included in this release. Further information on the methodological improvements as well as the improved data will be published in 2020.
In Quarter 3 2019, the trade in goods deficit was revised upwards by £3.9 billion and exports of goods were revised up by £4.4 billion to £94.1 billion, partially offset by imports, which were revised up by £0.4 billion to £123.3 billion.
The Quarter 3 2019 trade in services surplus was also revised upwards by £1.1 billion, exports were revised up by £5.1 billion to £81.1 billion while imports were revised up by £4.1 billion to £53.3 billion. As a result, the total trade deficit in Quarter 3 2019 was revised upwards by £5.0 billion to £1.4 billion.
Figure 7: The total trade balance was revised upwards in most quarters of 2018 and 2019 largely because of to revised estimates in the trade in services surplus
Quarterly revisions to the goods, services and total trade balance, UK Quarter 1 (Jan to Mar) 2018 to Quarter 3 (July to Sept) 2019
Source: Office for National Statistics
Download this chart Figure 7: The total trade balance was revised upwards in most quarters of 2018 and 2019 largely because of to revised estimates in the trade in services surplus
Image .csv .xls10. Data
UK trade: goods and services publication tables
Released 10 December 2019
Monthly data on the UK's trade in goods and services, including trade inside and outside the EU.
Dataset MRET | Released 10 December 2019
Monthly value of UK exports and imports of goods and services by current price, chained volume measures and implied deflators.
Released 10 December 2019
Other UK trade data related to this publication. This includes trade in goods for all countries with the UK, monthly export and import country-by-commodity trade in goods data, and revisions triangles for monthly trade data.
12. Quality and methodology
Trade is measured through both exports and imports of goods and services. Data are supplied by over 30 sources including several administrative sources, HM Revenue and Customs (HMRC) being the largest for trade in goods.
This monthly release contains tables showing the total value of trade in goods together with chained volume measures (CVMs) and implied deflators (IDEFs). Figures are analysed by broad commodity group (CP, CVMs and IDEFs) and according to geographical area (CP only). In addition, the UK trade statistical bulletin also includes early monthly estimates of the value of trade in services.
Further qualitative data and information can be found in the attached datasets. This includes data on:
Detailed methodological notes are published in the UK Balance of Payments, The Pink Book 2019.
The UK trade methodology web pages have been developed to provide detailed information about the methods used to produce UK trade statistics.
The UK trade Quality and Methodology Information report contains important information on:
the strengths and limitations of the data and how it compares with related data
uses and users of the data
how the output was created
the quality of the output non-monetary the accuracy of the data