1. Abstract
The Uncertainty Project was established as part of the Migration Statistics Improvement Programme (MSIP 2008 to 2012). Working in collaboration with Southampton Statistical Sciences Research Institute (S3RI), this project aimed to provide users of Office for National Statistics (ONS) local authority mid-year population estimates with more information regarding their quality. This report summarises the methodology for deriving the statistical measure of uncertainty associated with the local authority mid-year population estimates.
We use the cohort component approach to create the local authority mid-year population estimates. The cohort component method uses the 2011 Census for the population base and then incorporates natural change (births and deaths), net international migration and net internal migration, and other adjustments (for example, asylum seekers). The methodology for deriving the statistical measure of uncertainty applies the same processes to derive simulated distributions for each component. These are then combined using the cohort component formula to derive the uncertainty associated with the local authority mid-year estimates.
Early research identified the census, international migration and internal migration as the 3 components with the greatest impact on uncertainty. The methodology to quantify uncertainty is therefore based on these 3 components. Because the mid-year estimates combine various data sources and processes to derive each component, we have used different methods to produce the simulated distributions for each component. This working paper describes these methods and the subsequent measures of uncertainty for each local authority for the years 2012 to 2016. Summary statistics of the final output are also included.
Back to table of contents2. Acknowledgements
This project reflects the combined efforts of the Demographic Methods Centre within ONS Methodology and the Southampton Statistical Sciences Research Institute (S3RI). ONS would particularly like to acknowledge the contribution of Professor Peter W.F. Smith from the University of Southampton.
Back to table of contents3. Introduction
The local authority mid-year estimates refer to the usually resident population on 30 June of the reference year1. Published annually, the estimates are based on the previous census and are updated each year using the cohort component method. Currently, users have to wait 10 years until the next census before they have an indication of the uncertainty associated with the mid-year estimates.
The Uncertainty Project aims to provide more timely quality information for the mid-year estimates. This follows original recommendations from the Migration Task Force (2006), the UK Statistics Authority report (Migration Statistics: The Way Ahead (UK Statistics Authority 2009a) and Principle 4 of the Code of Practice for Official Statistics (UK Statistics Authority 2009b).
The Uncertainty Project originally included 2 streams of work. The first involved the development of Quality Indicators, which was completed in 2012 (ONS 2012a). These report the percentage of local authority population or households with characteristics associated with uncertainty in the mid-year estimates and are published annually with the mid-year estimates.
The second stream, which is the focus of this report, was the development of measures of statistical uncertainty. Measures for 2002 to 2010 were published by the Office for National Statistics (ONS) as research outputs in 2012 (ONS 2012b). The methods have been adapted following the 2011 Census to reflect changes in the methodology to produce the mid-year estimates. Development of the methodology for the uncertainty measures has been a collaborative project between the Southampton Statistical Sciences Research Institute (S3RI) and the Demographic Methods Centre, within Population Methodology and Statistical Infrastructure, in ONS Methodology. This working paper updates the 2012 report that was published with the 2002 to 2010 series. We welcome your feedback, both on the methods used and the results of this research.
Notes for: Introduction
- For the mid-year estimates, ONS uses rules to assign usual residence where this could be ambiguous: students are considered to be usually resident at their term-time address; armed forces personnel are usually resident at the place where they spend most of their time; prisoners are usually resident at the prison estate if they have a conviction of 6 months or more and international migrants are usually resident if they intend to stay in the UK for 12 months or more.
5. Developing a statistical measure of uncertainty
“Uncertainty” is defined here as the quantification of doubt about a measurement. The 3 main sources of uncertainty associated with the mid-year population estimates are: the census base; international migration; and internal migration (moves between local authorities). For more detail on the early feasibility work for the uncertainty measures, see ONS (2010). Uncertainty in the other components of change (births, deaths, asylum seekers, armed forces, prisoners) is not reflected in the methodology and is assumed for now to be zero. This assumption will be reviewed as part of future methodological development.
For each of the 3 components associated with uncertainty, the estimation process that is used to produce the mid-year population estimates is replicated and the replicates are used to simulate a range of possible values that might occur. The simulated distributions for each component are combined, iteration by iteration, mirroring the standard cohort components approach that is used for the published mid-year estimates. Thus, in year t:
(5.1)
From the resulting distribution of plausible estimates for each local authority, the principal measure of uncertainty is calculated as the relative root mean squared error1 (see Equation 5.12). This takes into account bias in the estimated values and allows uncertainty to be compared between local authorities.
Bootstrapping
This methodology uses statistical bootstrapping to create simulated distributions for each of the 3 components of the mid-year estimate that contribute the most to statistical uncertainty: the census, internal migration and international migration.
Statistical bootstrapping is a method for assigning measures of accuracy to sample estimates (Efron and Tibshirani 1993). It falls under the broader class of re-sampling methods. Bootstrap techniques allow estimation of the sampling distribution of almost any statistics, from which uncertainty measures such as variance, standard deviation and bias can be derived. Bootstrap techniques can be either parametric or non-parametric. Parametric bootstrapping assumes an underlying distribution and simulates from this distribution. Non-parametric bootstrapping makes no distributional assumptions and re-samples (with replacement) directly from the observed data. Bootstrapping from the observed data, for example, from the International Passenger Survey, creates simulated datasets, which theoretically reflect the sampling error in the original samples. The bootstrapping techniques used in the estimation of uncertainty for the mid-year estimates are summarised in Table 1. Further details on bootstrapping techniques are detailed in the subsequent sections of this report.
Table 1: Re-sampling methods used in the construction of uncertainty for ONS mid-year estimates
| Component | Re-sampling method | Type of bootstrap |
| Census base | Uses published variances and assumes that errors are normally distributed. | Parametric |
| Correction of census base estimates to mid-year population | Assumes that the coefficient of variation for this 3-month component is the same as the coefficient of variation around the 2012 mid-year estimate and that errors are normally distributed. | Parametric |
| International in-migration | Uncertainty from International Passenger Survey (IPS) sampling and imputation: Re-sampling with replacement from the IPS, with 1,000 new samples then re-run through IPS imputation. | Non-Parametric |
| Uncertainty from the use of administrative data to allocate in-migrants to local authorities: Uses a benchmark approach, comparing administrative distributions to 2011 census-based ones, to derive variances for each administrative data source used. Errors are assumed to be log-normally distributed. | Parametric using a benchmark | |
| International out-migration | Re-sampling with replacement from the IPS, then repeating Poisson regression modelling on 1,000 simulated datasets. | Non-parametric |
| Internal migration | Adopts a benchmark approach. Re-samples residuals from the non-linear regression model of the log of the ratio of 2011 Census to Patient Register internal local authority transitions. Sampled residuals are then added to predicted values from the model, which is updated with contemporaneous covariates for the inter-censal period. | Re-sampling residuals using a benchmark |
| Source: Office for National Statistics | ||
Download this table Table 1: Re-sampling methods used in the construction of uncertainty for ONS mid-year estimates
.xls (28.2 kB)5.1 The 2011 Census base
Taken once every 10 years, the census is the “gold standard” for estimating the population. The mid-year estimate in the year of the census is based on the census estimate of the usually resident population. The mid-year estimate then allows for population ageing, births, deaths, internal and international migration and minor population changes that take place between census day (27 March) and 30 June.
Measuring uncertainty around the 2011 Census is relatively straightforward, since we publish comprehensive information about the quality of the census estimates. The 2011 Census estimates and the published variances (ONS 2013) for local authorities are used to specify the distribution (assumed to be normal) of uncertainty around the census component. Parametric bootstrapping from this normal distribution was used to create 1,000 simulations for the census component for each local authority.
Correcting for the mid-year reference point
We allow for uncertainty around the correction that we apply to update the census estimates to the mid-year population. One option would be to measure uncertainty around the international and internal migration components within this adjustment. However, for the purpose of these research statistics, we take a simpler approach.
We create 1,000 plausible values for the correction through bootstrapping:
This involves first calculating the 2012 uncertainty, including all 3 components and the composite calculations described in this section, without making any allowance for the 3-month March to June 2011 adjustment. This provides a coefficient of variation (CV) around the 2012 local authority-level estimates.
Simulated values for the 3 month census to mid-year period are created using parametric bootstrapping. The coefficient of variation is assumed to be the same as for the 2012 mid-year estimate (calculated without the additional census day to mid-year uncertainty), distributed normally, and the mean is taken as the difference between the published 2011 mid-year estimate and the 2011 Census estimate.
These values are then added to the census simulations, to then feed into the composite process.
Note that the base year component cannot be finalised until all other components, and the (initial) composite, have been completed. The 2012 composite is run a second time to include the uncertainty around the 3-month adjustment.
5.2 International migration
Methods for producing local authority estimates of international migration for the mid-year estimates
Our local authority mid-year estimates include an estimate of the people going to or coming from a local authority who intend to be long-term international migrants. Long-term migrants are defined as those who intend to stay for more than one year (immigrants) or who are departing to take up residence abroad for a minimum of a year, having already lived in the country of departure for more than a year (emigrants).
International migration to and from England and Wales is estimated from the International Passenger Survey (IPS) (see ONS 2015). The IPS operates at UK ports of arrival and departure. It is the only source on UK migration that identifies people who meet the definition of a long-term international migrant, as someone who changes their country of residence for more than 12 months. Migration estimates from the IPS are based on a small sample and cannot reliably be disaggregated down to local authority level.
To achieve migrant estimates at lower geographic levels, we use different methods for immigrants and emigrants.
Immigration
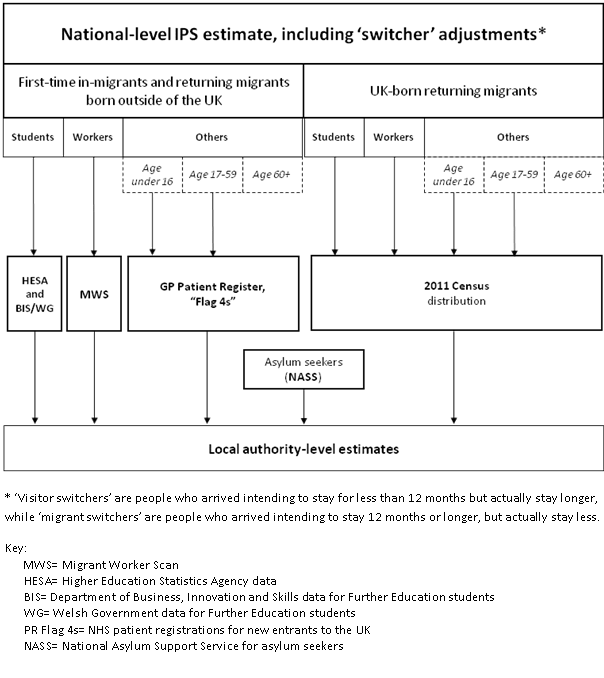
The approach for immigrants identifies migrant “streams” based on responses to the IPS question on the main reason for migrating. This distinguishes between first-time migrants and returning migrants who were born outside of the UK, on the one hand, and UK-born returning migrants on the other. These are differentiated because returning UK-born migrants are believed to have different local authority distributions to foreign-born migrants and interact with the administrative sources differently. Administrative and census data are then used to distribute different types of migrants across local authorities. See Section 5.2.1 for further detail on international immigrants.
Emigration
For emigrants, IPS totals are firstly distributed across New Migration Outflow (NMGo) geographic levels. The IPS-based NMGo totals are then estimated for local authorities using Poisson regression modelling. (Until 2010, this “constrained and then modelled” approach was applied to both the immigrant and the emigrant IPS totals to achieve local authority distributions.)
5.2.1. International in-migration
First-time migrants and returning migrants born outside of the UK are split into streams: students, workers or “other” (see ONS 2011). The “other” category includes children (those aged 15 and under and non-working 16 year-olds), 17 to 59 year-olds who are not migrating to work or study and people aged 60 and over who are not working.
Each stream of immigrants is distributed to local authorities using the distributions observed in administrative data that are relevant to that group. Where census data are used, the 2011 distributions are used for each year following the census but for other administrative sources, the distributions vary annually. For students, the approach uses data from the Higher Education Statistics Agency (HESA) for students in higher education and from the Department for Business, Innovation and Skills (BIS) and Welsh government (WG) for further education students. People immigrating for work are distributed to local authorities using the Department for Work and Pensions’ Migrant Worker Scan (MWS), which provides a count of foreign nationals who applied for a National Insurance number. “Other” migrants are distributed to local authorities using the NHS Patient Register “Flag 4” information. “Flag 4” status is given to people entering the NHS from abroad for the first time.
UK-born returning migrants are also split into migrant streams, as earlier in this section, and then the 2011 Census is used to create their local authority distributions.
Asylum seekers are distributed to local authorities using information from the National Asylum Support Service (NASS). Figure 1 illustrates the streaming and the administrative sources that are used.
Figure 1: International in-migrants in the mid-year estimates
Download this image Figure 1: International in-migrants in the mid-year estimates
.png (56.0 kB)5.2.1.1 Measuring uncertainty in the local authority in-migration estimates
To capture uncertainty in the estimates of international in-migration, 2 potential sources of error are identified:
sampling and imputation error within the International Passenger Survey (IPS)
the distribution of immigrants to local authorities using administrative data could be incorrect
We assume that there is no uncertainty associated with the asylum seeker stream.
5.2.1.2 Bootstrapping to capture sampling and imputation error in the IPS
To capture the error from the IPS, 1,000 simple random samples are re-drawn from the IPS, with replacement after each record is selected. Earlier research investigated how best to take account of the complex sample design and weighting methods used to create national-level migrant estimates from the IPS. The complex sample design of the IPS and non-sampled international travel routes and time periods mean that weights are used to create national estimates of international travellers. Two possible approaches to re-sampling weighted data are to draw a simple random sample, with replacement, or to resample with a probability that is proportional to the inverse of the IPS sample weight. Research concluded that the former, “simple bootstrap” was preferred (Ou and Smith, 2012).
The IPS data imputation process is applied to each of these bootstrapped samples. For more details see ONS (2014).
5.2.1.3 Bootstrapping to capture error from using administrative data to distribute in-migrants to local authorities
Bootstrapping from the IPS generates 1,000 alternative IPS national-level counts of immigrants for each stream. To capture uncertainty from the administrative-based distribution of the IPS total to local authorities, we create 1,000 alternative local authority distributions for each stream. These are applied, iteration by iteration, to the IPS national stream totals to create 1,000 alternative local authority counts for each stream, which are then combined by LA across each stream to give 1,000 alternative immigrant totals for each local authority.
The administrative sources used to derive local authority distributions of immigrant numbers cannot be bootstrapped in the same way as from the IPS. Instead, a parametric bootstrapping approach is adopted where for each stream we simulate the local authority counts from a statistical (parametric) distribution where the mean is given by the observed local authority count, with a variance that reflects the uncertainty associated with the particular administrative data source for that stream.
5.2.1.4 The parametric bootstrap approach for foreign-born and UK-born returning migrants
As described in Section 5.2.1, the national-level estimates of foreign-born immigrants from the IPS are distributed to local authorities using the administrative data source relevant to each stream and the national-level estimates of UK-born returning migrants from the IPS are distributed to local authorities using the 2011 Census data.
Bootstrapping for both types of migrant assumes that the errors in local authority level counts have a log-normal distribution. Using the log-normal distribution avoids producing negative values in the bootstrap samples.
The log normal distribution has the form:
(5.2)
where Z is a random normal covariate with mean 0 and variance 1, and μ and σ are the mean and standard deviation of the logarithm of the log normal distribution respectively.
The administrative and census data counts are simulated from the log-normal as:
(5.3)
The administrative and census data counts used to produce the mid-year estimates are used to calculate the μ for each stream, while the method for estimating the variance σ differs between the foreign-born migrants and UK-born returning migrants.
5.2.1.5 Bootstrap simulations for the UK-born returning migrants
Unlike the census population estimates for local authorities that were used in section 53.1, the variances for the 2011 Census estimates used to distribute the IPS estimates for the streams of UK-born returning migrants were not directly estimated. However, our ONS research into the variability of 2011 Census estimates at sub-local authority level (ONS 2014) was adapted to give local authority level estimates of the variation. The research was based on a small sample of local authorities. These were chosen to be representative of different types of area and areas with low response rates were over-represented. Therefore, checks on the representativeness of variance were made and further examination showed little sensitivity to any over- estimation that might have occurred.
As the variability was determined from a sample of local authorities for the bootstrap sample the coefficient of variation v was taken from the study and the observed Y_i are the Census counts used to produce the mid-year estimates.
So that here:
(5.4)
5.2.1.6 Bootstrap simulations for foreign-born migrants
Variances for the administrative sources that are used to distribute foreign-born migrants to local authorities were estimated using census data as a benchmark. For each stream, the 2011 Census figures for the same or similar subgroup were created for individual local authorities and the 2 sets of estimates were compared.
The bootstrapping assumes that the census estimates Xi in the ith local authority are close to the true value, and that the estimate from the administrative source Yi is related to the census estimate in the following manner:
(5.5)
Here α is a constant factor representing the over- or under-count in the administrative source. As it is assumed to be constant across all local authorities and only proportions are taken from the administrative data, it has no impact on the estimation of immigration and can be ignored.
Then σ2 is the variance of log (Yi / Xi) across local authorities in the UK. A separate value is calculated for each stream.
The administrative data counts are simulated from the log-normal as:
(5.6)
The Yi are the administrative data counts used to produce the mid-year estimates and so here μ = log Yi.
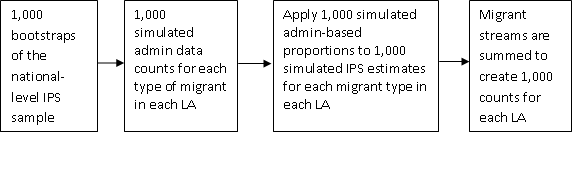
5.2.1.7 Combining the IPS and administrative data simulations to create 1,000 simulated in-migration estimates
The simulated local authority counts for each stream are used to generate 1,000 local authority distributions for each stream. These distributions were then applied, iteration by iteration, to the 1,000 IPS simulations to create 1,000 IPS-based local authority distributions for each stream. The different streams are summed within each local authority to create 1,000 simulated in-migrant counts for each local authority. These simulated counts were used to produce the composite measure of uncertainty described in the following section. The processes are summarised in Figure 2.
Figure 2: Overview of the simulation process for international immigrants

Download this image Figure 2: Overview of the simulation process for international immigrants
.png (8.4 kB)5.2.2 International out-migration
5.2.2.1 Overview of the estimation process for international out-migration in the mid-year population estimates
Similarly to international immigration, the process to estimate international emigration uses the International Passenger Survey (IPS). However, we use different methods to produce international immigration and emigration estimates.
IPS estimates cannot be used directly at the local authority level. To produce international emigration estimates at lower levels of geographies, a multi-stage approach is applied to constrain and calibrate the flows, with a statistical model used to distribute the final flows to local authority level. Figure 3 shows an overview of the process used to distribute national level emigration to local authority level.
Figure 3: Overview of method for distributing national level emigration to local authority level
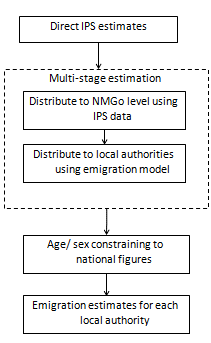
Download this image Figure 3: Overview of method for distributing national level emigration to local authority level
.png (7.2 kB)For international emigration estimates, IPS local authority estimates are first averaged across 3 years (the reference year and the 2 preceding years). These averages are then constrained to New Migration Geography Outflow (NMGo) levels and estimated for local authorities using Poisson regression modelling. The Poisson regression model draws on available and reliable local authority data as predictors (covariates) to model the international emigration estimates at local authority level. The covariates include a range of census, administrative and survey data. The Poisson regression model is based on a strong association between the model covariates and emigration at the local authority level. In order to improve consistency in the time series, we developed a fixed Poisson regression model with a number of significant covariates (6 were used for 2012 to 2016).
The output from the multi-stage estimation process is a set of emigration estimates for each local authority for a single year (for example, 2012).
A final correction is made to account for the age-sex constraining step, which was introduced as an improvement to international migration methods in 2009 (ONS 2009a, b).
5.2.2.2 Deriving uncertainty around the international emigration estimates
To measure uncertainty around the emigration component of the mid-year estimates, we create 1,000 plausible local authority emigration estimates using non-parametric bootstrapping from the IPS. The IPS is re-sampled, with replacement, 1,000 times to create 1,000 datasets. Where the mid-year estimates process averages IPS local authority estimates across 3 years (the reference and preceding 2 years’ of data), the uncertainty measures average equivalent local authority estimates, drawn from 3 sets of simulated IPS datasets (the reference and preceding 2 years’). These average values are passed through the multi-stage estimation process for emigration, mirroring the process used for the mid-year estimates. This produces 1,000 new local authority international emigration estimates. The uncertainty process is summarised in Figure 4.
Figure 4: Overview of method for deriving simulated distribution for emigration
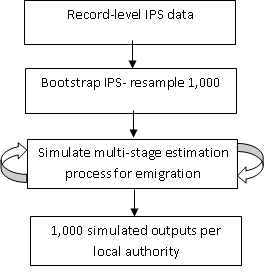
Download this image Figure 4: Overview of method for deriving simulated distribution for emigration
.png (6.7 kB)5.3 Internal migration
5.3.1 Overview of the estimation process for internal migration in the mid-year population estimates The mid-year population estimation process uses the Patient Register Data Service (PRDS), NHS Central Register (NHSCR) and Higher Education Statistics Agency (HESA) data to derive estimates of internal migration by local authority.
Changes in GP registrations are used as a proxy for internal migration. The PRDS records change of address data captured when individuals re-register with a GP. Address changes between 2 time points are captured by comparing successive annual downloads of the Patient Register. We assume a time lag of one month between moving and re-registering with a GP.
This approach does not capture multiple moves during the year or moves by people missing from one of the data downloads, including under-1s, international migrants or people who die between downloads. To capture these, Patient Register data are calibrated upwards to the more comprehensive data provided by the NHSCR. NHSCR data are available at regional, not local authority, level. A further refinement is the use of HESA data, which more accurately captures the migration patterns of students in higher education. This adjusts for the known problem of under-recording of students moving to and from university in GP re-registration data.
Figure 5: Overview of the simulation process for internal migration for year x
Download this image Figure 5: Overview of the simulation process for internal migration for year x
.png (9.6 kB)5.3.2 Measuring uncertainty in the internal migration estimates - an overview
To capture uncertainty in the estimates of internal migration we create a simulated distribution of estimates, using a benchmark approach. We achieve this through modelling internal migration flows using the 2011 internal migration Census transitions data as a benchmark of the “true” measure of internal migration2.
To ensure comparability with Patient Register (PR) transitions, the 2011 Census data excluded Home Armed Forces (HAF) personnel, Foreign Armed Forces (FAF) personnel and their dependants, prisoners and movers with an origin outside of the UK.
We calculate the ratio of census to PR transitions in 2011 by sex, single year of age, and local authority for inflows and outflows separately. This ratio provides a measure of error in the PR (including the HESA adjustment). We use the log of these ratios as the basis for a model. This methodology report refers to these as log scaling factors:
(5.7)
We assume the relationship between the PR transitions and census transitions remains constant over the decade, given the covariates. The observed relationship in 2011 is used to “scale up or down” the PR transitions in subsequent years.
5.3.3 Cluster analysis
Log scaling factor profiles (for inflows and outflows) were inconsistent across local authorities and showed some age-related peaks and troughs. Clustering local authorities based on their scaling factor profiles identified distinct clusters of local authorities with similar age-sex log scaling factor profiles, using K-means clustering. We ran the K-means cluster analysis for 3 clusters, to maintain consistency with the 2002 to 2010 uncertainty measures.
K-means cluster analysis requires a set of starting values. We use 25 sets of “scrambled midpoints” as starting values and exclude scaling factors for those aged over 57 due to the high incidence of missing or zero scaling factors in older ages and their dominating impact on cluster definition. Males and females are clustered separately.
Optimal clustering solutions are selected for both inflows and outflows by comparing mean distance from cluster centre, cluster sizes, cluster distinctions (distances between clusters) and cross-tabulation of cluster memberships between variant results.
Multivariate analysis of variance (MANOVA) tests also checked and confirmed cluster significance for the selected variants and runs. All final variants were highly significant (p<0.0001). We assigned all those local authorities excluded from the final solution to a cluster according to the least Euclidean distance (across all relevant scaling factor variables) from the cluster centre. Local authority membership of each cluster varied between inflows and outflows for some local authorities, and by sex.
5.3.4 Model fitting
We fit a non-linear regression model to the 2011 log scaling factors, based on a 7-parameter Rogers-Castro (1981) age-migration schedule to estimate the mean of the scaling factor distributions. This was carried out separately by direction of flow, sex and cluster (12 models in total). Age-migration curves are generally associated with migration flows; however, they also provided a reasonable initial fit for the log scaling factors.
To achieve the optimal fit by cluster, direction of flow and sex, for each model we focus predominantly on the childhood and labour force curves and exclude log scaling factors for those aged over 57, where data are either missing or very unstable (due to small flows). We also exclude log scaling factors for those aged 20 and 21 in some clusters where the log scaling factor profile did not fit the curve (anomalous patterns in some local authorities are the result of students leaving Higher Education).
To further improve the fit, we add a step change in the overall level parameter so that the level of the curve is lower for younger ages than for older ages.
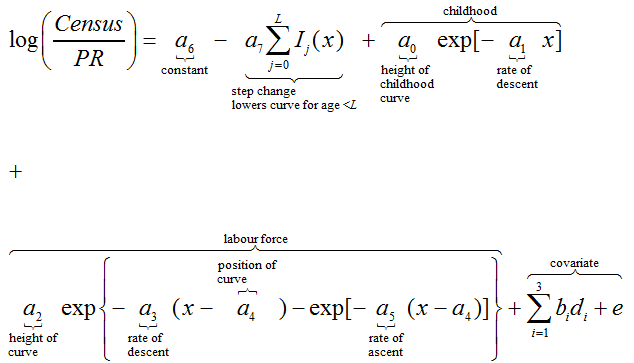
For each sex (y) by cluster model:
(5.8)

where:
Census = Adjusted 2011 Census transitions for age x, sex y in local authority k
PR = 2011 PR transitions for age x, sex y in local authority k
di = Local authority-specific covariates, i = 1,2,3
a0 ,a1 … a7 = Rogers Curve parameters
b1 ,b2 ,b3 = Covariate parameters
Ij (x) = Indicator variable: 1 if j=x and 0 otherwise
e = are independent, normally distributed error terms with mean 0 and non- constant variance
L = sets the age at which the step-change ends and lies between 16 and 22 years, depending on sex, direction of flow and cluster.
5.3.5 Further covariates
Other covariates allow further variation by local authority within clusters and over time. After investigating covariates used for the 2002 to 2010 uncertainty measures and alternative additional covariates, for 2012 to 2016 we chose:
regional gross disposable household income (GDHI) for NUTS 3 region3
proportion of international immigrants (expressed as a percentage of total population)
Index of Multiple Deprivation
5.3.6 Simulation of distributions
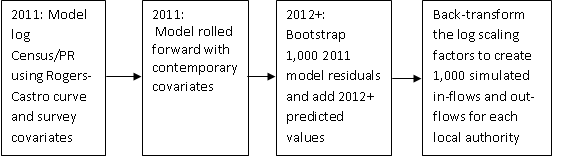
We fit the non-linear regression model with local authority-specific covariates to the 2011 log scaling factors. The model estimates predicted values as well as residuals (calculated as the difference between observed and predicted log scaling factors) for each local authority by age and sex and flow direction.
As census data are not available for years 2012 to 2016, for these years we do the following (see Figure 5):
Use the non-linear regression model, using the 2011 model parameters, along with updated local authority-specific covariate data for each year, to predict the scaling factors for the given year.
Re-sample 1,000 times the raw residuals from the 2011 model (by direction of flow, cluster and sex).
Add the re-sampled (bootstrapped) raw residuals to the predicted scaling factors to give 1,000 simulated log scaling factors for the given year by age, sex and direction of flow, for each local authority.
The variance of the residuals was non-constant over the age distribution. Prior to re-sampling, we divided each set of residuals into “pots” with similar variance. This ensures that for a specific observation we draw values from a pot of residuals with a realistic variance for this local authority, age and sex.
5.3.7 Back transforming the data
For each 1,000 simulated log scaling factors, we back transform by taking the exponential and multiplying by the Patient Register data for the relevant age, sex and local authority for our specified year. This is illustrated by the formula for 2012:
(5.9)
This creates 1,000 estimated transitions for each age, sex, direction of flow, and local authority combination.
Internal migration estimates used in the mid-year population estimates relate to moves and not transitions. In the mid-year estimation process, Patient Register Data Service transitions are adjusted upwards to data on moves based on NHS Central Register totals at the former health authority level.
For the current measures, we assume no error in this adjustment process and apply an additive adjustment to convert our 1,000 simulated transitions into moves. This adjustment up-scales the estimates but does not impact on the measure of uncertainty for the individual internal inflow and outflow components. We aggregate the resulting moves to the local authority level.
5.4 Composite measure
The final stage of the methodology for deriving a statistical measure of uncertainty is to combine the simulated distributions, reflecting the uncertainty for each of the 3 components (2011 Census base, international migration and internal migration) into a single composite measure for each local authority for each year. The cohort component approach for deriving the mid-year estimates (MYEs) is used as a template. The simulated estimates for the base, international and internal migration are combined with the non-varying components, iteration by iteration, to create 1,000 simulated MYEs for each local authority.
The procedures differ for the census year (2011) and the following intercensal years (2012 to 2016). The procedure for 2011 is given in equation (5.10) and for years 2012 to 2016 in equation (5.11).
For each iteration in 2011:
(5.10)
where:
Pk (2011)(i) = simulated population at mid-year 2011 for local authority k for iteration i
cenk (i) = simulated 2011 Census estimate in local authority k for iteration i
mk (i) = simulated value for the census day to 30 June 30th correction in local authority k for iteration i
For each of the iterations i in the years 2012 to 2016 we use the cohort component method:
(5.11)
where:
Pk (t) = simulated population in mid-year t for local authority k
bk (t-1)(t) = births between mid-year t-1 and mid-year t for local authority k
dk (t-1)(t) = deaths between mid-year t-1 and mid-year t for local authority k
ink (t-1)(t) = simulated internal in-migration between mid-year t-1 and mid-year t for local authority k
ok (t-1)(t) = simulated internal out-migration between mid-year t-1 and mid-year t for local authority k
imk (t-1)(t) = simulated international in-migration between mid-year t-1 and mid-year t for local authority k
emk (t-1)(t) = simulated international out-migration between mid-year t-1 and mid-year t for local authority k
Uncertainty is measured directly from the final composite distribution for each local authority. The primary “uncertainty measure” reported in this research is the “root mean squared error” (RMSE). When measured as a percentage of the mean of the simulated composite measures, this becomes the “relative root mean squared error’” (RRMSE), calculated as:
(5.12)
where P(t)(i) is the simulated value for the year t and iteration i and
p̄(t) represents the mean of the simulated values
n is the number of simulations and MYE is the mid-year estimate.
This measure acknowledges the bias in the simulations and allows meaningful comparison across all 348 local authorities. We have also standardised our figures to the 2011 census estimate for each local authority, to support comparisons over time and place. We also provide the proportional contribution that each component (2011 Census, internal migration and international migration) makes to the primary uncertainty measure.
We have identified three methods for deriving 95% confidence intervals for the published MYEs. Our preferred method is the bias-adjusted confidence intervals, but we supply all 3 to support your understanding of our methodological approach and of the options available:
Empirical confidence intervals for each local authority are created by ranking the 1,000 simulated values of the population estimate P~k (t) and taking the 26th and 975th values as the lower and upper bounds respectively. As the observed MYE generally differs from the median of the simulations, this confidence interval is not centred about the MYE and in some extreme cases the MYE is outside the bounds of the empirical 95% confidence interval.
Centred empirical confidence intervals are created by moving the empirical 95% confidence intervals so that they are centred about the observed MYEs. The difference between the median of the simulated values and the observed MYE is subtracted from each of the lower and upper bounds. While the width of the confidence interval remains the same it does not account for the bias component due to the difference between the MYE and the median of the simulation.
Bias-adjusted confidence intervals are calculated as the MYE plus or minus ±1.96 multiplied by RMSE. The RMSE is the variability of the simulated values around the MYE. This confidence interval will be symmetric about the MYE and will include a measure of uncertainty due to bias between the MYE and the simulations.
We favour the bias-adjusted confidence interval because it is wider, reflecting the difference between the published mid-year estimate and the mean of the simulated composite measures. The discrepancy between the published mid-year estimate and the mean of the simulated composite measures may arise for a number of reasons, including:
the uncertainty methodology only accounts for uncertainty in the census, international and internal migration components
the assumptions underlying the uncertainty or MYEs methodology
the uncertainty figures are estimates, and so are subject to some uncertainty themselves
We have also specifically identified the undercounting of young males in the internal migration component of the MYEs, to help explain this discrepancy.
We interpret the bias-adjusted confidence intervals in the following way. If the assumptions we have made in estimating uncertainty are correct, we would expect these intervals on average to capture the mid-year population 95% of the time. However, if the bias is relatively large then these confidence intervals will be conservative, i.e., have coverage greater than 95%. Use and interpretation of the confidence intervals will be reviewed as we approach the 2021 census when uncertainty around the MYEs is at its highest level.
Notes for: Developing a statistical measure of uncertainty
This is calculated as the root mean squared error between the simulations and the mid-year estimate, as a percentage of the mean of the simulations.
The uncertainty measures process has not estimated uncertainty in census migration flows. If some quantification of uncertainty in census migration flows was available it could be incorporated into the uncertainty measures process after the internal migration modelling. The impact of this would be to widen the empirically derived confidence intervals.
Nomenclature of Territorial Units for Statistics (NUTS), NUTS 3 is the classification for unitary authorities or districts in England, or groups of unitary authorities in Wales.
6. Results
Research-based uncertainty measures for 2012 to 2016 are published alongside this working paper. The measures include:
a spreadsheet of uncertainty measures for each local authority for 2012 to 2016
a spreadsheet containing the confidence intervals for each local authority for 2012 to 2016
interactive maps, which allow comparison of the primary measure of uncertainty across local authorities over time
The spreadsheets are interactive. They allow you to select a local authority and then view either 1) the proportions of uncertainty that are attributable to each of the 3 main components, or 2) their confidence intervals, over time.
Tabulated measures include, for each local authority:
the published mid-year estimate (MYE)
uncertainty measure (percentage of population) (the relative root mean squared error (RRMSE))
the percentage contribution of each component (2011 Census, internal migration, international migration) to the uncertainty measure
the upper and lower bounds of the bias-adjusted confidence intervals (the empirical and centred confidence intervals are supplied in the interactive spreadsheet)
6.1 Measure of uncertainty (relative root mean squared error)
Table 2 shows the root mean squared error, as a percentage of the mean of the simulated composite measure, or relative root mean squared error (RRMSE). Reflecting the rolled-forward nature of the methodology for deriving our mid-year population estimates, uncertainty increases over time as we move further away from the 2011 Census.
For just under half of local authorities (173) this increase was relatively small, and the uncertainty measure remained within 0 to 2% of the simulated local authority population by 2016. Of the remaining 175 local authorities, 17 have a measure of uncertainty that is greater than 5% of the local authority population by 2016. Although column 2 shows local authorities with a RRMSE greater than 10% in 2016, this applies only to the City of London (RRMSE equals 13.26%) which, because of its small size, can be regarded as an outlier.
Table 2 shows that, in 2016, for most (331) local authorities the RRMSE lies between 0 and 5%, of which the majority are less than 2%. In addition to the City of London, local authorities with RRMSEs over 5% in 2016 are Stratford on Avon (RRMSE equals 5.10%), Oxford (5.34%), Southwark (5.42%), Westminster (5.71%), Camden (5.72%), Brent (6.17%), Tower Hamlets (6.19%), Kensington and Chelsea (6.23%), Bournemouth (7.30%), Kingston upon Thames (7.76%), Exeter (7.88%), Merton (7.92%), Reading (8.14%), Wandsworth (8.92%), Cambridge (8.97%) and Hammersmith and Fulham (9.98%).
Table 2: 2012 to 2016 range for the root mean squared error of the simulations, as a percentage of the mean of the simulated composite measures (relative root mean squared error, RRMSE)
| Year | Range (%) | ˂2% | 2 to less than 5% | ≥5% |
| 2012 | 0.36 to 7.01 | 340 | 7 | 1 |
| 2013 | 0.41 to 10.76 | 319 | 28 | 1 |
| 2014 | 0.49 to 11.76 | 281 | 64 | 3 |
| 2015 | 0.53 to 12.41 | 218 | 120 | 10 |
| 2016 | 0.58 to 13.26 | 173 | 158 | 17 |
| Source: Office for National Statistics | ||||
Download this table Table 2: 2012 to 2016 range for the root mean squared error of the simulations, as a percentage of the mean of the simulated composite measures (relative root mean squared error, RRMSE)
.xls (27.1 kB)To allow comparison with the 2002 to 2010 uncertainty measures, Table 3 provides the relative standard deviations (for 2012 to 2016), presented as a percentage of the mean of the simulated composite measure. This measures deviation from the mean of the simulations rather than from the MYE, as for the RRMSE. Table 4 provides the equivalent measures from 2002 to 2006.
Table 3: 2012 to 2016 range for the relative standard deviation, as a percentage of the mean of the simulated composite measures
| Year | Range (%) | ˂2% | 2 to less than 5% | ≥5% | ||
| 2012 | 0.35 to 5.39 | 343 | 4 | 1 | ||
| 2013 | 0.40 to 10.66 | 333 | 14 | 1 | ||
| 2014 | 0.46 to 11.39 | 329 | 18 | 1 | ||
| 2015 | 0.48 to 11.81 | 322 | 25 | 1 | ||
| 2016 | 0.50 to 12.61 | 305 | 41 | 2 | ||
| Source: Office for National Statistics | ||||||
Download this table Table 3: 2012 to 2016 range for the relative standard deviation, as a percentage of the mean of the simulated composite measures
.xls (27.1 kB)
Table 4: 2002 to 2006 range for the relative standard deviation, as a percentage of the mean of the simulated composite measures
| Year | Range (%) | ˂2% | 2 to less than 5% | ≥5% |
| 2002 | 0.34 to 10.87 | 365 | 10 | 1 |
| 2003 | 0.36 to 16.08 | 359 | 16 | 1 |
| 2004 | 0.38 to 19.65 | 356 | 19 | 1 |
| 2005 | 0.40 to 18.76 | 350 | 25 | 1 |
| 2006 | 0.41 to 18.02 | 341 | 33 | 2 |
| Source: Office for National Statistics | ||||
Download this table Table 4: 2002 to 2006 range for the relative standard deviation, as a percentage of the mean of the simulated composite measures
.xls (27.1 kB)Table 4 shows that this measure is broadly consistent between the 2 decades. The 2002 to 2006 outlier, which was also the City of London, had a more extreme relative standard deviation of 18.02% in 2006, compared with 12.61% in 2016. There were 376 local authorities in the 2002 to 2006 series and 348 in 2012 to 2016, following reclassification in 2009.
6.2 Proportional contributions from the 3 components
Tables 5, 6 and 7 summarise the relative contributions to uncertainty that come from the 2011 Census, internal migration and international migration components of the mid-year population estimates. Table 5 shows that in 2012 for the majority of local authorities (330), the greatest proportion of uncertainty came from the census component. In 2012, uncertainty as measured by the relative root mean squared error (RRMSE) was less than 2% for the majority of local authorities (340) (see Table 2). The influence of the census on uncertainty declines over time and by 2016 the census accounted for 50% of uncertainty in 155 local authorities. The influence of other components becomes more visible over time. In 2016, international migration accounted for more than 50% of uncertainty in 93 local authorities, while internal migration accounted for over 50% of the uncertainty in just 17 local authorities.
Table 5: Number of local authorities by percentage of overall uncertainty from the 2011 Census base
| Year | Range (%) | ˂25% | 25 to less than 50% | 50 to less than 75% | ≥75% |
| 2012 | 8 to 99 | 2 | 16 | 52 | 278 |
| 2013 | 2 to 98 | 17 | 48 | 112 | 171 |
| 2014 | 2 to 96 | 26 | 79 | 118 | 125 |
| 2015 | 1 to 95 | 51 | 97 | 122 | 78 |
| 2016 | 1 to 94 | 85 | 108 | 94 | 61 |
| Source: Office for National Statistics | |||||
Download this table Table 5: Number of local authorities by percentage of overall uncertainty from the 2011 Census base
.xls (27.1 kB)
Table 6: Number of local authorities by percentage of overall uncertainty from international migration
| Year | Range (%) | ˂25% | 25 to less than 50% | 50 to less than 75% | ≥75% |
| 2012 | 0 to 90 | 321 | 16 | 10 | 1 |
| 2013 | 0 to 98 | 259 | 55 | 22 | 12 |
| 2014 | 0 to 98 | 249 | 57 | 29 | 13 |
| 2015 | 0 to 98 | 215 | 66 | 46 | 21 |
| 2016 | 1 to 99 | 175 | 80 | 52 | 41 |
| Source: Office for National Statistics | |||||
Download this table Table 6: Number of local authorities by percentage of overall uncertainty from international migration
.xls (27.1 kB)
Table 7: Number of local authorities by percentage of overall uncertainty from internal migration
| Year | Range (%) | ˂25% | 25 to less than 50% | 50 to less than 75% | ≥75% |
| 2012 | 0 to 45 | 336 | 12 | 0 | 0 |
| 2013 | 0 to 53 | 298 | 49 | 1 | 0 |
| 2014 | 1 to 61 | 258 | 83 | 7 | 0 |
| 2015 | 1 to 65 | 242 | 94 | 12 | 0 |
| 2016 | 1 to 66 | 229 | 102 | 17 | 0 |
| Source: Office for National Statistics | |||||
Download this table Table 7: Number of local authorities by percentage of overall uncertainty from internal migration
.xls (27.1 kB)6.3 Bias-adjusted 95% confidence intervals
Table 8 shows that for the majority of local authorities, the width of the bias-adjusted 95% confidence interval relative to the mean of the simulated composite measures is less than 10% (227 in 2016). As expected, the width of the confidence interval relative to the population increases over time as we move further away from the census. Use and interpretation of the confidence intervals will be reviewed as we approach the 2021 census when uncertainty around the MYEs is at its highest level.
Table 8: Bias-adjusted 95% confidence interval range, as a percentage of the mean of the simulated composite measures
| Year | Confidence interval range (%) | ˂5% | 5 to less than 10% | 10 to less than 20% | 20 to less than 50% | ≥50% |
| 2012 | 1.40 to 27.47 | 306 | 40 | 1 | 1 | 0 |
| 2013 | 1.62 to 42.16 | 236 | 96 | 15 | 1 | 0 |
| 2014 | 1.86 to 45.70 | 161 | 159 | 25 | 3 | 0 |
| 2015 | 1.99 to 47.71 | 123 | 159 | 57 | 9 | 0 |
| 2016 | 2.27 to 51.98 | 89 | 138 | 105 | 15 | 1 |
| Source: Office for National Statistics | ||||||
Download this table Table 8: Bias-adjusted 95% confidence interval range, as a percentage of the mean of the simulated composite measures
.xls (27.6 kB)7. Summary
Our mid-year population estimates are the best estimates of the usually resident population that are currently available between the decennial census years. The processes used to derive the mid-year estimates are complex, with many different components. Some uncertainty around them is, therefore, expected. However, the complexity of the methodology makes it impossible to estimate this uncertainty directly. The methodology described in this working paper aims to quantify uncertainty and to give an indication of the relative contribution to this uncertainty by each of the 3 components identified as having the greatest impact on uncertainty: the 2011 Census base, international and internal migration.
We have used the relative root mean squared error (RRMSE) as the primary measure of uncertainty. This measure resembles the relative standard deviation, but incorporates an adjustment for bias in the estimates. Our estimates show that out of the 348 local authorities in 2012, for 340 (98%) this was less than 2%. By 2016, there were 173 local authorities (just under 50% of the total) that had RRMSEs of less than 2%, but only 17 local authorities (5% of the total) had RRMSEs exceeding 5%.
The uncertainty methodology is based on 3 components with the greatest impact on uncertainty, so does not incorporate all of the uncertainty associated with all of the data sources and processes involved in the production of mid-year estimates. These should therefore be considered to be conservative estimates of uncertainty.
Bias in the mid-year estimates, which is represented by the difference between the median of the simulated populations for each year and the corresponding published mid-year estimate, is primarily attributable to the discrepancy between our modelled post-census internal migration flows and the corresponding flows in the published mid-year estimates.
Our methods for measuring uncertainty assume that the relationship between the census and the Patient Register (supplemented by Higher Education Statistics Agency) measure remains constant over time, given the covariates. Increasingly we suspect that this does not hold, given recent initiatives within the NHS to clean their Patient Registers. List-cleaning activity is geographically uneven and will generate anomalous simulated internal migration flows. This aspect of the methodology will be reviewed in future. Nevertheless, our chosen confidence intervals are bias-adjusted and thereby allow for the increased uncertainty in the estimates for the affected areas.
The proportional contributions to uncertainty from the 2011 Census, internal and international migration follow expected patterns. The relative influence of the 2011 Census on uncertainty declines over time, as the estimates for areas with high population churn are more heavily influenced by the internal and international migration components.
Every care has been taken to implement and quality assure the methodology and outputs. However, this approach depends on the assumptions made when constructing them and the input data used to generate the outputs. Sometimes, the method generates extreme values that would be unlikely to arise in reality. This does not undermine our confidence in the methodology or the data, but emphasises the need for caution in interpreting these results.
We welcome comments and observations on these research methods and results. This project has involved applying statistical bootstrapping in a range of contexts and on a range of data sources. As we increasingly move towards statistics that integrate survey, administrative and other sources, the relevance of these approaches is becoming more apparent.
Back to table of contents8. References
Efron, B. and Tibshirani, R.J. (1993). An Introduction to Bootstrap, London, Chapman and Hall
Office for National Statistics (2006). Report of the inter-departmental Task Force on Migration Statistics.
Office for National Statistics ONS (2008 to 2012). Migration Statistics Improvement Programme (MSIP).
Office for National Statistics (2009a). Estimating international long-term immigration by local authority (LA).
Office for National Statistics (2009b). Estimating international long-term emigration by local authority (LA).
Office for National Statistics (2010). Improving Migration and Population Statistics - Quality measures for population estimates.
Office for National Statistics (2011). Improved Immigration Estimates to Local Authorities in England and Wales: Overview of Methodology.
Office for National Statistics (2012a). Uncertainty in local authority mid-year population estimates quality indicators.
Office for National Statistics (2012b). Uncertainty in local authority mid-year population estimates.
Office for National Statistics (2013). 2011 Census Confidence Intervals.
Office for National Statistics (2014). International Passenger Survey (IPS) Methodology.
Office for National Statistics (2015). International Passenger Survey Quality and Methodology Information.
Office for National Statistics (2016). Methodology Guide for Mid-2015 UK Population Estimates (England and Wales).
Ou, X. Smith, P.W. (2012). The Developed Methodology to Estimate Statistical Error of Mid-year Local Authority Emigration Estimates. Southampton Statistical Sciences Research Institute, unpublished report for the Office for National Statistics.
Rogers, A. and Castro, L. J. (1981). Model Migration Schedules. Laxenburg: International Institute for Applied Systems Analysis, Research Report, RR-81-30.
Sexton, C.J., Brown, J., Taylor, A., Abbott, O. (2014). The Quality of Existing Small Area Census Attribute Data. Office for National Statistics, unpublished report.
UK Statistics Authority (2009a). Migration Statistics: The Way Ahead.
UK Statistics Authority (2009b). Code of practice for Official Statistics.
Back to table of contentsYou might also be interested in:
- Measures of statistical uncertainty summary
- Guidance on interpreting the statistical measures of uncertainty in ONS local authority mid-year population estimates
- Measures of uncertainty with proportional contributions
- Measures of uncertainty - all confidence intervals
- Population estimates
- Population estimates: quality information