1. Main points
According to the latest Business Impact of Coronavirus (COVID-19) Survey (BICS), 13% of the workforce remain on furlough leave, with 70% of furloughed employees receiving top ups from employers to their pay. See Section 2.
Company incorporations returned to the levels seen in June and July 2020, at 3,393 incorporations per working day, and remained higher than the 2,612 per working day on average the same time last year in Quarter 3 (July to Sept) 2019, according to data from Companies House. See Section 3.
Total online job adverts remained at just over half (55%) of the 2019 average for the third consecutive week. See Section 4.
Energy Performance Certificate (EPC) lodgements for new dwellings increased to their highest level since 16 March but remained below the level observed at the end of February. See Section 5.
Overall footfall at retail locations continued to rise in the week commencing 17 August, with footfall in retail parks increasing to 90% when compared with the same day a year ago and shopping centres to just under 70%. See Section 6.
On Monday 24 August, all motor vehicle traffic was six percentage points lower than traffic seen on the equivalent Monday in the first week of February, mainly driven by reduced car traffic, according to data from the Department for Transport (DfT). See Section 7.
Between 17 and 23 August, the average volume of daily ship visits was 306 compared with 345 in the previous week, only slightly above the levels seen in April and May. See Section 8.
The Opinions and Lifestyle Survey (OPN) is not included in this release and will return next week, while the online price change for high-demand products (HDPs) has been discontinued and will no longer be included. We will expand our range of weekly online price indices to cover a broader selection of food and drink items and will look to start publishing the expanded basket in the coming weeks.
The Business Impact of COVID-19 Survey (BICS) is voluntary and currently unweighted, so it may only reflect the characteristics of those who responded. Results presented are experimental.
2. Business impact of the coronavirus
This section includes final headline results from Wave 11 of the Business Impact of Coronavirus (COVID-19) Survey (BICS) for the period 27 July to 9 August 2020, which closed on 23 August 2020. Out of 23,905 businesses sampled, 25% responded. The full results are available in Coronavirus and the economic impacts on the UK: 27 August 2020.
Figure 1: 13% of the workforce remained on furlough leave, with 70% of furloughed employees receiving top ups to their pay by employers
Headline indicators from the Business Impact of Coronavirus (COVID-19) Survey, UK, 27 July to 9 August 2020
Embed code
Source: Office for National Statistics - Business Impact of Coronavirus (COVID-19) Survey
Notes:
- All percentages are a proportion of the number of businesses that responded apart from the workforce percentages on furlough leave and receiving pay top-ups, which are proportions of employees for each responding business.
Download the data
Of all responding businesses:
- 93% had been trading for more than the last two weeks
- 2% had started trading again within the last two weeks after a pause in trading
- less than 1% had paused trading but intend to restart trading in the next two weeks
- 3% had paused trading but do not intend to restart in the next two weeks
- less than 1% had permanently ceased trading
The accommodation and food services industry and the arts, entertainment and recreation industry were the only industries that reported less than 90% of businesses had been trading for more than the last two weeks, at 82% and 63% respectively. However, these industries also had the highest percentages of businesses reporting they had restarted trading within the last two weeks, at 8% and 12% respectively.
Of all businesses that had not permanently ceased trading, 11% reported a moderate or severe risk of insolvency. The industry breakdown of this is shown in Figure 2.
Figure 2: Almost a quarter (23%) of businesses in the accommodation and food services and arts, entertainment and recreation industries said their risk of insolvency was moderate or severe
Percentage of businesses not permanently stopped trading, UK, 27 July to 9 August 2020
Source: Office for National Statistics – Business Impact of Coronavirus (COVID-19) Survey
Notes:
- The percentages in this chart might not sum to 100% because of rounding and the removal of the category “the business is insolvent” as the result is less than 1%.
Download this chart Figure 2: Almost a quarter (23%) of businesses in the accommodation and food services and arts, entertainment and recreation industries said their risk of insolvency was moderate or severe
Image .csv .xlsIn the accommodation and food services industry, 19% of businesses that had not permanently ceased trading said that their risk of insolvency was moderate, and 4% said that it was severe. In the arts, entertainment and recreation industry, the proportions were 21% and 2% respectively.
The water supply industry had the highest proportion of businesses reporting their risk of insolvency was low or no risk, with 90% of businesses reporting one of these categories.
More about coronavirus
3. Company incorporations and voluntary dissolution applications
Figure 3: In the week starting Saturday 15 August, company incorporations returned to the levels seen in June and July 2020, at 3,393 incorporations per working day
Company incorporations per working day, UK, quarterly and weekly, Quarter 1 2019 to Quarter 2 2020, and w/c 28 February 2020 to w/c 15 August 2020
Source: Companies House and Office for National Statistics
Notes:
- Data presented per working day to allow comparison between quarterly data and weekly data and account for processing differences associated with Bank Holidays.
- Quarterly data from Companies House official statistics release, divided by number of working days, presented at the mid-point of the calendar quarter.
- Weekly data are for week commencing Saturday to Friday, as incorporation requests received on Saturdays and Sundays are typically processed on subsequent weekdays. For more information, see the accompanying Companies House methodology page.
- Please note that Companies House quarterly Official Statistics include figures for Community Interest Company (CIC) incorporations, which are not included in the weekly series. Typically, these account for less than 1% of incorporations.
Download this chart Figure 3: In the week starting Saturday 15 August, company incorporations returned to the levels seen in June and July 2020, at 3,393 incorporations per working day
Image .csv .xlsIn the week starting Saturday 15 August, there was an average of 3,393 incorporations per working day, a substantial increase from 3,002 in the previous week. This is above the Quarter 3 (July to Sept) 2019 average of 2,612 per working day.
The observed fluctuations in weekly incorporations per working day between April to early May 2020 and June to the end of July 2020 coincide with government-instigated lockdown measures and the subsequent easing of them in response to the coronavirus (COVID-19) pandemic. This is in line with official statistics published by Companies House on 30 July 2020.
Figure 4: In the week starting Saturday 15 August, voluntary dissolution applications decreased for the fourth consecutive week to 828 per working day
Company voluntary dissolution applications per working day, UK, quarterly and weekly, Q1 2019 to Q2 2020, and w/c 28 February 2020 to w/c 15 August 2020
Source: Companies House and Office for National Statistics
Notes:
- Data presented per working day to allow comparison between quarterly data and weekly data and account for processing differences associated with Bank Holidays. Quarterly data are presented at the mid-point of the quarter.
- Weekly data are weeks from Saturday to Friday, as voluntary dissolution requests received on Saturdays and Sundays are typically processed on subsequent weekdays. For more information, see the accompanying Companies House methodology page.
Download this chart Figure 4: In the week starting Saturday 15 August, voluntary dissolution applications decreased for the fourth consecutive week to 828 per working day
Image .csv .xlsIn the week starting Saturday 15 August, there was an average of 828 voluntary dissolution applications per working day, a continued decrease from 865 in the previous week. This remains lower than the Quarter 3 2019 average of 1,008 per working day.
For more information on other measures of company closures not presented here, see Weekly indicators of company creations and closures from Companies House methodology: August 2020.
Back to table of contents4. Online job adverts
These figures use job adverts provided by Adzuna, an online job search engine, and include experimental estimates of online job adverts by Adzuna category and by UK country and NUTS1 regions. These estimates and the methodology used to produce them will continue to be developed over time. The Adzuna categories used do not correspond to Standard Industrial Classification (SIC) categories, so these values are not directly comparable with the Office for National Statistics (ONS) Vacancy Survey. The number of job adverts over time is an indicator of the demand for labour.
In this week’s release, we have removed duplicate job adverts that were caused by Adzuna reassigning national adverts to numerous locations across the UK. These adverts were causing inflation in some Adzuna categories for some periods, as previously highlighted in our reference tables. We have now removed these duplicate adverts from the series, which has caused a level shift in the time series of some categories.
This impacts the time series of vacancies by NUTS1 regions to the extent that the affected Adzuna categories are concentrated in certain regions. Users should note that other types of duplicates still remain in the data and that this correction does not address duplicate job adverts advertised across different locations by other sources. More information of possible cases of duplication can be found in our methodology note.
Figure 5: Total online job adverts remained at just over half (55%) of the 2019 average for the third consecutive week (54% in the two previous weeks)
Total weekly job adverts on Adzuna, UK, 4 January 2019 to 21 August 2020: index 2019 average = 100
Embed code
Notes:
- The observations were collected on a roughly weekly basis; however, they were not all observed at the same point in each week, leading to slightly irregular gaps between each observation.
- These series have a small number of missing weeks, mostly in late 2019, and the latest is in January 2020. These values have been imputed using linear interpolation. The data points that have been imputed are clearly marked in the accompanying dataset.
- Further category breakdowns are included in the Online job advert estimates dataset, and more details on the methodology can be found in Using Adzuna data to derive an indicator of weekly vacancies.
Download the data
Of the 29 Adzuna categories,18 increased compared with the previous week and 10 decreased. The largest increase was in the facilities maintenance category, which increased by 15 percentage points to 56% above its 2019 average. The largest decreases were in domestic help, which decreased by five percentage points to its 2019 average, followed by education, which decreased by four points to 41% below its 2019 average. The decrease in education is similar to the same time last year, so this may be a seasonal effect. Of the categories featured in Figure 5, both the health care and social care and education categories are now around the same level they were the same time a year ago.
Figure 6 shows the latest volume of online job adverts in each region compared with the 2019 average (blue bars), the percentage point change from the 2019 average to the lockdown minimum, which may be a different date for each region (yellow bars), and the percentage point change from the lockdown minimum to the latest value (blue dots).
Figure 6: Yorkshire and The Humber had the greatest decline from its 2019 average to the latest week, a decline of 56 percentage points
Total weekly job adverts on Adzuna, UK, 4 January 2019 to 21 August 2020: index 2019 average = 100, difference in percentage points compared to 2019 average
Source: Adzuna
Notes:
- Full series for each country and the NUTS1 regions are available in the accompanying dataset.
- Note that from 7 August 2020, a new source for Northern Ireland has been included, leading to a discontinuity in the series.
Download this chart Figure 6: Yorkshire and The Humber had the greatest decline from its 2019 average to the latest week, a decline of 56 percentage points
Image .csv .xlsExcluding Northern Ireland (which has a discontinuity in the backseries because of the introduction of a new source on 7 August), the next largest recovery from its lockdown minimum compared to the latest week was the East Midlands at 33 percentage points (shown as dots on the chart above), when indexed to the 2019 average. Yorkshire and The Humber had the greatest decline from its 2019 average to the latest week by 56 percentage points, driven by a joint-worst decline to the lockdown minimum followed by the smallest recovery of job adverts across regions since then (15 percentage points).
Wales and the North East were the only two regions of the UK that had a decrease in the number of adverts this week, both declining by less than one percentage point. The largest increase was in Scotland, by two percentage points.
Back to table of contents5. Energy Performance Certificates
This release includes weekly Energy Performance Certificates (EPCs) for new and existing domestic properties in England and Wales up to the week beginning 17 August 2020, split by NUTS1 English regions.
EPCs are used as a timely indicator for the number of completed constructions (new EPCs) and number of transactions (existing EPCs). The statistics are published weekly by the Ministry of Housing, Communities and Local Government (MHCLG).
Figure 7: EPC lodgements for new dwellings in England and Wales increased to their highest level since 16 March but remained below the level observed at the end of February.
Existing and new Energy Performance Certificates lodgements by region, non-seasonally adjusted, February 2020 to August 2020. Percentage change since week commencing 24 February 2020
Embed code
Source: Ministry of Housing, Communities and Local Government (MHCLG) Domestic Energy Performance Certificate Register
Notes:
- Further notes are available in the weekly EPCs for domestic properties dataset.
- More information on the EPC methods, strengths and limitations is available in the accompanying methodology article.
- The time series begins on the week commencing 24 February 2020; we will look to expand this in the future.
- Wales shown on a different scale. The spike in the number of EPCs for existing dwellings seen in Wales during the weeks commencing 8 and 15 June 2020 was caused by local authorities in Wales reviewing their social housing stock.
Download this chart
In the week commencing 17 August 2020, EPC lodgements for existing dwellings in England remained around the level observed at the end of February, and in Wales they reached close to their end of February level for the first time since early March. EPC lodgements for new dwellings across all regions increased to 83% of their level at the end of February, compared with 75% the week before.
Back to table of contents6. Footfall
These figures are provided by Springboard, a provider of data on customer activity. They measure the volume of footfall compared with the same day the previous year at the overall level and across the categories of high streets, retail parks and shopping centres. For example, Tuesday 14 July 2020 was compared with Tuesday 16 July 2019.
Figure 8 shows the overall footfall seven-day average continued to increase in the latest week (17 to 23 August 2020), to around 70% of the level on the same day a year ago, driven by increased footfall at retail parks and shopping centres. This continues the gradual increase in footfall seen since the reopening of non-essential shops and businesses in England on 15 June. Footfall on high streets has remained stable over the last few weeks.
Footfall estimates from Springboard for the latest week complements findings from our latest Business Impact of Coronavirus (COVID-19) Survey (BICS), which show 48% of applicable trading businesses in the wholesale and retail industry have seen decreased footfall compared to what is normally expected for this time of year.
Figure 8: Overall footfall continued to rise in the week commencing 17 August, with footfall in retail parks increasing to 90% when compared with the same day a year ago and shopping centres to just under 70%
Volume of footfall, year-on-year percentage change between footfall on the same day, UK, 1 March to 23 August 2020

Source: Springboard and the Department for Business, Energy and Industrial Strategy
Notes:
- Many non-essential shops were allowed to open on 15 June 2020 in England, 12 June 2020 in Northern Ireland and 22 June 2020 in Wales. In Scotland, some non-essential shops were allowed to reopen from 29 June 2020 and more from 13 to 15 July 2020.
- “Prime Minister’s announcement” refers to the advisory announcement on 16 March 2020 to avoid non-essential travel, bars, restaurants and other indoor leisure venues and to work from home if possible.
- Pubs were allowed to reopen on 4 July in both England and Northern Ireland, with beer gardens allowed to reopen on 6 July in Scotland and 13 July in Wales. Pubs were also allowed to reopen indoors in Scotland on 15 July.
Download this image Figure 8: Overall footfall continued to rise in the week commencing 17 August, with footfall in retail parks increasing to 90% when compared with the same day a year ago and shopping centres to just under 70%
.PNG (78.6 kB)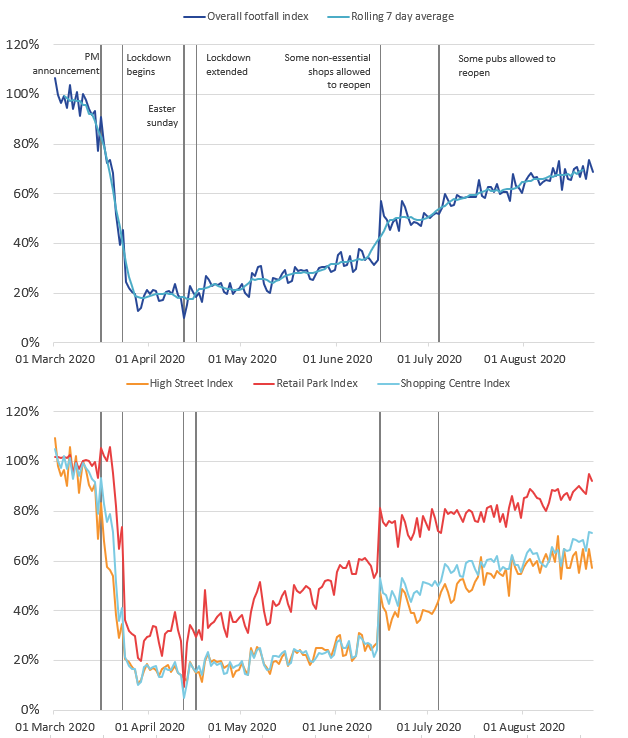
7. Road traffic
The Department for Transport (DfT) daily road traffic estimates use data from around 275 automatic traffic count sites across Great Britain covering all road types, which are published weekly.
The daily DfT estimates are indexed to the first week of February and the comparison is to the same day of the week. The dates provided are useful as an indication of traffic change rather than actual traffic volumes. More information on the methods, quality and economic analysis for these indicators can be found in the methodology article.
Figure 9: On Monday 24 August, all motor vehicle traffic was six percentage points lower than traffic seen on the equivalent Monday in the first week of February, driven by reduced car traffic
Daily road traffic index: 100 = same traffic as the equivalent day of the week in the first week of February, non-seasonally adjusted, UK, 1 March 2020 to 24 August 2020
Source: Department for Transport road traffic statistics: management information
Download this chart Figure 9: On Monday 24 August, all motor vehicle traffic was six percentage points lower than traffic seen on the equivalent Monday in the first week of February, driven by reduced car traffic
Image .csv .xlsFigure 9 shows all motor vehicles traffic has been gradually returning to levels seen in the first week of February 2020 following a lockdown low point around the end of March. The latest road traffic data up to Monday 24 August show traffic for all motor vehicles was six percentage points lower than traffic seen on the equivalent Monday in the first week of February. This is an increase from nine percentage points lower on Monday 17 August 2020.
Car traffic on Monday 24 August was eight percentage points lower than traffic on the equivalent Monday in the first week of February, an increase from 12 percentage points lower on Monday 17 August 2020.
Back to table of contents8. Shipping
These shipping indicators are based on counts of all vessels and cargo and tanker vessels. As discussed in Faster indicators of UK economic activity: shipping, we expect the shipping indicators to be related to the import and export of goods.
The time series of daily and weekly passenger visits have been temporarily suspended because of quality concerns. We are investigating and hope to reinstate these series in future releases.
Figure 10: Between 17 and 23 August, the average volume of daily ship visits was 306 compared with 345 in the previous week, only slightly above the levels seen in April and May
Daily movements in shipping visits, seasonally adjusted, UK, 1 January to 23 August 2020
Source: exactEarth
Download this chart Figure 10: Between 17 and 23 August, the average volume of daily ship visits was 306 compared with 345 in the previous week, only slightly above the levels seen in April and May
Image .csv .xls
Figure 11: Between 17 and 23 August, the average daily volume of visits for cargo ships was 93 ships a day, compared with 98 the previous week
Daily movements in shipping visits, seasonally adjusted, UK, 1 January to 23 August 2020
Source: exactEarth
Notes:
- The number of visits for Hull are included in these data from 1 June 2020 onwards.
- The seasonally adjusted and trend estimates are estimated using a modified version of the seasonal adjustment method TRAMO-SEATS. More information is available in the Coronavirus and the latest indicators for the UK economy and society methodology.
- The seasonal adjustment method may be limited as this is a short time series.
- Daily and weekly shipping visits and unique visits are available by port in the dataset, along with non-seasonally adjusted aggregate series.
Download this chart Figure 11: Between 17 and 23 August, the average daily volume of visits for cargo ships was 93 ships a day, compared with 98 the previous week
Image .csv .xls9. Data
Weekly and daily shipping indicators
Dataset | Released 27 August 2020
The weekly and daily shipping indicators dataset associated with the faster indicators of UK economic activity.
Online job advert estimates
Dataset | Released 27 August 2020
Experimental job advert indices covering the UK job market.
Business Impact of Coronavirus (COVID-19) Survey (BICS) results
Dataset | Released 27 August 2020
Responses from the new voluntary fortnightly business survey, which captures businesses responses on how their turnover, workforce prices, trade and business resilience have been affected in the two week reference period.
10. Glossary
Faster indicator
A faster indicator provides insights into economic activity using close-to-real-time big data, administrative data sources, rapid response surveys or Experimental Statistics, which represent useful economic and social concepts.
Company incorporations
Incorporations are when a company is added to the Companies House register of limited companies. This can also include where an existing business applies to become a limited company, where it was not one before.
Voluntary dissolution applications
A voluntary dissolution application is when a company applies to begin dissolution proceedings. As such, they effectively chose to be removed from the Companies House register. For a company to be eligible to voluntarily dissolve, it should not have completed any trading activity for a period of three months.
Back to table of contents11. Measuring the data
Detailed information on the data sources, quality and methodology of the different indicators included in this bulletin is available in the Coronavirus and the latest indicators of the UK economy and society methodology.
The Opinions and Lifestyle Survey (OPN) is not included in this release and will return next week, while the online price change for high-demand products (HDPs) has been discontinued and will no longer be included. We will expand our range of weekly online price indices to cover a broader selection of food and drink items and will look to start publishing the expanded basket in the coming weeks.
We will summarise any crucial updates to the quality or methodology in this section in the future.
Back to table of contents12. Strengths and limitations
Detailed information on the strengths and limitations of the different indicators included in this bulletin is available in the Coronavirus and the latest indicators of the UK economy and society methodology.
We will summarise any crucial updates or warnings in this section in the future.
Back to table of contents