Table of contents
- Main points
- Business impact of the coronavirus
- Social impacts of the coronavirus on Great Britain
- Company incorporations and voluntary dissolutions
- Value Added Tax (VAT) returns
- Footfall
- Online job adverts
- Online price change for high-demand products (HDPs)
- Energy Performance Certificates
- Shipping
- Data
- Glossary
- Measuring the data
- Strengths and limitations
- Related links
1. Main points
Of businesses currently trading, 29% said that their operating costs exceeded or were equal to their turnover, according to the Business Impact of Coronavirus (COVID-19) Survey (BICS). See Section 2.
The proportion of adults wearing a face covering at some point when leaving the home was at 96% for the second consecutive week, according to the latest Opinions and Lifestyle Survey (OPN). See Section 3.
For the week commencing Saturday 1 August, company incorporations per working day remained above the Quarter 3 (July to Sept) 2019 average, whereas company voluntary dissolutions applications per working day remained below the Quarter 3 2019 average, according to data from Companies House. See Section 4.
In July 2020, there were 18,660 new Value Added Tax (VAT) reporters, a pickup from a subdued April to June 2020, but remaining below the 2015 to 2019 average of 20,908, using the latest HMRC VAT business returns to July 2020. See Section 5.
Overall footfall has risen to two-thirds of its 2019 level when compared with the same day a year ago. See Section 6.
Between 31 July and 7 August 2020, the total volume of online job adverts increased from 53% to 62% of its 2019 average, the largest weekly increase in 2020. See Section 7.
The index for all food items within the high-demand product (HDP) basket remained below its Week 1 level (16 March to 22 March) for the third consecutive week. See Section 8.
In the week commencing 3 August 2020 in England, Energy Performance Certificate (EPC) lodgements for existing dwellings remained around the level observed at the end of February, while lodgements for new dwellings remained 20% lower for a third consecutive week. See Section 9.
Between 3 and 9 August, the average volume of daily ship visits moderately declined to just under 350 daily ships, compared with 388 in the previous week. See Section 10.
The Business Impact of COVID-19 Survey (BICS) is voluntary and currently unweighted, so it may only reflect the characteristics of those who responded. Online price change analysis is experimental and should not be compared with our regular consumer price statistics. Results presented are experimental.
2. Business impact of the coronavirus
This section includes final results from Wave 10 of the Business Impact of Coronavirus (COVID-19) Survey (BICS) for the period 13 July to 26 July 2020, which closed on 9 August 2020. Out of 24,464 businesses sampled, 23% responded. The full results are published in Coronavirus and the economic impacts on the UK: 13 August 2020.
As a user of the Business Impact of Coronavirus (COVID-19) Survey (BICS) data, we would like to hear your thoughts on the future of the survey. If you would like to provide your views, please complete this short questionnaire to help shape the future of BICS. The questionnaire will remain open until 21 August 2020.
Figure 1: Two-fifths of businesses who had furloughed staff provided pay top-ups to the Coronavirus Job Retention Scheme, covering 68% of the furloughed workforce
Headline indicators from the Business Impact of Coronavirus (COVID-19) Survey (BICS), 13 July to 26 July 2020, UK
Embed code
Source: Office for National Statistics – Business Impact of Coronavirus Survey
Notes
- All percentages are a proportion of the number of businesses who responded apart from the workforce percentages on furlough leave and receiving pay top-ups, which are proportions of employees for each responding business.
Of all responding businesses:
- 90% had been trading for more than the last two weeks
- 3% had started trading again within the last two weeks after a pause in trading
- 2% had paused trading but intend to restart trading in the next two weeks
- 4% had paused trading and do not intend to restart in the next two weeks
The headline indicators shown in Figure 1 now include data on the proportion of businesses who intend to close some business sites in the next three months from the point of completing the survey. This shows 6% of businesses who have paused trading, and 3% of businesses currently trading intend to close some sites, representing 3% of businesses overall.
Of the businesses intending to close some sites in the next three months, 68% expect closing these sites to lead to redundancies; 30% expect the workforce to relocate, while 15% expect the workforce to move to remote working. Businesses could select more than one answer to this question.
Of businesses currently trading, 6% of the total workforce had returned to the workplace from furlough in the last two weeks and 4% had moved from remote working to the normal workplace.
Businesses currently trading were asked how their turnover compared with their operating costs, shown in Figure 2.
Figure 2: 29% of businesses currently trading said that their operating costs exceeded or were equal to their turnover
Percentage of businesses currently trading, UK, 13 July to 26 July 2020
Source: Office for National Statistics – Business Impact of Coronavirus (COVID-19) Survey
Notes:
- The percentages in this chart might not sum to 100% due to rounding.
- Turnover and operating cost categories have been combined for presentational purposes, but the breakdown is available in the detailed dataset
Download this chart Figure 2: 29% of businesses currently trading said that their operating costs exceeded or were equal to their turnover
Image .csv .xlsAcross all industries,16% of businesses currently trading said that their operating costs exceeded their turnover and 13% said that they were equal.
The arts, entertainment and recreation industry had the highest proportion of businesses that reported their operating costs exceeded their turnover, at 42%. This was followed by the accommodation and food service activities and private sector education, at 29% and 28% respectively.
The manufacturing and real estate industries had the highest proportion of businesses reporting that their turnover exceeded their operating costs at 54% and 53% respectively.
More detailed data on operating costs and turnover are available in the dataset.
More about coronavirus
4. Company incorporations and voluntary dissolutions
Incorporations
Figure 4: In the week starting Saturday 1 August, there were 3,332 incorporations per working day on average, similar to the last 2 months and above the Quarter 3 2019 average (2,612)
Company incorporations per working day, UK, quarterly and weekly, Quarter 1 2019 to Quarter 2 2020, and w/c 28 February 2020 to w/c 1 August 2020
Source: Companies House and Office for National Statistics
Notes:
- Data presented per working day to allow comparison between quarterly data and weekly data, and account for processing differences associated with bank holidays.
- Quarterly data from Companies House official statistics release, divided by number of working days, presented at the mid-point of the Quarter.
- Weekly data are for week commencing Saturday to Friday, as incorporation requests received on Saturdays and Sundays are typically processed on subsequent weekdays. For more information, see the accompanying Companies House methodology page.
- Please note that Companies House quarterly Official Statistics include figures for Community Interest Company (CIC) incorporations, which are not included in the weekly series. Typically, these account for less than 1% of incorporations.
Download this chart Figure 4: In the week starting Saturday 1 August, there were 3,332 incorporations per working day on average, similar to the last 2 months and above the Quarter 3 2019 average (2,612)
Image .csv .xlsThe observed fluctuations in weekly incorporations per working day (between April to early May 2020 and June to the end of July 2020) coincide with government-instigated lockdown measures and the subsequent easing of them in response to the coronavirus (COVID-19) pandemic. This is in line with official statistics published by Companies House on 30 July 2020.
The latest experimental estimates of new Value Added Tax (VAT) reporters in Section 5 of this release, and Experimental Statistics of business births and deaths from the Inter-Departmental Business Register (IDBR) both suggest business creation remained subdued in Quarter 2 (Apr to June) 2020.
The number of VAT new reporters did increase in July 2020 but remained below the 2015 to 2019 historical average. The difference may be the result of differences in methodology and definition, as some types of company are present with Companies House but not on the IDBR or in VAT returns, such as single-person limited companies. For more details, see the accompanying Companies House methodology page.
Voluntary dissolutions applications
Figure 5: For the week starting Saturday 1 August, there were 904 voluntary dissolutions per working day on average, which remains below the Q3 2019 average (1,008)
Company voluntary dissolutions applications per working day, UK, quarterly and weekly, Quarter 1 2019 to Quarter 2 2020, and w/c 28 February 2020 to w/c 1 August 2020
Source: Companies House and Office for National Statistics
Notes:
- Data presented per working day to allow comparison between quarterly data and weekly data, and account for processing differences associated with bank holidays. Quarterly data are presented at the mid-point of the quarter.
- Weekly data are weeks from Saturday to Friday, as voluntary dissolution requests received on Saturdays and Sundays are typically processed on subsequent weekdays. For more information, see the accompanying Companies House methodology page.
Download this chart Figure 5: For the week starting Saturday 1 August, there were 904 voluntary dissolutions per working day on average, which remains below the Q3 2019 average (1,008)
Image .csv .xlsFor more information on other measures of company closures not presented here, see Weekly indicators of company creations and closures from Companies House methodology: August 2020.
Back to table of contents5. Value Added Tax (VAT) returns
New reporters
The new reporters index measures the number of firms sending VAT returns for the first time, which is related to the number of firm creations.
Figure 6: In July 2020, there were 18,660 new VAT reporters, a pickup from a subdued April to June 2020, but remaining below the 2015 to 2019 average of 20,908
Number of new firm reporters, January 2015 to July 2020, non-seasonally adjusted
Source: HMRC
Download this chart Figure 6: In July 2020, there were 18,660 new VAT reporters, a pickup from a subdued April to June 2020, but remaining below the 2015 to 2019 average of 20,908
Image .csv .xlsTurnover diffusion indices
Turnover diffusion indices are an aggregate measure used to track whether the majority of firms are reporting an increase or decrease in turnover in their VAT returns. They are calculated as the percentage of firms with increasing turnover minus the percentage with decreasing turnover.
The heatmap in Figure 7 is a visual way of showing the VAT diffusion indices based on the standard deviation from their historical 2008 to 2019 average. Larger deviations are more darkly coloured, with red representing negative change, and teal a positive change, when compared with the previous period.
The GDP monthly estimate: June 2020 was published on 12 August 2020. July 2020 estimates of Retail sales in Great Britain will be published on 21 August 2020.
Figure 7: More firms reported increasing turnover between May and June 2020 than decreasing turnover, using the latest VAT business turnover returns
Embed code
Source: HMRC
Notes
- Agri - Agriculture, forestry and fishing, All - All industries, SA - Seasonally adjusted, NSA - Not seasonally adjusted.
- All industries are unweighted: each firm contributing to the index has the same weight regardless of turnover, size or industry.
- The thresholds for the colours in the heatmap are based on standard deviations from the mean of the indicator between 2008 and 2019.
Figure 7 shows that the month-on-month all-industry turnover diffusion index for June 2020 compared with May 2020 was 1.9 standard deviations above its historical 2008 to 2019 average (teal), with a diffusion index of 0.06. Between May and June 2020, out of the 36,970 firms who reported, around 2,200 more firms saw their turnover increase than firms who saw their turnover decrease. This pattern was observed across all major industries (services, production, construction and agriculture).
However, in June 2020, the month-on-year-ago all-industry turnover diffusion index is 1.2 standard deviations below its historical average, with a diffusion index of negative 0.05. This means out of the 36,970 firms who reported, around 1,850 more firms saw their turnover decrease than firms who saw their turnover increase.
Back to table of contents6. Footfall
These figures are provided by Springboard, a provider of data on customer activity. They measure the volume of footfall compared with the same day the previous year at the overall level and across the categories of high streets, retail parks and shopping centres. For example, Tuesday 14 July 2020 was compared with Tuesday 16 July 2019.
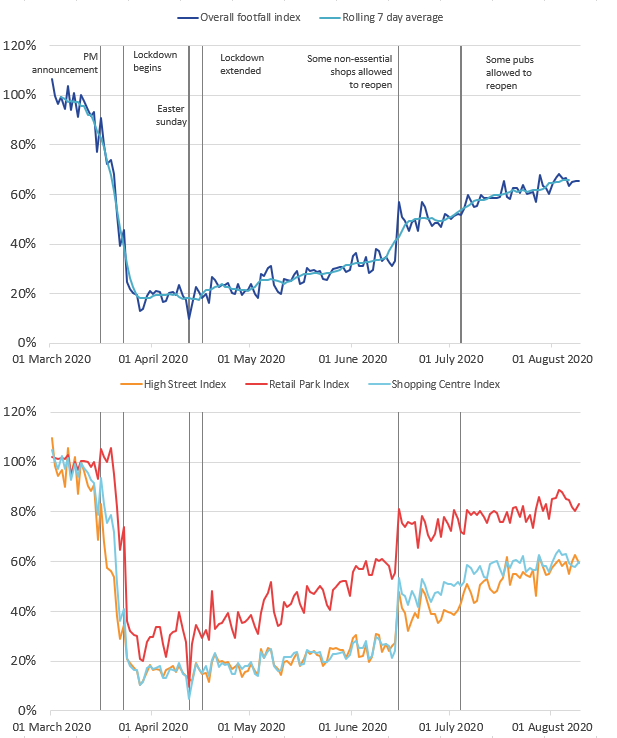
Figure 8 shows the overall footfall seven-day average continued to increase in the week 3 to 9 August 2020, to around two-thirds of the level on the same day a year ago. This continues the gradual increase in footfall seen since the reopening of non-essential shops and businesses in England on 15 June.
Footfall at all locations showed a small increase, retail parks to around 85% of the 2019 level, and shopping centres and high streets to around 60%.
Figure 8: Overall footfall has risen to two-thirds of its 2019 level when compared with the same day a year ago
Volume of footfall, UK, 1 March to 9 August 2020, year-on-year percentage change between footfall on the same day
Source: Springboard and the Department for Business, Energy and Industrial Strategy
Notes:
- Many essential shops were allowed to open on 15 June 2020 in England, 12 June 2020 in Northern Ireland and 22 June in Wales. In Scotland, some non-essential shops were allowed to reopen from 29 June, and more from 13 to 15 July.
- “Prime Minister’s announcement” refers to the advisory announcement on 16 March 2020 to avoid non-essential travel, bars, restaurants and other indoor leisure venues, and to work from home if possible.
- Pubs were allowed to reopen on 4 July in both England and Northern Ireland, with beer gardens allowed to reopen on 6 July in Scotland and 13 July in Wales. Pubs were also allowed to reopen indoors in Scotland on 15 July.
Download this image Figure 8: Overall footfall has risen to two-thirds of its 2019 level when compared with the same day a year ago
.png (92.3 kB)
7. Online job adverts
These figures use job adverts provided by Adzuna, an online job search engine. We are able to include estimates of online job adverts by Adzuna category, and by UK country and NUTS1 regions. These estimates are experimental and will be developed over the coming weeks. The number of job adverts over time is an indicator of the demand for labour.
Figure 9: Between 31 July and 7 August 2020, the total volume of online job adverts increased from 53% to 62% of its 2019 average, the largest weekly increase in 2020
Total weekly job adverts on Adzuna, UK, 4 January 2019 to 7 August 2020: index 2019 average = 100
Embed code
Notes:
- The observations were collected on a roughly weekly basis; however, they were not all observed at the same point in each week, leading to slightly irregular gaps between each observation.
- These series have a small number of missing weeks, mostly in late 2019, and the latest is in January 2020. These values have been imputed using linear interpolation. The data points that have been imputed are clearly marked in the accompanying dataset.
- Further category breakdowns are included in the Online job advert estimates dataset, and more details on the methodology can be found in Using Adzuna data to derive an indicator of weekly vacancies.
Between 31 July and 7 August, the total volume of online job adverts increased substantially to 62% of its 2019 average, from 53% in the previous week. This marks a departure from the previous trend, where online job adverts had remained close to half their 2019 average since the second week of June.
Out of the 29 Adzuna categories, 24 increased compared with the previous week. The category of transport, logistics and warehousing saw the largest increase, rising 46 percentage points to 117% of its 2019 average. This is its fifth consecutive week of growth, starting from a value of just 33% of its 2019 average five weeks ago.
The next largest increase was 31 percentage points, for the category of facilities and maintenance, to 136% of its 2019 average. However, note that some Adzuna categories may have seasonal peaks and troughs for job adverts. Caution should be taken to not solely attribute increases to vacancies to recovery after the easing of social distancing measures.
In contrast, the category with the largest decrease was creative, design, arts and media, which decreased 2.2 percentage points to 41% of its 2019 average. The volume of online job adverts in education remained unchanged at 77% of its 2019 average.
The categories presented here were selected because of user interest, or because they more closely track trends in the Office for National Statistics (ONS) vacancies data. Note that the Adzuna categories used do not correspond to Standard Industrial Classification (SIC) categories, so these values are not directly comparable with the ONS Vacancy Survey.
Figure 10 shows the latest volume of online job adverts in each region compared with the 2019 average, the percentage point change from the 2019 average to the lockdown minimum (which may be a different date for each region), and the percentage point change from the lockdown minimum to the latest value. This week the regional methodology has been enhanced, and more information can be found in the Using Adzuna data to derive an indicator of weekly vacancies: Experimental Statistics methodology note.
Figure 10: Between 31 July and 7 August 2020, the volume of online job adverts increased in every country and NUTS1 region in the UK
Total weekly job adverts on Adzuna, UK, 4 January 2019 to 7 August 2020: index 2019 average = 100, percentage points
Source: Adzuna
Notes:
- Full series for each country and the NUTS1 regions are available in the accompanying dataset.
- There is a level shift in the Northern Ireland series from 7 August 2020 because of a new source of Northern Ireland job adverts being included, therefore the latest week’s increase in Northern Ireland online job adverts should be treated with caution.
Download this chart Figure 10: Between 31 July and 7 August 2020, the volume of online job adverts increased in every country and NUTS1 region in the UK
Image .csv .xlsOn 7 August 2020, out of the UK's countries and NUTS1 regions, online job adverts were closest to their 2019 average in Northern Ireland, the West Midlands, and London, where they were 3%, 27% and 29% below their 2019 averages respectively. Please note the latest week's increase in Northern Ireland should be treated with caution following a change in data source (see Figure 8 notes). Compared with the UK average, the West Midlands and London both saw smaller declines to the lockdown minimum and some of the strongest recoveries to the latest figure.
The blue bars in Figure 10 show the change from the lockdown minimum to the latest value, expressed as percentage points of the 2019 average. The strongest recoveries since each region's lockdown low were in Northern Ireland (53 percentage points) and the East Midlands (31 percentage points). The weakest recoveries in online job adverts were in Yorkshire and The Humber (14 percentage points) followed by the East of England and the South East (both 18 percentage points).
Back to table of contents8. Online price change for high-demand products (HDPs)
A timely indication of weekly price change for high-demand products (HDPs) has been developed, covering the period 16 March to 9 August 2020. A timeline of developments for these indicators can be found in Online price changes of high-demand products methodology. This analysis is experimental and should not be compared with our regular consumer price statistics.
Figure 11: The all HDP basket increased by 0.1% in the latest week driven by an increase in household and hygiene goods, offset by a slight decrease in food
Online price change of high-demand products, UK, percentage change between Week 20 (27 July to 2 August) and Week 21 (3 to 9 August) 2020
Source: Office for National Statistics – Faster indicators
Notes:
- As well as food, and household and hygiene products, the all items index contains items such as pet food and medicines which mean that the all items index sometimes moves differently to the two subseries.
- More information on the strengths and limitations of the online price changes data is available in the Online price changes of high-demand products methodology article.
Download this chart Figure 11: The all HDP basket increased by 0.1% in the latest week driven by an increase in household and hygiene goods, offset by a slight decrease in food
Image .csv .xlsThe index for all household and hygiene goods increased by 0.2% between Week 20 (27 July to 2 August) and Week 21 (3 to 9 August) driven by price increases in several retailers for handwash (1.2%), kitchen rolls (0.6%) and nappies (0.6%). This was offset by a 0.1% decrease in the all food index, mainly caused by decreases in the price of pasta sauce (negative 1.2%), as several retailers had these products on promotion.
Figure 12 shows that the three aggregate indices remain below the starting point of the series (16 March), with the overall index at 1.1 percentage points below the starting point, the all household and hygiene index at 1.7 percentage points below, and the all food index at 1.2 percentage points below. This is the third consecutive week that the food index has been below the Week 1 level in mid-March.
Figure 12: The all food index has remained below its Week 1 level (16 March to 22 March 2020) for the third consecutive week
Online price change of selected high-demand products 16 March to 9 August: index week 1 (16 to 22 March) = 100, UK
Source: Office for National Statistics – Faster indicators
Notes:
- Index movements may not be exactly the same as percentage changes shown in Figure 11 as a result of rounding.
- Week 1 refers to the period 16 to 22 March 2020, and Week 21 refers to the period 3 to 9 August 2020.
- The time series for all individual HDP items are published in a dataset alongside this release.
Download this chart Figure 12: The all food index has remained below its Week 1 level (16 March to 22 March 2020) for the third consecutive week
Image .csv .xls9. Energy Performance Certificates
This release includes weekly Energy Performance Certificates (EPCs) for new and existing domestic properties in England and Wales, split by NUTS1 English regions. The EPCs for domestic properties are published weekly by the Ministry of Housing, Communities and Local Government (MHCLG). As such, they can be used as a timely indicator for the number of completed constructions (new EPCs) and number of transactions (existing EPCs).
Figure 13 shows in the week commencing 3 August 2020, existing EPC lodgements remained similar to the levels observed at the end of February across all regions. EPC lodgements for new dwellings remained around 20% lower for a third consecutive week across England. A reduction in construction would contribute to the slower recovery of EPC assessments of new dwellings. In contrast, in Wales the volume of EPC lodgements for new dwellings was higher than the level observed at the end of February.
Out of the NUTS1 regions, Yorkshire and The Humber is an outlier, with new EPC lodgements around 70% lower than observed at the end of February (the next lowest is the North East, at 24% lower).
Figure 13: In the week commencing 3 August 2020 in England, existing EPC lodgements remained around the level observed at the end of February, while EPC lodgements for new dwellings remained 20% lower for a third consecutive week
Existing and new Energy Performance Certificates lodgements by region, non-seasonally adjusted, February 2020 to August 2020. Percentage change since week commencing 24 February 2020
Embed code
Source: Ministry of Housing, Communities and Local Government (MHCLG) Domestic Energy Performance Certificate Register
Notes:
- Further notes are available in the weekly EPCs for domestic properties dataset (XLS, 53kb).
- More information on the EPC methods, strengths and limitations is available in the accompanying methodology article.
- Week commencing 24 February 2020 is when the time series begins; we will look to expand this in the future.
- Wales shown on a different scale. The spike in the number of EPCs for existing dwellings seen in Wales during the weeks commencing 8 and 15 June 2020 was caused by local authorities in Wales reviewing their social housing stock.
10. Shipping
These shipping indicators are based on counts of all vessels and cargo and tanker vessels. As discussed in Faster indicators of UK economic activity: shipping, we expect the shipping indicators to be related to the import and export of goods.
In this release we have temporarily suspended the passenger daily and weekly visits time series because of quality concerns. We are investigating and hope to reinstate these series in future releases.
Figure 14: Between 3 and 9 August the average volume of daily ship visits moderately declined to just under 350 daily ships, compared with 388 in the previous week
Daily movements in shipping visits, UK, seasonally adjusted, 1 January to 9 August 2020
Source: exactEarth
Download this chart Figure 14: Between 3 and 9 August the average volume of daily ship visits moderately declined to just under 350 daily ships, compared with 388 in the previous week
Image .csv .xls
Figure 15: Between 3 and 9 August, there was an average of 99 daily visits for cargo ships, compared with 95 in the previous week
Daily movements in shipping visits, UK, seasonally adjusted, 1 January to 9 August 2020
Source: exactEarth
Notes:
- The number of visits for Hull are included in these data from 1 June 2020 onwards.
- The seasonally adjusted and trend estimates are estimated using a modified version of the seasonal adjustment method TRAMO-SEATS. More information is available in the Coronavirus and the latest indicators for the UK economy and society methodology
- The seasonal adjustment method may be limited as this is a short time series.
- Daily and weekly shipping visits and unique visits are available by port in the dataset, along with non-seasonally adjusted aggregate series.
Download this chart Figure 15: Between 3 and 9 August, there was an average of 99 daily visits for cargo ships, compared with 95 in the previous week
Image .csv .xls11. Data
Weekly and daily shipping indicators
Dataset | Released 13 August 2020
The weekly and daily shipping indicators dataset associated with the faster indicators of UK economic activity.
Online price changes for high-demand products
Dataset | Released 13 August 2020
Weekly online price changes of selected high-demand products (HDPs).
Online job advert estimates
Dataset | Released 13 August 2020
Experimental job advert indices covering the UK job market.
Economic activity, faster indicators, UK
Dataset | Released 13 August 2020
Data on road traffic and Value Added Tax (VAT) data from HM Revenue and Customs (HMRC).
Business Impact of COVID-19 Survey (BICS) results
Dataset | Released on 13 August 2020
Responses from the new voluntary fortnightly business survey, which captures businesses responses on how their turnover, workforce prices, trade and business resilience have been affected in the two week reference period.
12. Glossary
Diffusion index
The diffusion index tracks the growth in turnover and expenditure of firms. It is constructed to lie between negative one and one and is calculated as the proportion of firms reporting an increase in turnover minus the proportion reporting a decrease. If all firms report an increase in turnover or expenditure in the latest period relative to the base period, the index would be one. For example, if 65% of firms have increasing turnover, 30% have decreasing turnover and 5% turnover remains unchanged, then the diffusion index is 0.35.
Faster indicator
A faster indicator provides insights into economic activity using close-to-real-time big data, administrative data sources, rapid response surveys or Experimental Statistics, which represent useful economic and social concepts.
High-demand product (HDP) basket
The HDP basket contains everyday essential items that were identified at the beginning of the crisis to have high consumer demand, including items from food, health and hygiene categories. The selection of these items was based on anecdotal evidence on patterns of consumer spend. The basket does not cover all items within these categories.
Company incorporations
Incorporations are when a company is added to the Companies House register of limited companies. This can also include where an existing business applies to become a limited company, where it was not one before.
Voluntary dissolutions
A voluntary dissolution is when a company applies to begin dissolution proceedings. As such, they effectively chose to be removed from the Companies House register. For a company to be eligible to voluntarily dissolve, it should not have completed any trading activity for a period of three months.
New reporter
A new reporter is defined as a firm with a Value Added Tax (VAT) reference (that is, firm identification number) which has not previously reported its VAT returns. New reporters are published within one month of the end of the reporting period.
The new reporting behaviour measure is classified by the month the data were received by HMRC, known as the receipt date, which is not necessarily the same as the reference period (the period for which the VAT return is made). For more information please see the methodology article on Value Added Tax returns.
Back to table of contents13. Measuring the data
Detailed information on the data sources, quality and methodology of the different indicators included in this bulletin is available in the Coronavirus and the latest indicators of the UK economy and society methodology.
Detailed information on the enhanced methodology for regional breakdowns of Adzuna job adverts data is available in Using Adzuna data to derive an indicator of weekly vacancies: Experimental Statistics.
We will summarise any crucial updates to the quality or methodology in this section in the future.
Back to table of contents14. Strengths and limitations
Detailed information on the strengths and limitations of the different indicators included in this bulletin is available in the Coronavirus and the latest indicators of the UK economy and society methodology.
We will summarise any crucial updates or warnings in this section in the future.
Back to table of contents
3. Social impacts of the coronavirus on Great Britain
This section includes some headline results from Wave 20 of the Opinions and Lifestyle Survey (OPN) covering the period 5 to 9 August 2020. The full results will be published in Coronavirus and the social impacts on Great Britain on 14 August 2020.
Figure 3 shows that the proportion of adults wearing a face covering in the previous week at some point when leaving the home remained at 96% for the second consecutive week. This follows an increasing trend after face coverings became mandatory on public transport in England on 15 June, in Scotland on 22 June, and in Wales on 27 July. Face coverings became mandatory in shops and other enclosed spaces in Scotland on 10 July, and in England on 24 July.
Further breakdowns, such as the situations when a face covering was worn (for example while shopping) and by the countries of Great Britain, will be available in Coronavirus and the social impacts on Great Britain published on 14 August 2020.
The proportion of adults shopping for necessities including food and medicine increased to 68%, and the proportion shopping for items other than food and medicine increased to 25%. The proportion of people travelling to work increased to 55%, while the proportion working from home exclusively decreased slightly to 23%.
Figure 3: The proportion of adults wearing a face covering at some point when leaving the home was at 96% for the second consecutive week
Proportion of adults, Great Britain, 14 May to 9 August 2020
Source: Office for National Statistics – Opinions and Lifestyle Survey
Notes:
Download this chart Figure 3: The proportion of adults wearing a face covering at some point when leaving the home was at 96% for the second consecutive week
Image .csv .xls