1. Main points
There were 121,147 deaths registered in England in Quarter 4 (Oct to Dec) 2018, which was 1,068 fewer deaths than the five-year average (2013 to 2017) for this quarter.
The age-standardised mortality rate in Quarter 4 2018 was 901 deaths per 100,000 population, which was statistically significantly lower than the Quarter 4 mortality rate for all years since 2001.
The year-end mortality rate for deaths registered from 1 January to 31 December 2018 was 955 deaths per 100,000 population, which is the second-lowest mortality rate observed since 2001.
The mortality rate for deaths with an underlying cause of circulatory diseases was statistically significantly lower than all years since 2001 for males and females aged 75 years and over.
The female over 75 age-standardised mortality rate from dementia and Alzheimer's disease had a statistically significantly higher rate than cancer in 2018 and was second only to circulatory diseases; in contrast, in 2001 it was significantly lower than cancer.
Provisional estimates of life expectancy show small increases for males aged 65 and 75 years between 2017 and 2018 while males at birth and female life expectancy at all ages remained the same.
2. Analysis of mortality in Quarter 4
In Quarter 4 (Oct to Dec) 2018, there were 121,147 deaths registered in England. This was 4,583 fewer deaths than 2017 and 1,068 fewer deaths than the five-year average (2013 to 2017).Of the deaths registered in Quarter 4 2018, the number of male deaths was 60,308 and the number of female deaths was 60,839.
Mortality rates in Quarter 4 2018 were statistically significantly lower than Quarter 4 mortality rates for all years since 2001
Figure 1 shows the age-standardised mortality rates for deaths registered in each Quarter 4 between 2001 and 2018, allowing a comparison of deaths registered in each of the last 18 years in Quarter 4.
Quarter 4 mortality rates have fallen from an initial 1,230 deaths per 100,000 population (1,500 deaths per 100,000 males and 1,043 deaths per 100,000 females) in 2001 to 901 deaths per 100,000 population (1,050 deaths per 100,000 males and 780 deaths per 100,000 females) in 2018. However, while mortality rates have continued to decline this has lessened since 2011. The annual rate of improvement between 2011 and 2018 is only half that observed between 2001 and 2010.
Figure 1: Age-standardised mortality rates by sex, deaths registered in Quarter 4 (October to December) 2001 to 2018, England
Source: Office for National Statistics
Notes:
- Age-standardised mortality rates per 100,000 population, standardised to the 2013 European Standard Population.
- Q4 refers to Quarter 4 (1 October to 31 December).
- Figures are for deaths registered rather than deaths occurring in each period.
- Figures for 2018 are based on provisional mortality data and projected populations.
- Figures exclude non-residents.
Download this chart Figure 1: Age-standardised mortality rates by sex, deaths registered in Quarter 4 (October to December) 2001 to 2018, England
Image .csv .xlsMortality rates statistically significantly decreased in those aged 75 years and over between Quarter 4 2017 and Quarter 4 2018
Figures 2a and 2b show a statistically significant decrease in age-specific mortality rates for males and females across all older age groups when comparing Quarter 4 2017 with Quarter 4 2018. For ages 75 to 89 years, male and female mortality rates in Quarter 4 2018 were statistically significantly lower than all Quarter 4 periods since 2001.
Figure 2a: Age-specific mortality rates, males aged 75 years and over, deaths registered in Quarter 4 (October to December) 2001 to 2018, England
Source: Office for National Statistics
Notes:
- Age-specific mortality rates per 100,000 population.
- Q4 refers to Quarter 4 (1 October to 31 December).
- Figures are for deaths registered rather than deaths occurring in each period.
- Figures for 2018 are based on provisional mortality data and projected populations.
- Figures exclude non-residents.
Download this chart Figure 2a: Age-specific mortality rates, males aged 75 years and over, deaths registered in Quarter 4 (October to December) 2001 to 2018, England
Image .csv .xls
Figure 2b: Age-specific mortality rates, females aged 75 years and over, deaths registered in Quarter 4 (October to December) 2001 to 2018, England
Source: Office for National Statistics
Notes:
- Age-specific mortality rates per 100,000 population.
- Q4 refers to Quarter 4 (1 October to 31 December).
- Figures are for deaths registered rather than deaths occurring in each period.
- Figures for 2018 are based on provisional mortality data and projected populations.
- Figures exclude non-residents.
Download this chart Figure 2b: Age-specific mortality rates, females aged 75 years and over, deaths registered in Quarter 4 (October to December) 2001 to 2018, England
Image .csv .xlsFigure 3 shows, as with the older ages, males aged 0 to 74 years have a higher age-standardised mortality rate than females (386 deaths per 100,000 males and 253 deaths per 100,000 females in Quarter 4 2018 respectively). Mortality rates in Quarter 4 2018 decreased for both males and females aged 0 to 74 years from Quarter 4 2017, however, these decreases were not statistically significant.
While the overall Quarter 4 2018 mortality rate was lower than all Quarter 4 periods since 2001, the rate of improvement observed in those aged 0 to 74 years has not been sustained in recent years. For both males and females, the annual rate of improvement between 2011 and 2018 is only half that observed between 2001 and 2010. More information regarding the slowdown in mortality rates can be found in recent Office for National Statistics (ONS) and Public Health England (PHE) analyses of the mortality trends in England.
Figure 3: Age-standardised mortality rates by sex, ages 0 to 74 years, deaths registered in Quarter 4 (October to December) 2001 to 2018, England
Source: Office for National Statistics
Notes:
- Age-standardised mortality rates per 100,000 population, standardised to the 2013 European Standard Population.
- Q4 refers to Quarter 4 (1 October to 31 December).
- Figures are for deaths registered rather than deaths occurring in each period.
- Figures for 2018 are based on provisional mortality data and projected populations.
- Figures exclude non-residents.
Download this chart Figure 3: Age-standardised mortality rates by sex, ages 0 to 74 years, deaths registered in Quarter 4 (October to December) 2001 to 2018, England
Image .csv .xlsThere were 116,376 death occurrences in Quarter 4 2018 in England
Data reported in this section are based on deaths that occurred between 1 October and 31 December, rather than deaths that were registered in this period (as in the rest of this report). Further information about death occurrences can be found in the Measuring these data section of this report.
There were 116,376 deaths that occurred between 1 October and 31 December 2018 in England, 3,625 fewer deaths than the five-year average (2013 to 2017) for that quarter.
On 1 November 2018, there were 114 more deaths than the five-year average for the same day, with the death count rising well above the maximum number of deaths seen on that day in the preceding five-year period (2013 to 2017). While 1 November was the day with the highest increase in deaths in 2018 when compared with the five-year average for the same day, 31 December had the largest decline in deaths (226 fewer deaths) when compared with the five-year average for the same day. However, this could be a result of registration delays.
The range of death occurrences for Quarter 4 2013 to 2017 refers to the difference between the lowest and highest number of deaths seen on each individual day in Quarter 4 of 2013 to 2017. The number of deaths occurring each day during Quarter 4 2018 was predominately within the range of the number of deaths occurring each day in Quarter 4 during the last five years.
Figure 4: Number of deaths occurring on each day in Quarter 4 (October to December) 2013 to 2018, five-year average and range, England
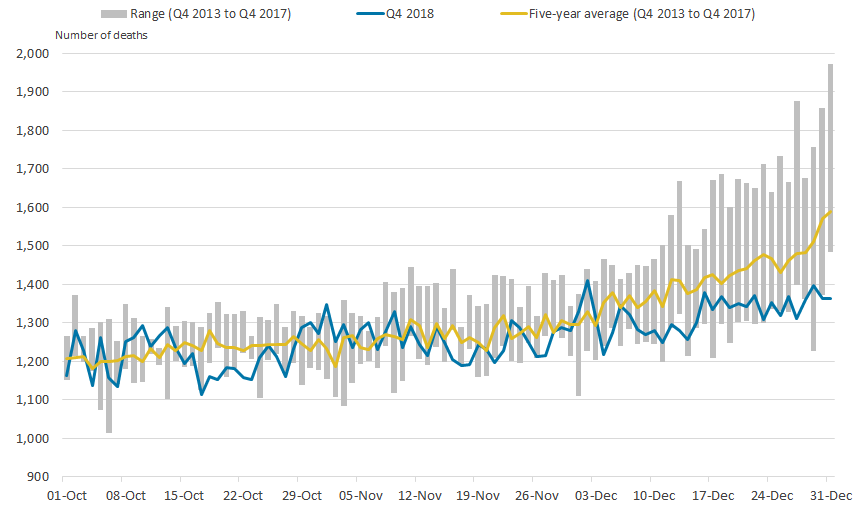
Source: Office for National Statistics
Notes:
- Deaths occurring on each day, which were registered by 28 January of each respective year.
- Q4 refers to Quarter 4 (1 October to 31 December).
- The range is the difference between the minimum and maximum value seen on each day in Quarter 4 in the five-year period from 2013 to 2017.
- Figures exclude non-residents.
Download this image Figure 4: Number of deaths occurring on each day in Quarter 4 (October to December) 2013 to 2018, five-year average and range, England
.png (39.9 kB) .xlsx (12.1 kB)
3. Analysis of mortality in 2018
The overall mortality rate for 2018 was the second-lowest since 2001
To monitor mortality trends, we have calculated year-end mortality figures from the number of deaths registered from 1 January to 31 December for 2001 to 2018.
There were 505,864 deaths registered between 1 January and 31 December 2018, which is the highest number of deaths since 2001. However, the year-end age-standardised mortality rate for 2018 (Figure 5) was 955 deaths per 100,000 population, which was statistically significantly lower than 2001 to 2013 and 2015, but statistically significantly higher than 2014. While the mortality rate for 2018 was lower than 2016 and 2017 it was not statistically significant. The stalling of mortality rates appears to be continuing in 2018 with the improvement in mortality rates being much smaller than the first part of the century.
Figure 5: Age-standardised mortality rates, deaths registered in 2001 to 2018, persons, England
Source: Office for National Statistics
Notes:
- Age-standardised mortality rates per 100,000 population, standardised to the 2013 European Standard Population.
- Figures are for deaths registered rather than deaths occurring in each period.
- Figures for 2018 are based on provisional mortality data and projected populations.
- Figures exclude non-residents.
Download this chart Figure 5: Age-standardised mortality rates, deaths registered in 2001 to 2018, persons, England
Image .csv .xlsStatistically significant decrease in deaths with an underlying cause of circulatory diseases for both males and females aged 75 years and over
From 2017 to 2018, there was a statistically significant decrease in age-standardised mortality rates from circulatory diseases for both males and females aged 75 years and over, with the 2018 mortality rates being statistically significantly lower than all years since 2001 (Figures 6a and 6b). Despite these decreases, the mortality rate for males remains statistically significantly higher than females (2,193 deaths per 100,000 males and 1,624 deaths per 100,000 females).
A statistically significant decrease was also observed in cancer for males aged 75 years and over, with the mortality rate declining from 2,094 deaths per 100,000 in 2017 to 2,043 deaths per 100,000 in 2018. Cancer remains the second-highest cause of death for males whereas for females it is the fourth-highest cause of death. For females, a statistically significant rise was observed in flu and pneumonia between 2017 and 2018; the mortality rate increased from 414 deaths per 100,000 to 432 deaths per 100,000.
There has been a continued rise in dementia and Alzheimer’s disease for females, with the mortality rate in 2018 being statistically significantly higher than all observed years except for 2017, where the increase was not statistically significant.
In 2001, the female mortality rate for dementia and Alzheimer’s disease was statistically significantly lower than cancer; however, in 2018 it was statistically significantly higher than cancer and significantly lower only to circulatory diseases. In contrast the male mortality rate for dementia and Alzheimer’s disease decreased in 2018, following a statistically significant increase between 2016 and 2017, however, this decline was not statistically significant. The observed increases in mortality rates from dementia and Alzheimer’s disease may be related partly to incentives in the health system and the government’s mandate (PDF, 439KB) to diagnosis dementia.
Figure 6a: Age-standardised mortality rates by underlying cause of death, males aged 75 years and over, deaths registered 2001 to 2018, England
Source: Office for National Statistics
Notes:
- Age-standardised mortality rates per 100,000 population, standardised to the 2013 European Standard Population.
- Figures are for deaths registered rather than deaths occurring in each period.
- Figures for 2018 are based on provisional mortality data and projected populations.
- Figures exclude non-residents.
- Changes to the coding of underlying cause of death can have an impact on the number of deaths recorded with a specific underlying cause. Two major coding changes occurred in 2011 and 2014. Comparability ratios have been applied to the number of deaths to account for this impact to allow for a more consistent time trend and can be found in the “Comparability ratios” tab in the accompanying datasets.
Download this chart Figure 6a: Age-standardised mortality rates by underlying cause of death, males aged 75 years and over, deaths registered 2001 to 2018, England
Image .csv .xls
Figure 6b: Age-standardised mortality rates by underlying cause of death, females aged 75 years and over, deaths registered 2001 to 2018, England
Source: Office for National Statistics
Notes:
- Age-standardised mortality rates per 100,000 population, standardised to the 2013 European Standard Population.
- Figures are for deaths registered rather than deaths occurring in each period.
- Figures for 2018 are based on provisional mortality data and projected populations.
- Figures exclude non-residents.
- Changes to the coding of underlying cause of death can have an impact on the number of deaths recorded with a specific underlying cause. Two major coding changes occurred in 2011 and 2014. Comparability ratios have been applied to the number of deaths to account for this impact to allow for a more consistent time trend and can be found in the “Comparability ratios” tab in the accompanying datasets.
Download this chart Figure 6b: Age-standardised mortality rates by underlying cause of death, females aged 75 years and over, deaths registered 2001 to 2018, England
Image .csv .xlsSlowdown in life expectancy for males and females continues in 2018
Provisional 2018 estimates of life expectancy for both males and females at birth remain the same as 2017 (79.6 years for males and 83.2 years for females) and continue to be the highest life expectancy figures in the time series.
For males, provisional life expectancy estimates show a small increase of 0.1 years between 2017 and 2018 for males at ages 65 and 75 years while a small decrease of 0.1 years is shown at age 95 years. Whereas, female life expectancy remained the same as 2017. The lack of change in life expectancy is consistent with recent reports indicating that the slowdown in life expectancy has continued.
The accompanying datasets show life expectancy at birth, age 65, 75, 85 and 95 years, by sex.
Back to table of contents4. Quarterly mortality data
Quarterly data on death registrations and death occurrences in England broken down by sex and age and year-end death registrations broken down by sex, age and cause.
Life expectancy at birth and selected older ages
Annual data on life expectancy at birth and selected older ages in England broken down by sex.
Back to table of contents5. Glossary
Age-standardised mortality rates
Age-standardised mortality rates are used to allow comparisons between populations, which may contain different proportions of people of different ages.
Age-specific mortality rates
Age-specific mortality rates are used to allow comparisons between specified age groups.
Statistical significance
The term “significant” refers to statistically significant changes or differences. Significance is determined by the 95% confidence intervals, where non-overlapping confidence intervals between figures demonstrate that the difference is unlikely to be due to random fluctuation.
Year-end
Year-end is the period covering 1 January to 31 December.
Quarter 4
Quarter 4 is the period covering 1 October to 31 December.
Back to table of contents6. Measuring these data
The purpose of this report is to provide timely surveillance of mortality in England, based on the best available provisional data. This report focuses on Quarter 4 (Oct to Dec) and year-end mortality. Previous quarterly reports are available.
Deaths data sources
This report is based primarily on death registrations, with a section on death occurrences towards the end of the quarterly overview. Death occurrences show the number of deaths that occurred within a calendar period and gives a better indication than registrations of exactly when deaths were at their highest. This allows mortality to be related to other factors such as influenza activity and weather patterns.
A provisional extract of death registrations and death occurrences data for Quarter 4 (1 October to 31 December) 2018 was created on 28 January 2019, roughly four weeks after the end of the reporting period. Death registrations data for 2018 are provisional; however, we would expect only very small changes to total death registration counts once data are made final. Breakdowns by cause of death may also change as some deaths may be registered but not yet coded for cause of death.
Due to registration delays, deaths that occurred during this period may not have been registered by the extraction date. For this reason, the quarterly occurrences data are always somewhat incomplete and we would expect the number of death occurrences in Quarter 4 2018 reported in future articles to be higher than the number reported here.
In addition, because an “artificial” extraction date is used to ensure occurrence data are consistent throughout the time period, if a different artificial extraction date is used in future reports, the number of occurrences reported will be different from the number reported here.
Quarterly populations
We publish the mid-year population estimates used for calculating rates. For 2018, the 2016-based ONS population projections were used.
Calculation of mortality rates for quarterly deaths requires adjustments to be made to annual population estimates to ensure quarterly rates are comparable with annual rates.
We calculate an annual population centred on the mid-point of the quarter using two years’ worth of population estimates or projections. This is then multiplied by the number of days within the quarter as a proportion of the total number of days within that year. The output is used as the population denominator in calculations of age-standardised and age-specific mortality rates:
where m is the number of days from 1 July 2018 (the start of the mid-year for the population estimate) to the midpoint of Quarter 4 inclusive, N is the number of days in Quarter 4 2018 and M is the number of days in 2018 and (i) is the age group.
Early access for quality assurance purposes
We provide early access for quality assurance purposes to a small number of analysts within Public Health England (PHE) and Department of Health and Social Care (DHSC). The analysts are not permitted to share the findings or the report more widely in their organisations. The report is provided for the analysts to provide technical comment on our findings. However, the Office for National Statistics (ONS) itself independently produces these statistics, including determining the focus, content, commentary, illustration and interpretation of these measures presented and the comments provided by PHE and DHSC are purely advisory.
Back to table of contents7. Strengths and limitations
The strengths of the quarterly mortality report include:
- provisional data are used to enable timely analysis to be completed to monitor mortality trends
- mortality data give complete population coverage and ensure the estimates are of high precision and representative of the underlying population at risk
- coding for cause of death is carried out according to the World Health Organisation’s (WHO) International Classification of Diseases ICD-10 and internationally-agreed rules
The limitations of the quarterly mortality report include:
- provisional death registrations and death occurrences data are used, which means the data are subject to change
- quarterly occurrence data are always somewhat incomplete due to registration delays, especially for deaths that occurred towards the end of the quarter
- as “artificial” extraction dates are used to generate death occurrences of previous years, data may be different in future reports for the same time series if different extraction dates are used
Further information can be found in the Mortality statistics Quality and Methodology Information report and the User guide to mortality statistics.
Back to table of contents8. You may also be interested in
Changing trends in mortality in England and Wales: 1990 to 2017 (Experimental Statistics)
Changing trends in mortality: a cross-UK comparison, 1981 to 2016
Changing trends in mortality: an international comparison: 2000 to 2016
Excess winter mortality in England and Wales: 2017 to 2018 (provisional) and 2016 to 2017 (final)
Deaths registered in England and Wales (series DR): 2017
Back to table of contents