Table of contents
- Main points
- Things you need to know about this release
- Mortality rate for deaths registered in Quarter 1 2018 is the highest since 2009 (but not significantly higher than 2015)
- Mortality rates for males and females in the latest period (April 2017 to March 2018) were higher than in the previous period (January to December 2017)
- Mortality rates in people aged 85 years and over continue to rise
- Trends in death occurrences for Quarter 1
- Background information
- Quality and methodology
1. Main points
There were 153,717 deaths registered in England in Quarter 1 (Jan to Mar) 2018, which is higher than Quarter 1 deaths in each of the last five years.
The age-standardised mortality rate for deaths registered in Quarter 1 2018 was 1,187 deaths per 100,000 population – a statistically significant increase of 5% from Quarter 1 2017 and the highest rate since 2009.
The age-standardised rate for Quarter 1 2018 was higher than the Quarter 1 mortality rate in each of the last five years, but not significantly higher than the rate seen in Quarter 1 2015.
The age-standardised rates for both males and females were significantly higher in the latest rolling four-quarter period (April 2017 to March 2018) compared with the previous period; as is normally the case, the mortality rate was higher in males than in females (1,122 and 841 deaths per 100,000 population respectively).
Mortality rates in men and women aged 85 to 89 years and 90 years and over continued to rise in the latest rolling four-quarter period (April 2017 to March 2018).
More deaths occurred on almost every day in Quarter 1 2018 compared with the five-year average, in fact, most individual days saw more deaths than the corresponding day in any of the previous five years; this is probably due to a combination of influenza and several uncharacteristically cold spells during February and March.
2. Things you need to know about this release
The purpose of this report is to provide timely surveillance of mortality in England. This report serves as a snapshot of deaths that were registered within the most recent quarter using the best available data. Through comparative analyses with previous quarters and with the use of rolling four-quarter (annual) totals, it shows patterns of change in mortality; specifically, whether mortality has increased, remained stable or decreased.
This report includes data up to and including Quarter 1 2018, which covers the period 1 January to 31 March 2018. In addition to reporting on deaths that were registered in Quarter 1, we also report quarterly rolling four-quarter death counts and mortality rates that encompass all quarters of the year. The most recent rolling four-quarter period is Quarter 2 2017 to Quarter 1 2018 (April 2017 to March 2018).
In keeping with previous editions of this report, this edition will be based primarily on death registrations, with a section on death occurrences towards the end of the report. Death occurrences show the number of deaths that occurred within a reference period and give a better indication of exactly when deaths were at their highest. This allows mortality to be related to other factors such as influenza activity and weather patterns. We can only know when a death occurred once it has been registered. So, due to registration delays, death occurrences data are always incomplete, especially towards the end of the quarter.
A provisional extract of death registrations and death occurrences data for Quarter 1 (1 January to 31 March) 2018 was created on 30 April 2018, roughly four weeks after the end of the reporting period. Data for 2017 were also re-extracted on this date, so will differ from data presented in earlier reports, as a small number of deaths that were registered in 2017 were not entered onto our mortality database until after the previous 2017 extract was taken. Death registrations data for 2017 and 2018 are provisional; however, we would expect only small changes to total death registration counts once data are made final. Breakdowns by cause of death may also change as some deaths may be registered, but not yet fully coded for cause of death.
The quarterly populations used in the rate calculations here are adjusted using a combination of mid-year population estimates (2001 to 2016) and population projections (2017 and 2018) to estimate what the likely population would have been at the mid-point of the quarter. More detail is provided in the Background information at the end of this report.
The statistics reported here are Experimental Statistics and allow us to demonstrate to users some of the analyses possible in the future and to seek feedback to inform the future presentation of timely mortality data. We welcome feedback from users on this report at mortality@ons.gov.uk.
This publication was produced with support from Public Health England and Department of Health and Social Care.
Back to table of contents3. Mortality rate for deaths registered in Quarter 1 2018 is the highest since 2009 (but not significantly higher than 2015)
To assess how mortality for deaths registered in Quarter 1 (Jan to Mar) 2018 compares with earlier years, Figure 1 shows the age-standardised mortality rate for deaths that were registered in each quarter 1 from 2001 to 2018. The age-standardised rate accounts for changes in the size and age structure of the population over time.
The mortality rate for deaths registered in Quarter 1 2018 was 1,187 deaths per 100,000 population – a 5% increase from 2017 and the highest rate since 2009. Between 2001 and 2014, Quarter 1 mortality rates were generally falling, reaching a low of 1,017 deaths per 100,000 in 2014. Rates have fluctuated since then, but remained higher than in 2014; and 2018 is the second year in a row with a statistically significant increase, meaning the rate is now similar to Quarter 1 2015.
Figure 1: Age-standardised mortality rate, deaths registered in Quarter 1 (Jan to Mar), 2001 to 2018
Persons, England
Source: Office for National Statistics
Notes:
Age-standardised mortality rates per 100,000 population, standardised to the 2013 European Standard Population.
Figures exclude non-residents.
Q1 refers to Quarter 1 (1 Jan to 31 Mar).
Figures are for deaths registered, rather than deaths occurring in each period.
Figures for 2017 and 2018 are based on provisional mortality data and projected populations.
Download this chart Figure 1: Age-standardised mortality rate, deaths registered in Quarter 1 (Jan to Mar), 2001 to 2018
Image .csv .xlsTable 1a presents the number of deaths registered in each quarter 1 since 2013, together with a five-year average (2013 to 2017). The excess deaths column compares the number of deaths registered in 2018 with each of these earlier periods. There were 153,717 deaths registered in Quarter 1 2018, which is more than in each of the last five years and 18,145 more deaths than the five-year average.
Table 1a: Number of observed deaths and excess deaths registered in Quarter 1 (Jan to Mar) 2013 to 2018 and the five-year average, England
| Year | Number of deaths | Excess deaths in Q1 2018 |
|---|---|---|
| Five-year average (2013-17) | 135,572 | 18,145 |
| 2013 | 132,409 | 21,308 |
| 2014 | 123,068 | 30,649 |
| 2015 | 145,570 | 8,147 |
| 2016 | 132,728 | 20,989 |
| 2017 | 144,087 | 9,630 |
| 2018 | 153,717 | n/a |
| Source: Office for National Statistics | ||
| Notes: | ||
| 1. Excess deaths shown are the difference between the number of deaths in 2018 and each respective year. So, for example, there were 9,630 more deaths in Q1 2018 compared with Q1 2017. | ||
| 2. Q1 refers to Quarter 1 (1 Jan to 31 Mar). | ||
| 3. Figures are for deaths registered, rather than deaths occurring in each period. | ||
| 4. Figures for 2017 and 2018 are based on provisional mortality data. | ||
| 5. Average (mean) for the preceding five years, ie 2013 to 2017. | ||
| 6. Figures exclude non-residents. | ||
Download this table Table 1a: Number of observed deaths and excess deaths registered in Quarter 1 (Jan to Mar) 2013 to 2018 and the five-year average, England
.xls (28.2 kB)Since the population increases in size each year and, in particular, because the number of elderly people is increasing, we would expect there to be more deaths each year, even if age-specific death rates remained unchanged.
To account for the effect of these population changes, we have calculated an expected number of deaths. We apply the age-specific mortality rates of each earlier period (Quarter 1 2013 to 2017) to the Quarter 1 2018 population and obtain expected numbers of deaths in 2018 based on the mortality rates for each earlier year (Table 1b). We then compare the actual number of deaths in 2018 with the expected number. This is shown as excess deaths in Table 1b and gives the number of additional deaths in 2018 that can be attributed to the changed mortality rates, rather than to the changed population structure.
Table 1b shows that there were 153,717 observed deaths in Quarter 1 2018; and had the mortality rate in Quarter 1 2018 been the same as the Quarter 1 2013 to 2017 average rate, we would have expected 142,946 deaths. If these average mortality rates had continued, we would have expected to see 10,771 fewer deaths in Quarter 1 2018 than were actually registered. That is, the number of deaths registered in Quarter 1 2018 was around 8% higher than expected (based on the average mortality rate between 2013 and 2017). However, it was very similar to the expected deaths we’d see based on the 2015 mortality rate. This pattern corresponds with the trends in age-standardised rates shown in Figure 1.
Table 1b: Number of deaths expected in Quarter 1 (Jan to Mar), 2013 to 2018 and the five-year average, England
| Year | Expected deaths | Excess deaths in Q1 2018 |
|---|---|---|
| Five-year average (2013-17) | 142,946 | 10,771 |
| 2013 | 145,602 | 8,115 |
| 2014 | 132,317 | 21,400 |
| 2015 | 153,609 | 108 |
| 2016 | 136,315 | 17,402 |
| 2017 | 146,593 | 7,124 |
| 2018 | 153,717 | n/a |
| Source: Office for National Statistics | ||
| Notes: | ||
| 1. Expected deaths are calculated by applying age specific mortality rates for each period to the Q1 2018 population. | ||
| 2. Excess deaths shown for each year are the difference between the number of expected deaths in 2018 and each respective year. So, for example, there were 7,124 more deaths in 2018 than we would have expected had the 2017 mortality rates continued. | ||
| 3. Q1 refers to Quarter 1 (1 Jan to 31 Mar). | ||
| 4. Figures are for deaths registered, rather than deaths occurring in each period. | ||
| 5. Mortality data for 2017 and 2018 is provisional; population projections were used for 2017 and 2018. | ||
| 6. Average (mean) for the preceding five years, ie 2013 to 2017. | ||
| 7. Figures exclude non-residents. | ||
Download this table Table 1b: Number of deaths expected in Quarter 1 (Jan to Mar), 2013 to 2018 and the five-year average, England
.xls (28.7 kB)4. Mortality rates for males and females in the latest period (April 2017 to March 2018) were higher than in the previous period (January to December 2017)
Figure 2 shows the age-standardised mortality rate per 100,000 population, for males and females, for deaths registered in each rolling four-quarter period since 2001. The number of deaths registered in this period can be found in the accompanying datasets.
There were 250,262 male deaths registered in the four-quarter period ending Quarter 1 2018 (1 April 2017 and 31 March 2018). This is the highest number of deaths in any four-quarter period since 2001, this report’s earliest comparison period. However, the number of deaths is strongly influenced by the increasing size and changing age structure of the population since 2001. The age-standardised rate gives a more robust picture of trends over time, as this accounts for changes in the population.
Males had an age-standardised rate of 1,122 deaths per 100,000 population in the four-quarter period ending March 2018. Figure 2 shows that this is significantly higher than the previous four-quarter period (by 1.3%); but is significantly lower than the rates prevailing in the four rolling four-quarter periods between April 2014 and December 2015.
Despite having higher numbers of deaths than males, females consistently have lower age-standardised mortality rates, as there are more females than males in the population, especially at older ages. There were 258,301 female deaths registered in the latest four-quarter period ending March 2018. This is the highest number of female deaths since the four-quarter period ending September 2004, when there were 258,558 female deaths.
The female age-standardised rate was 841 deaths per 100,000 population in the latest four-quarter period ending March 2018. Figure 2 shows that male and female mortality rates have similar trends over time: the female rate in the latest rolling four-quarter period is significantly higher than in the previous four-quarter period (by 1.5%), but is significantly lower than prevailing rates between April 2014 and December 2015.
Since the beginning of the 21st Century, male mortality rates showed a declining trend from a peak of 1,493 deaths per 100,000 population in the four-quarter period ending December 2001 (the earliest period covered by this report) to a low of 1,089 deaths per 100,000 in the period ending June 2014.
Female rates showed a very similar trend. They peaked at 1,049 deaths per 100,000 in the period ending December 2003, then declined to a low of 796 deaths per 100,000 in the period ending June 2014. Since then, both male and female mortality rates have increased, but have been relatively stable since June 2015. More details can be found in a recent ONS analysis of the changing mortality trends.
Figure 2: Age-standardised mortality rates, by sex, deaths registered in each rolling four-quarter period from January 2001 to March 2018
England
Source: Office for National Statistics
Notes:
Age-standardised mortality rates per 100,000 population, standardised to the 2013 European Standard Population.
Figures exclude non-residents.
Figures are for rolling four-quarter periods: Quarter 1 to Quarter 4 is 1 Jan to 31 Dec; Quarter 2 to Quarter 1 is 1 Apr to 31 Mar; Quarter 3 to Quarter 2 is 1 July to 30 June; Quarter 4 to Quarter 3 is 1 Oct to 30 Sept.
Figures are for deaths registered, rather than deaths occurring in each period.
Figures for 2017 and 2018 are based on provisional mortality data and projected populations.
Download this chart Figure 2: Age-standardised mortality rates, by sex, deaths registered in each rolling four-quarter period from January 2001 to March 2018
Image .csv .xls5. Mortality rates in people aged 85 years and over continue to rise
In both males and females, mortality increased with age and the highest age-specific mortality rate was observed in people aged 90 years and over. Mortality rates in this age group tend to be quite volatile over time, especially in females. This volatility is partly because many people in this age group are very frail and so are vulnerable to factors that vary a lot from one year to the next, such as influenza outbreaks or very cold or hot weather.
Figures 3a and 3b show that in the first part of the 21st Century, mortality rates were generally declining in both males and females in all older age groups (aged 75 years and over). The lowest mortality rates since 2001 occurred in the four-quarter period ending June 2014 for males and females in most age groups (75 years and over), except for males aged 80 to 84 years, where the lowest rate was observed in the period ending December 2017.
Since then trends have differed by age. For males and females aged 75 to 79 and 80 to 84 years, mortality rates in the latest rolling four-quarter period (ending March 2018) have not noticeably improved since the low seen in the period ending Quarter 2 (Apr to June) 2014.
Mortality rates for males and females aged 85 to 89 years and 90 years and over have all increased significantly in the latest rolling four-quarter period, compared with the trough seen in the period ending Quarter 2 2014. In addition, the latest mortality rates in these older age groups (85 to 89 years and 90 years and over) are all higher than the rates seen in the previous rolling four-quarter period (ending December 2017) – though this is not a statistically significant difference in males aged 90 years and over.
Figure 3a: Age-specific mortality rates, deaths registered in each rolling four-quarter period from January 2001 to March 2018
Males aged 75 years and over, England
Source: Office for National Statistics
Notes:
Age specific mortality rates per 100,000 population.
Figures exclude non-residents.
Figures are for rolling four-quarter periods: Quarter 1 to Quarter 4 is 1 Jan to 31 Dec; Quarter 2 to Quarter 1 is 1 Apr to 31 Mar; Quarter 3 to Quarter 2 is 1 July to 30 June; Quarter 4 to Quarter 3 is 1 Oct to 30 Sept.
Figures are for deaths registered, rather than deaths occurring in each period.
Figures for 2017 and 2018 are based on provisional mortality data and projected populations.
Download this chart Figure 3a: Age-specific mortality rates, deaths registered in each rolling four-quarter period from January 2001 to March 2018
Image .csv .xls
Figure 3b: Age-specific mortality rates, deaths registered in each rolling four-quarter period from January 2001 to March 2018
Females aged 75 years and over, England
Source: Office for National Statistics
Notes:
Age specific mortality rates per 100,000 population.
Figures exclude non-residents.
Figures are for rolling four-quarter periods: Quarter 1 to Quarter 4 is 1 January to 31 December; Quarter 2 to Quarter 1 is 1 April to 31 March; Quarter 3 to Quarter 2 is 1 July to 30 June; Quarter 4 to Quarter 3 is 1 October to 30 September.
Figures are for deaths registered, rather than deaths occurring in each period.
Figures for 2017 and 2018 are based on provisional mortality data and projected populations.
Download this chart Figure 3b: Age-specific mortality rates, deaths registered in each rolling four-quarter period from January 2001 to March 2018
Image .csv .xlsThe age-standardised mortality rate for males and females aged under 75 years is much lower than for people aged 75 years and over. As with the older ages, males aged 0 to 74 years have a higher mortality rate than females (402 deaths per 100,000 for males and 260 for females). The rates in the latest rolling four-quarter period (April 2017 to March 2018) were similar to the previous period for both males and females.
The trends over time are somewhat different in this younger age group, compared with people aged 75 years and over. Figure 3c clearly illustrates that for people aged under 75 years, the mortality rate has declined since 2001. For males, the lowest rate was in the four-quarter period ending September 2017. The lowest female rate occurred one quarter later – in the period ending December 2017. These low points occur later than for people aged 75 years and over, which mostly reached their lowest rate in the period ending June 2014 and then began to increase.
Figure 3c shows the rate of improvement in the mortality rate for under 75s has slowed since the early 2010s for both sexes. It is too early to tell whether the small increase in the mortality rates seen in the latest rolling four-quarter period is the start of an upward trend. More details can be found in a recent ONS analysis of the changing mortality trends.
Figure 3c: Age-standardised mortality rates, by sex, deaths registered in each rolling four-quarter period from January 2001 to March 2018
Ages 0 to 74 years, England
Source: Office for National Statistics
Notes:
Age-standardised mortality rates per 100,000 population, standardised to the 2013 European Standard Population.
Figures exclude non-residents.
Figures are for rolling four-quarter periods: Quarter 1 to Quarter 4 is 1 Jan to 31 Dec; Quarter 2 to Quarter 1 is 1 Apr to 31 Mar; Quarter 3 to Quarter 2 is 1 July to 30 June; Quarter 4 to Quarter 3 is 1 Oct to 30 Sept.
Figures are for deaths registered, rather than deaths occurring in each period.
Figures for 2017 and 2018 are based on provisional mortality data and projected populations.
Download this chart Figure 3c: Age-standardised mortality rates, by sex, deaths registered in each rolling four-quarter period from January 2001 to March 2018
Image .csv .xlsSingle year of age mortality rates for deaths registered in Quarter 1 (Jan to Mar) for those aged 75 years and over can be found in the accompanying datasets. Caution must be used when interpreting these rates given birth cohort effects following World War 1.
All mortality rates from the charts contained in this report, together with 95% confidence intervals and the number of deaths can be found in the datasets accompanying this release.
Back to table of contents6. Trends in death occurrences for Quarter 1
Data reported in this section are based on deaths that occurred between 1 January and 31 March, rather than deaths that were registered in this period (as in the rest of the report). To ensure comparability between years, deaths that occurred in Quarter 1 (Jan to Mar) were only included if they were registered by 30 April in the same year. For example, we have included deaths that occurred between January and March 2013, which were registered on or before 30 April 2013. Further information about registration delays can be found in Impact of registration delays on mortality statistics and also in the Background information section of this report.
From 1 January to 31 March 2018, there were 143,149 death occurrences in England, which was more than in each of the last five years (Table 2). Compared with the average of the previous five years (2013 to 2017), an additional 15,544 deaths occurred in Quarter 1 2018. This is 12% higher than the five-year average. It is important to note that during this time the population has increased, which will explain some of this increase.
Data based on registrations and occurrences tend to show a similar pattern. Both show that the number of deaths in Quarter 1 2018 was higher than each of the last five years. On average, deaths in Quarter 1 2018 were around 12% to 13% higher than the five-year average, depending on whether we look at registrations or occurrences.
Table 2: Number of observed deaths and excess deaths occurring in Quarter 1 (Jan to Mar) 2013 to 2018 and the five-year average, England
| Year | Number of deaths | Excess deaths in Q1 2018 |
|---|---|---|
| Five-year average (2013-17) | 127,605 | 15,544 |
| 2013 | 127,605 | 15,856 |
| 2014 | 114,923 | 28,226 |
| 2015 | 136,409 | 6,740 |
| 2016 | 127,520 | 15,629 |
| 2017 | 131,880 | 11,269 |
| 2018 | 143,149 | n/a |
| Source: Office for National Statistics | ||
| Notes: | ||
| 1. Data for deaths occurring in Quarter 1 (1 Jan to 31 Mar) in each year, and registered by 30 April of each respective year. | ||
| 2. Excess deaths shown are the difference between the number of deaths in 2018 and each respective year. So, for example, there were 11,269 more deaths in Q1 2018 compared with Q1 2017. | ||
| 3. Average (mean) for the preceding five years, ie 2013 to 2017. | ||
| 4. Figures exclude non-residents. | ||
Download this table Table 2: Number of observed deaths and excess deaths occurring in Quarter 1 (Jan to Mar) 2013 to 2018 and the five-year average, England
.xls (35.8 kB)There were more deaths on almost every day in Quarter 1 2018 compared with the five-year average – only 25 March had fewer deaths (Figure 4). During January to March 2018, almost two thirds (63%) of the days had more deaths than the maximum seen in the previous five years – though this pattern did vary throughout the quarter.
Between 1 and 14 January, deaths were relatively high in 2018, but not as high as in 2015. In contrast, from 15 to 27 January and 13 February to 16 March, deaths were particularly high in 2018. Deaths were regularly above the maximum seen in the previous five years during Quarter 1 2018, due partly to increases in the size of the population since 2013. However, population change is unlikely to be the only reason for the higher number of deaths occurring in Quarter 1 2018.
Increased winter deaths can often be related to the level of seasonal influenza circulating in the population, the particular flu strain that is most prevalent in that winter and the effectiveness, and uptake, of the seasonal flu vaccination. Public Health England’s Weekly national influenza reports indicate that the influenza-like illness (ILI) GP consultation rate peaked at 54.1 per 100,000 in week 3 (January 2018). However, influenza activity remained at medium levels throughout the whole of January and February 2018. More information on Seasonal influenza is available from Public Health England.
In addition, increased winter deaths can sometimes be related to cold weather, though the relationship between mortality and temperature is less clear. It is interesting to note that Met Office data shows that both February and March 2018 were colder than average (February was 2.0 degrees Celsius colder than the five-year average and March was 1.4 degrees Celsius colder), with a particularly cold snap occurring between 22 February and 3 March. Figure 4 shows deaths began to climb well above the five-year average during this cold spell and remained high for almost two weeks after temperatures began to rise.
More detailed analysis of the relationship between flu, temperature and deaths during the winter of 2017/18 will be published in our annual excess winter mortality report in November 2018.
Figure 4: Number of deaths occurring on each day in Quarter 1 (Jan to Mar), 2013 to 2018, five-year average and range
All ages, England
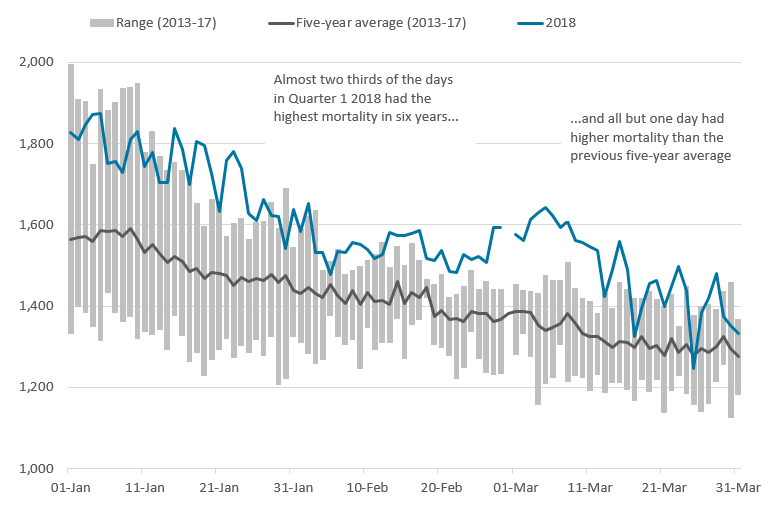
Source: Office for National Statistics
Notes:
Deaths occurring on each day, which were registered by 30 April of each respective year.
Q1 refers to Quarter 1 (1 January to 31 March).
Figures exclude non-residents.
Average (mean) for the preceding five years, ie 2013 to 2017.
The range is the difference between the minimum and maximum value seen on each day in Quarter 1 in the five-year period from 2013 to 2017.
As 2018 is not a leap year, there is no figure for 29 February, causing a break in the 2018 data line.
Download this image Figure 4: Number of deaths occurring on each day in Quarter 1 (Jan to Mar), 2013 to 2018, five-year average and range
.png (51.8 kB) .xlsx (13.5 kB)
7. Background information
Deaths data sources
Provisional extracts of death registrations and death occurrences data for Quarter 1 (1 January to 31 March) 2018 were created on 30 April 2018, roughly four weeks after the end of the reporting period. Some deaths that occurred during this period would not have been registered by 30 April (this is known as a registration delay). So, for this reason, we would expect the number of death occurrences in Quarter 1 2018 reported in future articles to be higher than the number reported here.
In addition, because an “artificial” extraction date is used to ensure occurrence data are consistent throughout the time period, if a different artificial extraction date is used in future reports, the number of occurrences reported will be different from the number reported here.
In a small number of cases there can also be a delay between when a death is registered and when it is entered onto the Office for National Statistics (ONS) mortality database. Therefore, provisional registration data for 2017 and 2018 will change slightly in subsequent reports. Registrations data for years prior to 2017 are final and will not change.
Impact of registration delays on occurrence data
In England, deaths should be registered within five days of the death occurring, but there are some circumstances that result in the registration of the death being delayed. Deaths considered unexpected, accidental or suspicious will be referred to a coroner who may order a post mortem or carry out a full inquest to ascertain the reasons for the death. The time taken for a coroner to investigate the circumstances of the death often means that a death is registered more than five days after it occurred and this is referred to as a registration delay.
While delays are often only a few days, registration delays can extend into years, particularly for deaths from external causes (accidents or violence) when inquests are held. We are only aware of a death and able to include it in the statistics once it has been registered.
Deaths of young people tend to have longer registration delays because external causes of death are more common in these ages. However, in general, deaths at such ages are relatively rare and make up only a small percentage of all deaths.
Registration delays mean that death occurrence data are technically never complete, as a handful of new deaths may be registered years after they occurred. Occurrence data become gradually more complete over time – so the most recent 2018 occurrence data will be the most incomplete.
Where death occurrences have been used in this report, deaths for previous years have been extracted using a similar “artificial” extraction date as the 2018 occurrences data. That is, we included deaths that occurred in each year and were registered by 30 April of the same year (this is about four weeks after the end of the period). This aims to ensure that all the occurrence data are similarly incomplete, thus minimising the impact of registration delays and allowing comparability across years. In subsequent reports, a different artificial extraction date will be used, meaning the number of deaths occurring in each period will change for all years.
Expected deaths methodology
For each respective year, single year of age mortality rates were calculated. These age-specific mortality rates were then applied to the population of the latest quarter to calculate the number of expected deaths at each age, for each respective year. These were then summed to calculate the total number of expected deaths in each period. From this we can calculate excess deaths in the latest quarter compared with earlier years.
Quarterly population denominators
We publish the mid-year population estimates used for calculating rates. For 2017 and 2018, the 2016-based ONS population projections were used.
Single year of age populations for the oldest ages (90 years to 100 years and over) for 2002 to 2016 were taken from the Mid-year population estimates of the very old publication. For 2001, the Population estimates for ages 90 years and over were used and for 2017 and 2018 the 2016-based ONS population projections were used.
Calculation of mortality rates for quarterly deaths requires adjustments to be made to annual population estimates to ensure quarterly rates are comparable with annual rates.
We calculate an annual population centred on the mid-point of the quarter using two years’ worth of population estimates or projections. This is then multiplied by the number of days within the quarter as a proportion of the total number of days within that year. The output is used as the population denominator in calculations of age-standardised and age-specific mortality rates:
where m is the number of days from 1 July 2017 (the start of the mid-year for the population estimate) to the midpoint of Quarter 1 inclusive, N is the number of days in Quarter 1 2018 and M is the number of days in 2018 and (i) is the age group.
This method is very similar to that used to calculate population denominators for quarterly conception rates.
Back to table of contents8. Quality and methodology
The Mortality Statistics Quality and Methodology Information report contains important information on:
the strengths and limitations of the data and how it compares with related data
uses and users of the data
how the output was created
the quality of the output including the accuracy of the data
The User guide to mortality statistics is also a useful resource to help users understand Office for National Statistics (ONS) mortality statistics and includes more detailed information on cause of death coding and the impact on mortality statistics
Back to table of contents