1. Main points
These estimates are experimental, using a methodology detailed in ‘New nowcasting methods for more timely quarterly estimates of UK total public service productivity’, and based on Quarterly National Accounts data.
In 2015, year-on-year productivity for total public services is estimated to have fallen by 0.2% as year-on-year input growth (1.5%) exceeded output growth of 1.4%, leading to a drop in the ratio of output to inputs.
Public service productivity increased by 0.9% in 2014 year-on-year, with the output and inputs of total public services growing by 2.3% and 1.4% respectively.
Since 2009, total public service productivity has increased, on average, by 0.6% per year.
In Quarter 1 (Jan to Mar) 2016, productivity for total public services increased by 0.2% relative to the previous quarter and was 0.3% higher than in Quarter 1 2015.
These estimates use a greater degree of estimation and a different methodology so as to deliver more timely estimates, compared to our previously published annual public service productivity figures, which are published with a two year lag. The 2014 estimates will be updated later in the year when the data becomes available to feed into the established methodology.
Back to table of contents2. Understanding public service productivity
Productivity of public services is estimated by comparing growth in total output with growth in total inputs used. Productivity will increase when more output is being produced for each unit of input. Estimates of output, inputs and productivity are given both as growth rates between consecutive periods, and as indices that show the cumulative trend over time.
Estimated growth rates of output and inputs for individual public services are aggregated by their relative share of total expenditure on public services (expenditure weight) to produce estimates of total public service output, inputs and productivity.
Inputs are composed of expenditure on labour, goods and services, and of consumption of fixed capital. They are adjusted for inflation using suitable deflators. Expenditure data used to estimate inputs' growth are taken from the Quarterly National Accounts (QNA).
The QNA provides estimates of government output as chain volume measures as part of the estimate for general government final consumption expenditure (GGFCE). The QNA published volume series of total GGFCE is taken as the volume of output for quarterly public service productivity.
Further information on quality and methodology can be found in the Quality and Methodology Information paper, which describes the intended uses of the statistics presented in this release, their quality and a summary of the methods used to produce them.
Back to table of contents3. About quarterly public service productivity
We produce annual estimates of total public service productivity and breakdowns of specific areas including healthcare, education and adult social care. These annual estimates are produced with a 2-year lag, which reduces their value in public sector planning.
This article introduces new experimental estimates for quarterly total public service productivity, inputs and output to provide a short-term, timely indicator of the future path of the annual productivity estimates. New nowcasting methods for more timely quarterly estimates of UK total public service productivity gives information on the methodology and data sources behind the new quarterly estimates.
Further research is being conducted into improving the experimental quarterly productivity estimates, including accounting for changes in service quality where we have, for now, assumed the quality of services provided remains constant throughout the nowcasted period. These statistics are still in a state of early development and we welcome comments on the methods and results presented in this article.
Back to table of contents4. Interpreting these statistics
This release reports total public service productivity estimates up to Quarter 1 (Jan to Mar) of 2016. Estimates are presented in annual growth rates up until 2015 and on quarter-on-quarter growth up to Quarter 1 2016.
Annual estimates are taken from annualised quarterly data and are comparable to the existing annual series over the period 1997 to 2013, both showing a broadly similar trend of rising productivity in the latest period. Differences between the annual and quarterly “nowcast” public service productivity estimates are a result of differences in the estimates of output and inputs. Details of these can be found in New nowcasting methods for more timely quarterly estimates of UK total public service productivity.
This methodology article highlights caveats and methods for producing the quarter-on-quarter growth estimates and should be referenced when reporting on specific quarterly movements. This is especially the case for the latest quarters, which are more liable to be subject to revisions.
Back to table of contents5. Annual public service productivity
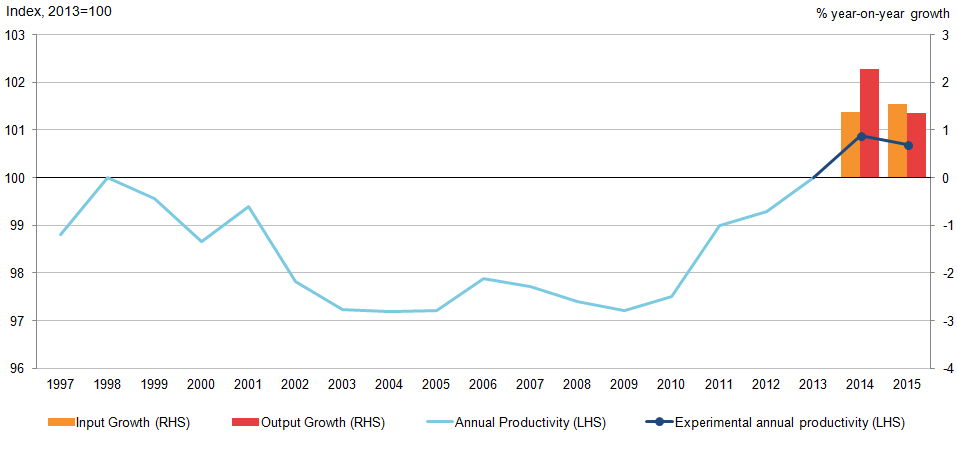
In 2015, total public service productivity is estimated to have fallen by 0.2%, as inputs grew by 1.5% and exceeded output growth of 1.4%. This followed a productivity increase of 0.9% in 2014, with the output and inputs of total public services growing by 2.3% and 1.4% respectively.
Figure 1 shows the annual total public service productivity series, with growth from 2014 and 2015 taken from the nowcast quarterly series. The experimental estimates suggest that, while experiencing a slight contraction in the latest period, for the last 6 years productivity of the UK public services has been on an upwards trend. Since 2009, total public service productivity is estimated to have increased by 3.6% or an annual average of 0.6% growth. As a result, total public service productivity after 2013 has exceeded its peak in 1998 – following falling and constant productivity during the 2000's.
Figure 1: Total UK Public Service annual Productivity with quarterly constructed estimate, 1997 to 2015
Source: Office for National Statistics
Notes:
- Estimates for 2014 and 2015 reflect growth rates of the annualised quarterly total public service productivity applied to the quality adjusted annual total public service productivity.
Download this image Figure 1: Total UK Public Service annual Productivity with quarterly constructed estimate, 1997 to 2015
.png (18.4 kB) .xlsx (10.7 kB)
Further analysis on annual total public service productivity prior to 2013, including the contribution of individual services, can found in Public service productivity estimates: total public service, 2013.
Back to table of contents6. Quarterly public service productivity
Looking at the quarterly path, shown in Figure 2, productivity was on a slight upwards trend from the start of 2011 until the end of 2014. Since then, productivity has been lower than the Quarter 4 (Oct to Dec) 2014 peak. In Quarter 1 (Jan to Mar) 2016, total public service productivity rose by 0.2% relative to the previous quarter. This followed on from a 0.1% increase in Quarter 4 2015 and a 0.1% decrease in Quarter 3 (July to Sept) 2015.
Figure 2: Quarterly total UK public service productivity, Quarter 1 (Jan to Mar) 2011 to Quarter 1 2016, seasonally adjusted
Source: Office for National Statistics
Notes:
- All estimates are based on experimental quarterly total public service productivity
Download this chart Figure 2: Quarterly total UK public service productivity, Quarter 1 (Jan to Mar) 2011 to Quarter 1 2016, seasonally adjusted
Image .csv .xlsBreaking down the productivity estimate into the underlying changes in inputs and output of total public services, Figure 3 shows that the latest rise in quarterly productivity was driven by a 0.5% increase in output, albeit partially offset by growth in inputs – inputs increasing by 0.2% in Quarter 1 2016.
Figure 3: Quarterly total UK public service inputs and output, Quarter 1 (Jan to Mar) 2011 to Quarter 1 2016, seasonally adjusted

Source: Office for National Statistics
Notes:
- All estimates are based on experimental quarterly total public service productivity.
- Estimates are directly seasonally adjusted.
Download this image Figure 3: Quarterly total UK public service inputs and output, Quarter 1 (Jan to Mar) 2011 to Quarter 1 2016, seasonally adjusted
.png (32.7 kB) .xlsx (11.4 kB)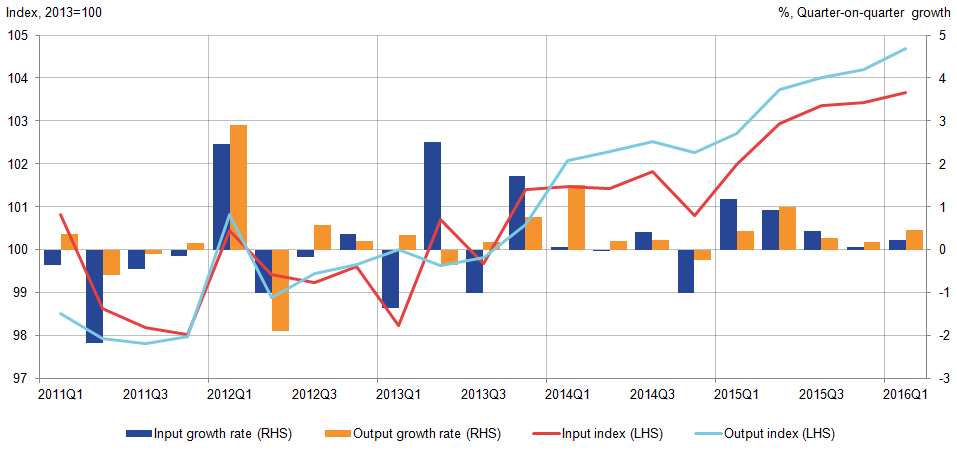
Figure 3 also suggests that while inputs into total public services have been generally increasing since Quarter 1 (Jan to Mar) 2011 (0.1 % per quarter) output has, in general, been experiencing a slightly stronger trend (0.3% per quarter) leading to growth in total public service productivity.
Trends in quarterly total public service output, inputs and productivity estimates are mostly determined by services where quarterly data are readily available, for example, health care. A large proportion of activity data used to estimate the volume of output are annual data. This has subsequently been converted to a quarterly series – split evenly among the 4 quarters – reducing the impact these components have on volatility.
Further information on data sources for quarterly total public service productivity can be found in the Quality and Methodology Information paper and in New nowcasting methods for more timely quarterly estimates of UK total public service productivity.
Back to table of contents7. Future developments
This article presents proposed experimental quarterly total public service productivity, inputs and output series, aiming to provide a more timely indicator of the likely trend in the existing annual series. These estimates are based on sources different from those used to estimate annual total public service productivity. The sources used here contain smaller degrees of detail and involve a degree of estimation. As a result, they are not proposed replacements for previous figures and are intended as estimates for the more recent period. We aim to assess the impact of these differences and to address issues such as quality adjustment, direct measures, the treatment of annual data, and the geographical and service level breakdown in future work.
Feedback on the use of these estimates and suggestions for improvements will be essential for the future development of timely estimates for public service productivity. All feedback is welcome and can be sent to fred.foxton@ons.gov.uk.
Back to table of contents