1. Background
In the Labour Force Survey (LFS) respondents are interviewed for five consecutive quarters over a 12- month period, with 20% of the sample being replaced at each quarter. This allows for a longitudinal dataset to be created over a limited time interval, where respondents’ characteristics can be tracked over their time in the survey.
We publish population-weighted longitudinal datasets for each calendar quarter. These are available for each quarter since 1997 and can be used to analyse changes in labour market characteristics over two or five quarters. The datasets include "flow" variables, which estimate the size of the movements between the three main labour market statuses of employment, unemployment and economic inactivity.
Monitoring changes in the labour market status of respondents to the LFS aids the understanding of the quarterly changes in the levels of employment, unemployment and economic inactivity. These indicators are published as stocks for a given period, with changes expressed as the difference between successive quarters. These quarterly comparisons represent the net changes between the three labour market statuses. The underlying gross flows are usually considerably larger and may not correspond with those implied by the net changes. Estimates of the gross flows between the statuses can be derived from the LFS longitudinal datasets and are summarised in this note.
Back to table of contents2. Method
There are two types of Labour Force Survey (LFS) longitudinal datasets: two-quarter and five-quarter. These are weighted using the same population estimates as those used in the main quarterly LFS datasets, although the weighting methodology differs (see Section 9: Technical note). Consequently the estimates are broadly consistent with the published aggregates, but not entirely. Also, the datasets are limited to people aged 16 to 64 years.
Both types of dataset contain a flow variable with 11 categories, with all combinations of employment, unemployment and economic inactivity accounted for, plus two categories for those entering and leaving the 16 to 64 years population over the quarter. For the purpose of this analysis, those entering or leaving this population are excluded from the measured sample. The stock of the employed, unemployed and inactive at each quarter can therefore be estimated by summing the corresponding flow categories.
For this analysis, the two-quarter datasets have been used in order to gain some insight into the quarterly changes in the headline published aggregates.
Back to table of contents3. The charts provided
The charts in this article show the estimated gross flows, that is, the total inflow or outflow of people aged 16 to 64 years for employment, unemployment and inactivity from one calendar quarter to the next. They are seasonally adjusted. Analysis of the net flows, that is, the difference between the total inflow and outflow, are also included and these are compared with the quarterly changes in the published aggregates, partly to give an indication of the robustness of the flows analysis.
Back to table of contents4. Main points for Quarter 3 (July to Sep) 2018
The gross flow to unemployment has had the biggest quarterly increase since July to September 2008.
The gross flow from unemployment has decreased to its lowest since the start of the series (October to December 2001).
Gross flow from employment has increased for a second consecutive quarter to its highest since July to September 2016.
The flow from inactivity to unemployment has had the biggest quarterly increase since October to December 2016.
5. Quarterly gross flows
Figure 1 shows the gross flow between each economic status between Quarter 2 (Apr to June) 2018 and Quarter 3 (July to Sept) 2018. The stocks for each status represent the latter period and are the seasonally adjusted aggregates for people aged 16 to 64 years.
Figure 1: Quarterly flows, UK, seasonally adjusted
April to June 2018 to July to September 2018

Source: Office for National Statistics
Download this image Figure 1: Quarterly flows, UK, seasonally adjusted
.png (35.7 kB)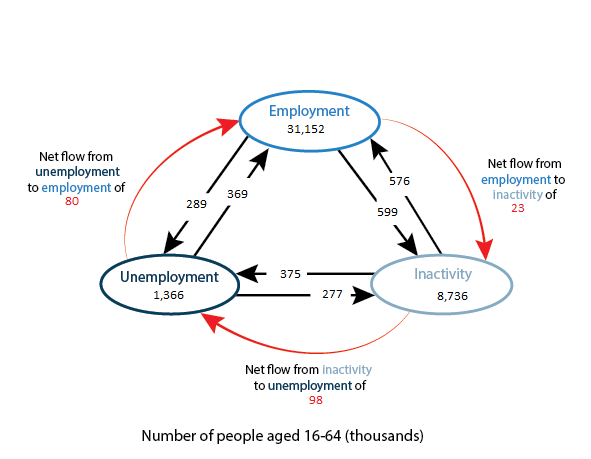
6. Unemployment
Figure 2 shows both the flows from employment and inactivity to unemployment have increased. This has caused the biggest increase to the gross flow to unemployment since July to September 2008.
Figure 2: Inflow to unemployment, seasonally adjusted (aged 16 to 64 years), UK
July to September 2013 to July to September 2018
Source: Office for National Statistics
Download this chart Figure 2: Inflow to unemployment, seasonally adjusted (aged 16 to 64 years), UK
Image .csv .xlsFigure 3 shows the gross flow from unemployment has decreased to its lowest since the start of the series (October to December 2001). This is driven by decreases in both the flows from unemployment to employment and inactivity.
Figure 3: Outflow from unemployment, seasonally adjusted (aged 16 to 64 years), UK
July to September 2013 to July to September 2018
Source: Office for National Statistics
Download this chart Figure 3: Outflow from unemployment, seasonally adjusted (aged 16 to 64 years), UK
Image .csv .xlsFigure 4 shows the net flow for unemployment and change in stock both increased on the quarter after two consecutive quarterly decreases.
Figure 4: Unemployment: net flow vs change in stock, seasonally adjusted (aged 16 to 64 years), UK
July to September 2013 to July to September 2018
Source: Office for National Statistics
Download this chart Figure 4: Unemployment: net flow vs change in stock, seasonally adjusted (aged 16 to 64 years), UK
Image .csv .xls7. Employment
Figure 5 shows the gross flow to employment has increased on the quarter. This is due to an increase in the flow from inactivity.
Figure 5: Inflow to employment, seasonally adjusted (aged 16 to 64 years), UK
July to September 2013 to July to September 2018
Source: Office for National Statistics
Download this chart Figure 5: Inflow to employment, seasonally adjusted (aged 16 to 64 years), UK
Image .csv .xlsGross flow from employment has increased for a second consecutive quarter to its highest since July to September 2016 (Figure 6). This is driven by increases in both the flow from employment to unemployment and inactivity.
Figure 6: Outflow from employment, seasonally adjusted (aged 16 to 64 years), UK
July to September 2013 to July to September 2018
Source: Office for National Statistics
Download this chart Figure 6: Outflow from employment, seasonally adjusted (aged 16 to 64 years), UK
Image .csv .xlsFigure 7 shows that the job-to-job flow rate has increased for a second consecutive quarter.
Figure 7: Job-to-job flow rate, seasonally adjusted (aged 16 to 69 years), UK
July to September 2004 to July to September 2018
Source: Office for National Statistics
Download this chart Figure 7: Job-to-job flow rate, seasonally adjusted (aged 16 to 69 years), UK
Image .csv .xlsFigure 8 shows that the quarterly change in stock decreased for a second consecutive quarter and became negative, while the net flow for employment is relatively stable on the quarter.
Figure 8: Employment: net flows vs change in stock, seasonally adjusted (aged 16 to 64 years), UK
July to September 2013 to July to September 2018
Source: Office for National Statistics
Download this chart Figure 8: Employment: net flows vs change in stock, seasonally adjusted (aged 16 to 64 years), UK
Image .csv .xls8. Inactivity
The gross flow to inactivity shows a small decrease on the quarter driven by a decrease in the flow from unemployment to inactivity (Figure 9).
Figure 9: Inflow to inactivity, seasonally adjusted (aged 16 to 64 years), UK
July to September 2013 to July to September 2018
Source: Office for National Statistics
Download this chart Figure 9: Inflow to inactivity, seasonally adjusted (aged 16 to 64 years), UK
Image .csv .xlsThe flow from inactivity to unemployment has had the biggest increase since October to December 2016. This, together with an increase in the flow from inactivity to employment, has led to an increase in the gross flow from inactivity (Figure 10).
Figure 10: Outflow from inactivity, seasonally adjusted (aged 16 to 64 years), UK
July to September 2013 to July to September 2018
Source: Office for National Statistics
Download this chart Figure 10: Outflow from inactivity, seasonally adjusted (aged 16 to 64 years), UK
Image .csv .xlsThe inactivity net flow and quarterly change in stock have both decreased on the quarter, with the net flow returning to a negative value (Figure 11).
Figure 11: Inactivity: net flow vs change in stock, seasonally adjusted (aged 16 to 64 years), UK
July to September 2013 to July to September 2018
Source: Office for National Statistics
Download this chart Figure 11: Inactivity: net flow vs change in stock, seasonally adjusted (aged 16 to 64 years), UK
Image .csv .xls9. Technical note
There are differences between the data used for the published Labour Force Survey (LFS) aggregate estimates and the longitudinal data used to estimate the gross flows.
Flows are currently adjusted for non-response bias through special calibration weights in the longitudinal datasets. These aim to account for the propensity of certain types of people to drop out of the LFS between one quarter and the next. For example, housing tenure features in the weighting of the longitudinal data because, historically, households in rented accommodation have been more likely to drop out of the survey than owner-occupiers.
There is some evidence that the longitudinal datasets are affected slightly by response error, which causes a slight upward bias in the estimates of the gross flows. For example, if it was erroneously reported that someone had moved from unemployment to employment then, in addition to the outflow from unemployment being overestimated, so would the inflow to employment. In the main quarterly LFS dataset, any such misreporting errors tend to cancel each other out.
The differences in the net flows for inactivity shown in Figure 11 are mainly the result of excluding the entrants to, and leavers from, the population in the flows estimates contained in this piece of analysis. This effect is normally one that increases the number of people who enter inactivity. This is because the increase in inactivity from those people turning 16-years-old is greater than those leaving inactivity due to becoming 65-years-old.
The stocks derived from the longitudinal datasets differ from those obtained from the quarterly LFS datasets due to being based on a subset of the main LFS sample. The restriction to measuring only those who are commonly aged 16 to 64 years across successive quarters discounts those entering or leaving the population and also those over 64 years. All such people are accounted for in the headline LFS aggregates.
Back to table of contents10. References
Jenkins J and Chandler M (2010) Labour market gross flows data from the Labour Force Survey (PDF, 145KB) Economic and Labour Market Review, February 2010.
Back to table of contents