Table of contents
1. Main points
London and the West Midlands had the strongest economic growth in real terms during the economic recovery from 2010 to 2016, while Northern Ireland and regions in the north of England have had the slowest growth. This differs from the decade prior to the economic downturn (1998 to 2007) when London and Northern Ireland had the highest growth and West Midlands the lowest.
Economic growth in the decade prior to the economic downturn was dominated by knowledge-intensive service sectors. Growth in manufacturing sectors was low during this period. In the post-economic downturn period (2010 to 2016), growth continued to be high in high-tech and market-knowledge intensive services. There were also improved growth rates in the low-tech, medium-low-tech and medium-high-tech manufacturing sectors and in the less knowledge-intensive market sector.
Gross value added (GVA) growth for 40 Nomenclature of Units for Territorial Statistics (NUTS2) subregions is examined in the report for the pre- and post-economic downturn periods by type of industry. The analysis brings to light how some areas have had different economic performance during these two periods. For example, medium-high tech manufacturing in the West Midlands NUTS2 area declined by an average 3% per year from 1998 to 2007 but grew by 9% per year from 2010 to 2016, helping to drive the improved GVA growth in the wider region.
Many of the fastest-growing subregions since 2010 have been relatively more specialised, or have seen their specialisation increase, compared with other subregions. This specialisation is typically in either knowledge-intensive services or medium-high tech manufacturing.
To investigate which subregions specialise in particular types of industry, location quotients have been calculated for the 40 NUTS2 subregions, including changes over time since 1998. As an example, the data show that the Outer London South subregion has been getting relatively less specialised in both knowledge-intensive service sectors and medium- to high-tech manufacturing, while becoming more specialised in the real estate sector.
A final analysis used a type of shift share approach (known as multi-factor partitioning). This allows growth in an area to be analysed in terms of a national effect, an industry-mix effect and a regional effect. For example, it shows that from 2010 to 2016, in the Herefordshire, Worcestershire and Warwickshire subregion, both the region and industry-mix effects were positive. This reflects that the subregion has had an industry structure aligned to faster-growing UK industries over this period and has also outperformed the growth levels that would have been expected given this structure.
Back to table of contents2. Things you need to know about this release
Our latest annual estimates of regional and subregional economic output were published in December 2017. For the first time, these estimates included data presented in "real" terms in chained volume measures, with the effect of inflation removed. These estimates are available for the 12 Nomenclature of Units for Territorial Statistics NUTS1 regions and 40 NUTS2 subregions of the UK. Furthermore, data were provided with additional industry detail, with an 80-industry breakdown for NUTS1 regions and a 71-industry breakdown for NUTS2 subregions.
These newly released data increase the opportunities to analyse regional economic growth in the UK since 1998. This article therefore seeks to utilise these new data to provide additional insight into how economic growth has differed across the UK and analyses the impact on regional growth of industrial sectors based on the level of technology (for manufacturing) and the level of knowledge intensity (for services).
A number of analytical tools and techniques are used in the article to describe how the industry composition of the NUTS2 subregions has changed over time and its impact on growth. This includes the Krugman specialisation index, location quotients and a modified shift-share analysis. Brief details of each of these are provided in the following sections. Data are also available to view in the accompanying dataset, allowing closer examination of the results for each subregion. To be able to keep the regional totals consistent, the various measures were computed using nominal GVA estimates.
Industry aggregation
Analysis in this article is based on an aggregated industry structure classification that combines the two-digit level industries breakdown of the 2007 Standard Industrial Classification (SIC) into 11 groups according to their technological or knowledge intensity (see Appendix). Manufacturing sectors were aggregated according to technological intensity (research and development expenditure or value added) and based on the Statistical classification of economic activities in the European Community (NACE) at two-digit level. The level of research and development (R&D) intensity served as a criterion of classification of economic sectors into high, medium-high, medium-low and low technology industries. Services were mainly aggregated into knowledge-intensive services (KIS) and less knowledge-intensive services (LKIS) based on the share of tertiary-educated persons at NACE two-digit level. For more information visit the Eurostat website.
Real gross value added for industry groups
To calculate real GVA for the 11 industry groups, weighted deflators were applied to the aggregation of the published GVA in current prices.
Not all two-digit level industries contributed the same amount of GVA to the industry group. For this reason, the published implied deflators for each two-digit level industry were weighted, using the amount of output it contributes to the industry group total. This weighted average ensures that the real GVA reflects the relative importance of the various two-digit level industries in the group.
Krugman specialisation index
There are a vast number of indicators that can be used to measure an area’s degree of specialisation and compare it with other areas. These measures of specialisation quantify the differences between the distribution of economic activity (employment, value added) across regions observed from the data and a reference distribution.
The choice of the reference distribution is determined by what is considered to represent no specialisation, which can be a uniform distribution of industries (absolute measures) or the industry structure of a reference group of areas (relative measures). With absolute measures of specialisation an area is considered as being specialised if a small number of industries exhibit high shares of the overall economic activity of the country. With relative measures of specialisation, an area is considered to be specialised if its industry structure differs from the average industry structure of the reference group of areas (which can be the country).
This article uses a measure of relative specialisation, the Krugman specialisation index (KSI), to compare sectoral specialisation across NUTS2 subregions of the UK. The index is defined as follows:
where Xji is the output of region (j) in industry (i), Xj is the total output of region (j), Xi is the total output of industry (i) and X is the national output.
The KSI takes value zero if region (j) has an industrial structure identical to the rest of the UK, indicating that region (j) is not specialised. Higher KSI values indicate increased specialisation or deviation away from the UK norm. The KSI takes a maximum value of 2 if it has no sectors in common with the rest of the UK, reflecting strong sectoral specialisation. The indicator can only be seen as a relative specialisation compared with a benchmark, which here is the UK; no absolute degree of specialisation can be assessed with this measure.
Location quotients
The location quotients are a simple and very common measure used to assess relative specialisation of regions in a specific industry. The location quotient for region (j) industry (i) measures the level of relative specialisation of region (j) in industry (i), and it is given by the expression:
where Xji is the output of region (j) in industry (i), Xj is the total output of region (j), Xi is the total output of industry (i) and X is the national output. A location quotient of 1 indicates that the share of industry (i) in the regional output is comparable with the contribution of that industry to the national output. In this article, the location quotients were calculated for the NUTS2 subregions of the UK, the 11-industry aggregation breakdown described above. A location quotient greater than 1.25 indicates a high level of relative specialisation of subregion (j) in industry (i), and location quotients below 0.75 indicate a low level of specialisation.
Multi-factor partitioning model (MFP)
This article adopts the MFP approach to analyse changes in regional output, considering the distribution of industries in each region. The MFP was developed by Ray (1990) and Lamarche and others (2003) and considered as an important theoretical development of the traditional shift-share analysis, as it corrects the conceptual errors in the mathematical formulation of the traditional shift-share. The shift-share model is a decomposition technique widely used in regional studies to determine what portions of regional economic growth or decline can be attributed to national, economic industry and regional factors.
In the traditional version, regional economic growth is decomposed into three components: a national component, an industry-mix effect and the residual component. The national component is the change in a region that would have occurred if the region had grown at the national rate. It measures the effects of macroeconomic fluctuations on change. The industry-mix measures the change that occurs if all industries in each region had grown at the national industry rate (conditional on the national share effect). A region with a concentration of fast-growth industries will show in the data a positive industry-mix effect. And, the residual component is the difference between the actual change in the region and the sum of the other two components. It is designed to capture regional characteristics such as externalities arising from agglomeration effects, local labour characteristics, the presence of other sophisticated inputs, such as superior suppliers, local policy environment, and so on. The residual component is often referred to as regional competitiveness effect.
Two main flaws of the traditional shift-share model have been identified in the literature. One flaw has to do with the choice of weights. In the static version of the model, the level of the output (or any other variable of choice) in the first period is used to weight each component for the entire period of analysis. This means that changes in industry structure of the area are not considered. The second flaw derives from the use of crude regional growth rates that creates a problem of interwoven effects. The model acknowledges that regional growth is affected by the industry-mix in each region, but fails to account for the effect that regional distribution of industries has on the national industry growth rates.
The MFP uses standardised regional growth rates for industry-mix effects and standardised industry growth rates for their regional-mix effects, allowing the decomposition of regional growth into two components that are not dependent on each other. In this article, a dynamic version of the MFP is used, allowing both the growth rates and industry-mixes to vary over time, and therefore solve the problem of using static weights. The MFP components are defined according to the following equation:
where Xjt is output in region (j) at time (t), gj is the crude region growth rate, gn is the crude national growth rate and g ̂in is the standardised industry growth rate.
Back to table of contents3. Results
Results: Regional growth
During the decade prior to the 2008 to 2009 economic downturn, the UK’s real output was growing at an average annual growth rate of 2.8%. Over that period, while most of the regions had an increase of around 24% (UK average), London’s output grew by almost 45% and the West Midlands by no more than 18%. The observed increasing growth disparities across the UK regions started raising concerns over the high dependence of the UK economy on the economic growth of the high-tech and knowledge-intensive market and financial services in London and its neighbouring regions.
The economic downturn in 2008 had a substantially uneven impact across the UK, not only in terms of output loss but more importantly in terms of growth in the years that followed. While some regions were back to pre-economic downturn levels of output as early as 2010, other regions took longer to recover. Latest gross value added (GVA) data shows that, in 2016, most of the regions were at least 6% above pre-economic downturn levels, with London and the South East pulling further ahead and the North East, Yorkshire and The Humber and Northern Ireland lagging behind.
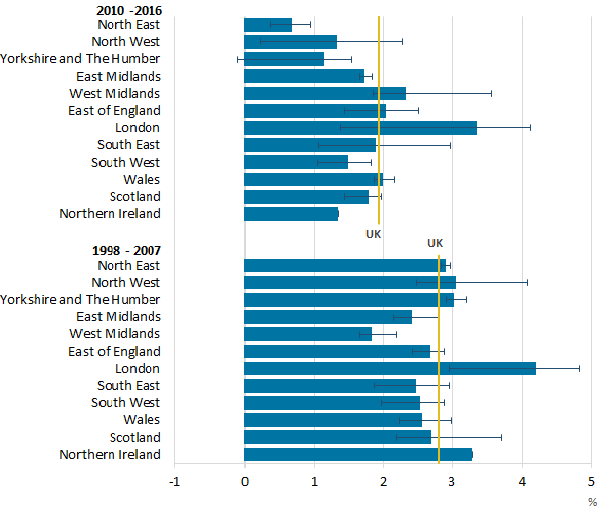
Figure 1 compares the regional average annual growth rate in the pre-economic downturn period with that of the post-economic downturn period. Three main features stand out. Firstly, at national level, the average annual growth rate dropped from of 2.8% to 1.9%. The slower growth of the UK economy is a result of a sustained stagnation of labour productivity since the economic downturn, only partly compensated by an increase in the level of labour input (hours worked and employment).
Secondly, there was a turnaround in the average annual growth differential of the northern regions of England and Northern Ireland relative to the national rate. These regions grew at an average annual growth rate above national average for most of the pre-economic downturn decade but have had the lowest growth in the post-economic downturn period. By contrast, West Midlands had above-average growth during 2010 to 2016, having had the lowest growth rate in the period from 1998 to 2007.
Figure 1: Annual growth rates of real gross value added by NUTS1 regions, UK, 1998 to 2007 and 2010 to 2016
Source: Office for National Statistics
Notes:
The horizontal lines for each NUTS1 region show the range of growth rates for the NUTS2 subregions.
As well as being a NUTS1 area, Northern Ireland also has the status of a NUTS2 area, therefore there is no range for Northern Ireland.
Download this image Figure 1: Annual growth rates of real gross value added by NUTS1 regions, UK, 1998 to 2007 and 2010 to 2016
.png (18.0 kB) .xls (57.3 kB)
The third feature that stands out from Figure 1 is the increase in the gap in the intraregional growth rates (the range of growth rates for NUTS2 areas within each region is shown by the lines in Figure 1). In the post-economic downturn period, this is most evident in the North West, London and in the South East regions, where some subregions experienced average rates above national average while other subregions grew much slower than the UK average for the period. The differences between growth in the subregions in West Midlands and in Yorkshire and The Humber region is also particularly noticeable.
Figure 2 compares the average annual growth rate of the 40 NUTS2 subregions in the pre-economic downturn and post-economic downturn periods and how they relate to the UK average. The top-right quadrant shows the regions that grew at above the national average in both the pre- and post-economic downturn period. The bottom-left quadrant shows the regions that grew at below the national average in both periods.
Figure 2: Annual growth rates of real gross value added by NUTS2 regions, UK, 1998 to 2007 and 2010 to 2016
Embed code
By grouping the subregions this way, a number of features emerge. Firstly, the output growth perfomance of most of the London NUTS2 subregions exceeded the national growth rate in both periods, but not in the case of Outer London – South, which experienced an average growth rate of almost 1 percentage point below the UK average since the economic downturn.
Secondly, it is clear that only a small number of areas were able to keep above national average growth in both periods (top-right quadrant). Most of the areas growing above or close to the UK average in the pre-economic downturn period fared poorly in the post-economic downturn period (shown in the top-left quadrant). This applies foremost to North East, North West and Yorkshire and The Humber NUTS2 subregions.
Some areas experienced an improvement in their relative growth performance (when compared with the national average) as well as an absolute increase in the average annual growth rate between the two periods. This is true for all the NUTS2 subregions in West Midlands; in particular for Herefordshire, Worcestershire and Warwickshire, which was the fastest growing NUTS2 subregion outside of London from 2010 to 2016.
Note that this article does not focus on the impact of productivity on relative growth rates. However, Figure 13 in the recent Regional and sub-regional productivity in the UK publication showed that, in common with the national picture, most NUTS2 subregions had relatively little change in productivity levels between 2011 and 2016. Instead, changes in relative growth levels generally reflected differences in the levels of labour inputs (that is, hours worked or employment levels) over this period. In other words, differences in growth of hours worked and employment across subregions were responsible for the different output growth levels rather than any significant changes to relative productivity levels.
Results: Regional growth by industry
The UK economy has been through a great structural change for the past five decades, characterised by a relative decline of the manufacturing sector and an increasing share of the service sector in the national output. Just in the decade prior to the economic downturn, the share of manufacturing in national (nominal) output went from 16% down to 10%. Since the economic downturn, however, there has been little change in the relative contribution of the manufacturing and the services industries to the national nominal output.
Figure 3 shows that most of the manufacturing industries grew at a higher rate in the post-downturn period compared with the decade to 2007, except for the high-technology manufacturing. Real output growth in high-technology manufacturing was close to 2% in between 1998 and 2007 but negative between 2010 and 2016. Simultaneously, there was a slowdown of the annual growth rate of all the knowledge-intensive types of services, in particular the high-tech and financial services.
Figure 3: Annual growth rates of real gross value added by industry groups, UK, 1998 to 2007 and 2010 to 2016

Source: Office for National Statistics
Notes:
These data use approximate real gross value added (GVA), therefore the UK average growth rate is not the same as the real GVA growth rate.
To calculate approximate real GVA for the 11 industry groups, weighted deflators were applied to the aggregation of the published GVA in current prices. Not all two-digit level industries contributed the same amount of GVA to the industry group. For this reason, the published implied deflators for each two-digit level industry were weighted, using the amount of output the two-digit level industry contributed to the industry group total. This weighted average ensures that the approximate real GVA reflects the relative importance of the various two-digit level industries in the group.
Download this image Figure 3: Annual growth rates of real gross value added by industry groups, UK, 1998 to 2007 and 2010 to 2016
.png (22.3 kB) .xls (57.9 kB)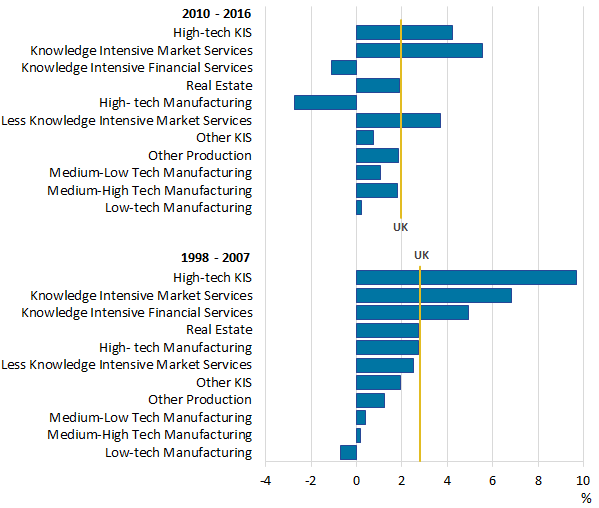
Most NUTS2 subregions have seen a relative decline in the manufacturing sector and an increase in the share of the service sector in the national output between 1998 and 2007, in particular in the high-tech and knowledge-intensive services. Meanwhile, only the London NUTS2 subregions saw a small decline in the share of the less knowledge-intensive services with the share rising in most other regions.
Moving towards the analysis of the industry growth differences between the two periods at a subregional level, Figure 4 shows the NUTS2 annual growth rates in both periods. For simplicity of the analysis, the 11 industry groups were combined into six broader aggregations. Services were combined into two major groups based on the knowledge intensity, and the manufacturing industry groups combined into two groups based on the technology intensity (real estate and other production were not grouped and are shown separately). To assist the analysis, the NUTS2 subregions are also differentiated in Figure 4, according to their growth differential relative to the UK average. The fastest-growing NUTS2 subregions (in blue) had a cumulative growth that exceeded the national growth by 3 percentage points or more between 2010 and 2016. The slowest-growing subregions (in red) had a cumulative growth of 3 or more percentage points below the national average for the same period.
Figure 4: Annual growth rates of real gross value added in NUTS2 subregions by broad industry group, UK, 1998 to 2007 and 2010 to 2016

Source: Office for National Statistics
Download this image Figure 4: Annual growth rates of real gross value added in NUTS2 subregions by broad industry group, UK, 1998 to 2007 and 2010 to 2016
.png (134.0 kB) .xls (149.5 kB)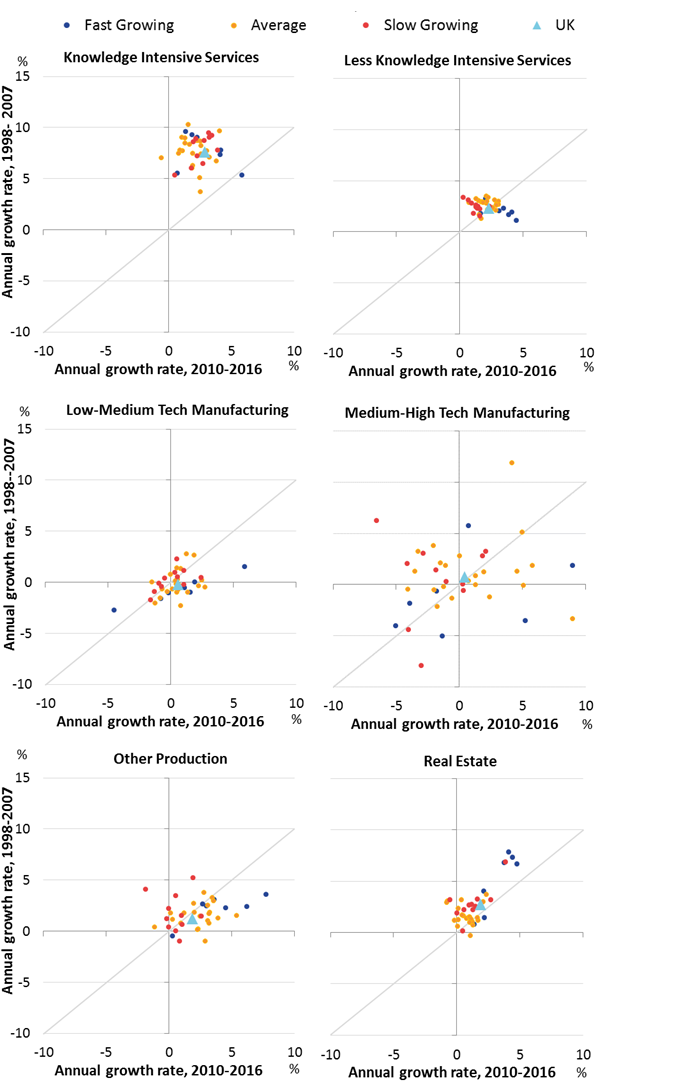
The comparison of the industry growth rates between the two periods at subregional level unveils very distinct patterns in each of the six broad industry groups. The output growth of the knowledge-intensive service declined considerably between the two periods in all NUTS2 subregions (except in Outer London West), in line with the national trend for each of the three types of knowledge-intensive services.
With regards to the less knowledge-intensive services, there is a distinct pattern between the fastest-and the slowest-growing subregions. In the slowest-growing regions, output growth in less knowledge-intensive services was stronger in the first period compared to the second period. In most of the fastest-growing regions, less knowledge-intensive services grew faster in the second period. Given the high share of this type of services in the national economy and in most of the subregions (often more than 50%), even a small increase in output growth in this industry group can have a relatively large impact in the output growth of the region.
Comparing the patterns of the two manufacturing industry groups, there are also some distinct differences. For low- to medium-tech manufacturing, most of the regions are clustered around the negative 2% to 2% interval, meaning that there were no great changes in annual growth rates between the two periods. In contrast, there is a greater variation in annual growth rates of the medium- to high-technology manufacturing among the NUTS2 subregions in each period. The annual growth rates for the 2010 to 2016 period varies from negative 7% in East Yorkshire and Northern Lincolnshire to 9% in Herefordshire, Worcestershire and Warwickshire, and in West Midlands. There is also a greater variation in annual growth rates between the two periods in some NUTS2 subregions. For example, the annual growth rates in the two aforementioned subregions of West Midlands increased by 7 and 12 percentage points respectively.
Most of the subregions have experienced a slowdown in real estate activities output growth, in particular those areas that have a relatively stronger growth during the 1998 to 2007 period, that is, the five London NUTS2 subregions.
Results: Relative specialisation
The relationship between specialisation and economic growth goes back to the classical argument that economies focus their activities on the most competitive sectors and/or are more inclined to increase gains in efficiency. There is a vast literature on growth explaining the theoretical arguments and presenting empirical evidence that differences in specialisation patterns can then affect growth rate across areas owing to the existence of differences in the growth potential of each sector. An area is said to be more specialised when some of its economic sectors provide larger shares of output (or employment) relative to the other areas in the country.
To capture the level of specialisation of the NUTS2 subregions across the UK and compare its dynamics, the Krugman specialisation index (KSI) was computed on an annual basis for the entire period, using the Eurostat aggregation approach.
Figure 5 shows that the fastest-growing NUTS2 areas are, on average, more specialised than the other areas and show an increasing trend in specialisation over the past two decades. In contrast, the slowest-growing subregions show a much lower and relatively constant level of specialisation throughout the entire period.
Figure 5: Average Krugman specialisation index for NUTS2 subregions growth groups, UK, 1998 to 2016
Source: Office for National Statistics
Notes:
Fast-growing NUTS2 subregions are those that had a cumulative growth that exceeded the national growth by 3 percentage points or more between 2010 and 2016. Slow-growing subregions are those that had a cumulative growth of 3 or more percentage points below the national average for the same period.
The Krugman specialisation index (KSI) takes value 0 if a region has an economic structure similar to the UK structure, indicating that the region is not specialised. It takes a maximum value of 2 if a region has no sectors in common with the rest of the UK, reflecting strong sectoral specialisation.
For the computation of the KSI, nominal gross value added (GVA) by industry was used instead of real GVA, because real GVA by industry should not be added up to regional totals.
Download this chart Figure 5: Average Krugman specialisation index for NUTS2 subregions growth groups, UK, 1998 to 2016
Image .csv .xlsWithin the fastest-growing regions, there are two different types of areas: those that show a very high level of specialisation with little change between 1998 and 2016; and those that, not being highly specialised before the economic downturn, showed an increase in specialisation in the post-economic downturn period to levels above the 0.26 average level of the KSI. The first group includes Inner London subregions, Outer London West and North West, and North Eastern Scotland. The second group includes Berkshire, Buckinghamshire and Oxfordshire; Herefordshire, Worcestershire and Warwickshire; and Outer London East and North East.
For the remaining regions, although there is also an upwards trend in relative specialisation, particularly in the post-economic downturn period, very few areas reached a level of specialisation above 0.3, the minimum level among the fastest-growing NUTS2 subregions in 2016.
The following section will show how location quotients can provide a more detailed picture of the sectoral structure of NUTS2 subregions. The use of location quotients can show, for example, in which industries have some subregions became more specialised over time.
Results: Location quotients analysis
Location quotients (LQs) are a simple and very common measure used to assess the relative specialisation of regions in an industry. A location quotient of 1 indicates that the region’s share of an industry in its regional output is the same as the share of that industry to the national output.
As shown earlier, the different types of industry explored in this article have grown at different rates since 1998 with some of the sectors performing differently pre- and post-economic downturn. The location quotient analysis allows us to examine in more detail the relative industrial specialisations of each subregion and the degree to which this has changed over time.
Note that location quotients are a relative measure. If an industry is declining sharply in share of output across the UK overall, but only slightly in a particular region, then that region will have an increasing location quotient for that sector despite the fact its output in the sector is declining. This is because in this case it is becoming relatively more specialised in that sector when compared to the rest of the country.
Figure 6 shows the location quotients of four NUTS2 subregions that have either shown considerable growth improvement or decline in the post-economic downturn period compared with the decade to 2007, or have very different industry compositions.
Figure 6: Location quotients by broad industry groups, UK, 1998 to 2016

Source: Office for National Statistics
Notes:
- A location quotient greater than 1.25 indicates a high level of relative specialisation of subregion (j) in industry (i), and location quotients below 0.75 indicate a low level of specialisation.
Download this image Figure 6: Location quotients by broad industry groups, UK, 1998 to 2016
.png (108.3 kB) .xls (158.2 kB)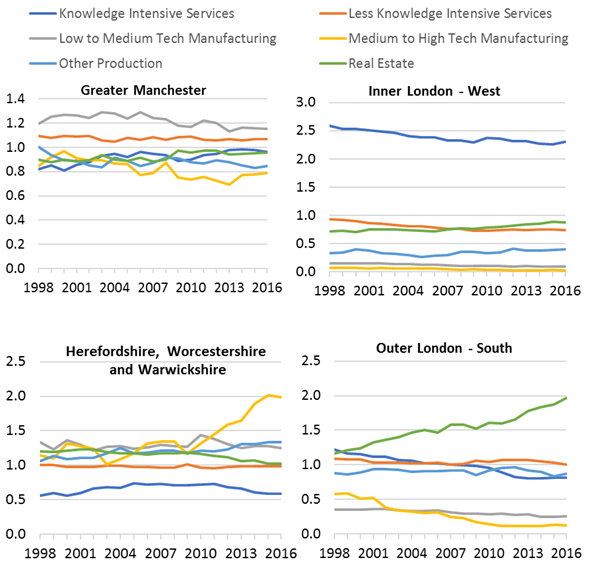
The top two charts show two subregions with very different levels of relative specialisation. Greater Manchester was, in 2016, the subregion with an industry structure most similar to the UK overall, which is shown by none of the six industry sector groupings having a location quotient of more than 1.2.
By contrast, Inner London West displays a clear specialisation in the knowledge-intensive services. While the extent of this relative specialisation has fallen slightly over time, it remains high, and this focus on the knowledge-intensive services in Inner London has been an important determinant of its strong growth since 1998.
The bottom two charts in Figure 6 show two subregions that have moved in opposite directions since the economic downturn: Herefordshire, Worcestershire and Warwickshire, and Outer London South. In the case of Herefordshire, Worcestershire and Warwickshire, Figure 6 shows clearly that there has been an increasing relative specialisation in the medium- to high-tech manufacturing sector since 2009. This is supported by the strong improvement in output growth, post-economic downturn, in this sector, which was shown earlier in Figure 4. A similar pattern has also taken place in the West Midlands NUTS2 subregion.
In the case of Outer London South, the location quotients show that the subregion has been getting relatively less specialised in both knowledge-intensive service sectors and also in medium- to high-tech manufacturing. By contrast, its specialisation in the real estate sector has been increasing through the period.
Results: Shift-share analysis
This article adopts the multi-factor partitioning model, developed by Ray (1990), to analyse changes in the NUTS2 subregions’ gross value added (GVA), considering the distribution of industries in each region. Multi-factor partitioning is a technique, similar to shift-share analysis, that decomposes the observed changes in economic growth into three components: a national component, an industry-mix effect and a regional effect.
The national component is the share of regional growth had the regions grown at the national rate and it measures the effects of macroeconomic fluctuations on the described regional growth. The industry-mix effect is the share of regional growth that is due to the industrial structure of the regions and it determines whether a region has an expanding or contracting industrial structure. The regional effect is the difference between the regional growth and the growth that would have occurred in the region if industries were proportionally distributed across regions.
Figures 7 and 8 illustrate the results pre- and post-economic downturn for a number of subregions. For Inner London West, the industry-mix effect was positive in the 1998 to 2007 period, reflecting that the subregion specialised in many of the industries that were growing in the UK during this period (for example, knowledge-intensive service sectors). However, from 2010 to 2016, this effect turned negative, likely caused by the fall in output in London’s main specialisation of financial services over this period (see Figure 3). Instead, Inner London West has a positive “region effect” during this latter period, reflecting that the subregion has outperformed the growth level that would be expected based on the national performance of its industries only.
For Outer London South, the regional effect was negative for both periods covered, showing the area has not been performing as well as might be expected, particularly as the industry-mix effect has had a negative contribution to the regional growth. There is a similar story for the Gloucestershire, Wiltshire and Bristol/Bath subregion.
For Herefordshire, Worcestershire and Warwickshire, the data reconfirmed analysis elsewhere in this article showing a different performance pre- and post-economic downturn. From 1998 to 2007, the regional effect was negative in the subregion. However, both the region and industry-mix effects have been positive over the 2010 to 2016 period, reflecting that the subregion has had an industry structure aligned to faster-growing industries over this period and has also outperformed the growth levels that would have been expected given this structure.
Figure 7: Contribution to multi-factor partitioning components to regional cumulative growth, UK, 1998-to 2007
Source: Office for National Statistics
Download this chart Figure 7: Contribution to multi-factor partitioning components to regional cumulative growth, UK, 1998-to 2007
Image .csv .xls
Figure 8: Contribution to multi-factor partitioning components to regional cumulative growth, UK, 2010 to 2016
Source: Office for National Statistics
Download this chart Figure 8: Contribution to multi-factor partitioning components to regional cumulative growth, UK, 2010 to 2016
Image .csv .xlsNote that the “regional effect” is generally just as important as the industry-mix effect in most cases. This is an important point to note. While this article has focused largely on the effects of industrial structure and specialisation on growth performance, other factors can play an equally important role. Firms within the same industry do not always grow at the same rate across all regions. Instead, some areas are often able to achieve faster growth within sectors, whether through increases in productivity or inputs. For this reason, while industry structure can play a role in the growth of an area, policy will also focus on seeking to increase the general productivity potential of an area across all industries through improvements in skills, infrastructure and entrepreneurship. Indeed, in the Firm level regional productivity analysis release published in the economic review alongside this one, it is shown that for most areas, relative productivity levels across different areas of the country are more dependent on average firm productivity within industries than on differences in industrial structure.
Conclusion
Regional growth rates during the economic recovery (2010 to 2016) differed from those in the decade prior to the downturn (1998 to 2007). Northern Ireland and regions in the north of England all fared less well during the more recent period, while West Midlands jumped from having the lowest average growth rates pre-downturn to having the second-highest average growth rates post-downturn. The highest growth rates in both periods occurred in London.
Data for the 40 NUTS2 subregions add further detail to the trends. Subregions that had above-average growth both pre- and post-economic downturn include four of the five London NUTS2 areas, along with Cheshire, and Berkshire, Buckinghamshire and Oxford. Meanwhile, many subregions in the north of England had above-average growth in the earlier period but below-average growth in the latter period while the opposite was true of Herefordshire, Worcestershire and Warwickshire NUTS2 area.
Areas that had relatively high growth levels since 1998 have tended to experience a high level of relative industrial specialisation (compared with the average UK industry structure). For example, Inner London West and Inner London East have a long-standing specialisation in knowledge-intensive services and have benefitted from the strong growth in these sectors over the period.
Areas that have significantly improved performance in the 2010 to 2016 period have also benefitted from increasing specialisation relative to the UK industry structure. For example, West Midlands, and Herefordshire, Worcestershire and Warwickshire NUTS2 areas have benefitted from increasing specialisation in medium- to high-tech manufacturing.
However, while growth in sectors such as knowledge-intensive services and medium- to high-tech manufacturing can be an important aid to strong regional growth, it is also worth noting that there was a close correlation over the 2010 to 2016 period between areas that have increased output most in the less knowledge-intensive service industries and those that have had the highest gross value added (GVA) growth overall. This partly reflects the importance of these sectors in terms of their overall size and contribution to the economy. Less knowledge-intensive services typically account for between 40% and 50% of economic output in each subregion.
Finally, as shown in the shift-share multi-factor partitioning analysis, it is not only industrial structure that can impact regional economic growth. Additionally, there are a range of other factors that can contribute to the “regional effect” component of growth that allows firms within the same industry to outperform in some subregions. For this reason, while industry structure, and specialisms in fast-growing sectors, can play a role in the growth of an area, policy typically also focuses on seeking to increase the general productivity potential of an area for all its industries through achieving improvements in factors such as skills, infrastructure and entrepreneurship.
Back to table of contents4. Appendix
| 11 Industry Groups | SIC07 two-digit level code included in group |
|---|---|
| High-tech Knowledge Intensive Services | 59, 60, 61, 62, 63, 72 |
| Knowledge Intensive Financial Services | 64, 65, 66 |
| Knowledge Intensive Market Services | 50, 51, 69, 70, 71, 73, 74, 78, 80 |
| Less Knowledge Intensive Market Services | 45, 46, 47, 49, 52, 53, 55, 56, 77, 79, 81, 82, 94, 95, 96, 97-98 |
| Other Knowledge Intensive Services | 58, 75, 84, 85, 86, 87, 88, 90, 91, 92, 93 |
| Low Technology Manufacturing | 10, 11-12, 13, 14, 15, 16, 17, 18, 31, 32 |
| Medium-Low Technology Manufacturing | 22, 23, 24, 25, 33 |
| Medium-High Technology Manufacturing | 19-20, 19-21, 27, 28, 29, 30 |
| High Technology Manufacturing | 21, 26 |
| Other Production | 1, 2, 3, 9, 5-8, 5-9, 35, 36-37, 38, 39, 41, 42, 43 |
| Real Estate | 68 |
| 6 Broad Industry Groups | 11 Industry Groups |
| Knowledge Intensive Services (KIS) | High-tech Knowledge Intensive Services |
| Knowledge Intensive Financial Services | |
| Knowledge Intensive Market Services | |
| Less Knowledge Intensive Services | Less Knowledge Intensive Market Services |
| Other Knowledge Intensive Services | |
| Low to Medium Tech Manufacturing | Low Technology Manufacturing |
| Medium-Low Technology Manufacturing | |
| Medium to High Tech Manufacturing | Medium-High Technology Manufacturing |
| High Technology Manufacturing | |
| Other Production | Other Production |
| Real Estate | Real Estate |
| Source: Office for National Statistics | |