
Table of contents
- Abstract
- Main points
- Things you need to know about this release
- Introduction
- The layout of Table 29
- Definitions and concepts
- UK pension entitlements or liabilities in 2015 (headline figures)
- Defined benefit methodology
- Defined contribution methodology
- Trends over time (government-managed schemes)
- Future work
- Annex 1: Differences between Table 29 and other presentations
- Annex 2: Classifications
- Glossary
1. Abstract
This article presents estimates of the total entitlement of households in the UK and abroad to pensions provided by the UK government, pension funds and insurance companies. These are also the total obligations, or gross liabilities, of UK pension providers. The article includes estimates for State Pensions and breakdowns by whether pensions are funded or unfunded and defined contribution or defined benefit. The estimates are compiled for national accounts Table 29: Accrued-to-date pension entitlements in social insurance, which is being published by all EU countries for 2015. For the UK, the years 2010 to 2014 are also provided.
Back to table of contents2. Main points
At the end of 2015, total accrued-to-date gross pension liabilities of UK pension providers in respect of employment-related (workplace) pensions and State Pensions were estimated at £7.6 trillion, up from £6.6 trillion at the end of 2010 (not adjusted for inflation). The liabilities of UK pension providers are also the entitlements of households.
The 2015 total included £5.3 trillion of pension entitlements (279% of gross domestic product (GDP)) that were the responsibility of central and local government, of which:
the largest part was £4 trillion of entitlements to unfunded State Pensions, which are received by most households in retirement (213% of GDP)
unfunded defined benefit workplace pension entitlements for public sector employees were estimated at £917 billion (49% of GDP)
funded defined benefit workplace pension entitlements for (mainly) public sector employees were worth £334 billion (18% of GDP)
The 2015 total included £2.3 trillion of pension entitlements (124% of GDP) that were not the responsibility of central or local government:
£2 trillion of funded defined benefit workplace pension entitlements for private sector employees (106% of GDP)
£240 billion of defined contribution workplace pension entitlements for (mainly) private sector employees (13% of GDP)
an estimated £103 billion of annuity entitlements associated with workplace pensions (5% of GDP)
In addition to workplace pensions and State Pensions, the Office for National Statistics estimates that in 2015 there was:
£302 billion in defined contribution individual personal pensions (16% of GDP)
an estimated £148 billion of annuity entitlements associated with individual personal pensions (8% of GDP)
3. Things you need to know about this release
Liabilities and entitlements
Table 29 is compiled by putting together estimates for the total obligations, or gross liabilities, of UK pension providers. These are also the entitlements or assets of the households that are receiving or will receive pensions, which may be in the UK or abroad. Therefore gross pension liabilities and entitlements refer to the same values seen from different viewpoints.
Gross and net liabilities
Gross pension liabilities are the estimate of pension providers’ total pension obligations outstanding at a point in time. Funded defined benefit (DB) pension schemes’ gross liabilities may be higher or lower than their assets, producing a deficit or a surplus that is known as the “net liability” (see Section 6). Throughout this article, references to liabilities are to gross rather than net liabilities unless otherwise stated.
DC and DB
For defined contribution (DC) pensions, estimates of liabilities are the same as the market value of assets. However, for defined benefit (DB) pensions, estimates of liabilities are calculated actuarially using assumptions. Varying these assumptions – in particular the discount rate – can lead to very different results (see Section 8).
Accrued-to-date versus fiscal sustainability analysis
The estimates presented in this article are on an accrued-to-date or “closed system” basis, which does not take into account future accruals. They provide an important snapshot of UK pensions and are consistent with national accounts approaches. However, policy decisions require fiscal sustainability analysis, particularly for unfunded pension schemes (for public sector employees and State Pensions). For unfunded pension schemes, fiscal sustainability or “open system” analysis looks at whether projected future receipts of contributions and tax payments will be sufficient to meet future benefit payments (see Section 6).
Debt
The pension liabilities shown in Table 29 are not part of public sector net debt1 (see Section 6). Pension liabilities do not constitute previous borrowing that has to be serviced or repaid at a point in time. They are paid out over many years. When faced with pension liabilities that are considered to be unacceptably high, it is not unusual for governments to negotiate rule changes to reduce them. The impact of such changes can be seen in Table 29 (see Section 10).
State Pensions versus private pensions
UK State Pensions are mandatory and contributory and most households receive them in retirement (see Section 4). The estimates for State Pensions in this article do not include non-contributory state benefits for pensioners such as Pension Credit. All other types of pension in the UK (private workplace and individual pensions) are defined as voluntary because even if employees are automatically enrolled into a pension scheme they can choose to opt out.
This release includes a Glossary (see Section 14), which explains the terminology used in the article.
Notes for: Things you need to know
- Public sector net debt measures liabilities in currency and deposits, debt securities and loans (Maastricht Debt), less any liquid assets.
4. Introduction
This article presents estimates of the total entitlement of households in the UK and abroad to pensions provided by the UK government, pension funds and insurance companies. The estimates are compiled for national accounts Table 29: Accrued-to-date pension entitlements in social insurance (2015), which is being published by all European Union (EU) countries for the first time. For the UK, the Office for National Statistics (ONS) is also publishing estimates for 2010 (revised) to 2014.
The estimates are compiled according to the requirements of the national accounts contained in the 2010 European System of Accounts (ESA 2010). They follow guidance provided by the European statistical agency, Eurostat.
The household pension entitlements in Table 29 are also the gross liabilities of UK pension providers. The table covers social security pensions (State Pensions in the UK) and employment-related (workplace) pensions which meet national accounts definition of pensions in social insurance (see Glossary).
What is new in this article?
In April 2012, ONS published the first experimental table for the UK showing pension entitlements for the year 2010. Like the original article, this one is entitled “a fuller picture of the UK’s funded and unfunded pension obligations” because it brings together in one place official estimates for most UK pensions, calculated using clearly documented methods. Much of the information presented here is new. All of it has been carefully reviewed and a number of improvements have been made with respect to the original, experimental table.
Some ways in which this article sheds new light on UK pension obligations are:
there are new tables for 2011 to 2015, including estimates for liabilities of unfunded pensions for public sector employees and State Pensions (previously only available for 2010)
there are clear breakdowns between defined benefit (DB) and defined contribution (DC) pensions
the liabilities for which the UK government is responsible (funded and unfunded) are distinguished from those that are not the responsibility of government
although Table 29 only includes workplace pensions, we are also publishing estimates for individual personal pensions for the self-employed and others
there is a full sequence of accounts, allowing users to see not only the liabilities or entitlements but also the transactions and other flows that take place each year and help to explain changes in liabilities or entitlements over time
What is a pension in the national accounts?
In the national accounts, pensions specifically refer to “pensions in social insurance” (see Glossary), which provide entitlements to income payments in retirement resulting from contributions made during working life. Pensions in social insurance may be provided by “social security pension schemes” (see Glossary) or by employment-related pension schemes. To be a pension scheme in social insurance, one or more of the following criteria must be satisfied1:
participation in the scheme is mandatory
the scheme is collective
the employer makes a contribution
The UK social security pension scheme is the mandatory State Pension. The UK also has many employment-related or workplace pension schemes, which are all voluntary.
Pensions in social insurance include any related benefits that may be provided – such as survivor and early retirement pensions – if they are an integral part of the pension schemes’ benefits. They do not include non-contributory state benefits for pensioners such as Pension Credit or other forms of social assistance such as health and social care. Nor do they include individual personal pensions (IPPs), such as those built up by the self-employed (although we provide estimates for IPPs in this article). IPPs are treated as individual saving in the national accounts.
Workplace pensions
Workplace pensions in the UK come in many forms. Most are provided through an employer, but in some cases – particularly for multi-employer occupational schemes and group personal pensions (GPPs) provided by insurance companies – the employer only facilitates a collective scheme and contributes to it (meeting the criteria that the scheme is collective and the employer makes a contribution). All workplace pension schemes in the UK are voluntary, so the criterion that participation in the scheme is mandatory is not met. Even in the case of the government’s auto-enrolment programme membership is voluntary because people are entitled to opt out of the collective pension scheme if they wish.
ONS’s Annual Survey of Hours and Earnings (ASHE) shows that around two-thirds of employees (private and public sectors) were members of pension schemes in 2015 (Figure 1). Defined benefit (DB) occupational pension schemes had most members, with 28.3% of employees; many of these were in the public sector. Only 16.3% of employees belonged to defined contribution (DC) occupational schemes in 2015, but this proportion is growing due to the establishment of “master trusts” such as NEST, which are DC, as part of the auto-enrolment programme. The other large category is GPPs (17.5% of employees in 2015), which are DC and include group stakeholder pensions. Group self-invested personal pensions (Group SIPPs), also DC, accounted for a small proportion of employees (0.5%); they are currently not included in Table 29 because they are not separately identified in national accounts data sources (they are treated as part of individual saving).
Figure 1: Percentage of employees with a pension (by main pension type), 2015
Source: Annual Survey of Hours and Earnings, Office for National Statistics
Download this chart Figure 1: Percentage of employees with a pension (by main pension type), 2015
Image .csv .xlsEmployee membership in ASHE roughly equates to “active membership” (see Glossary). However, there are also a large number of – predominantly DB – preserved (deferred) entitlements and pensions in payment. According to the Occupational Pension Schemes Survey (OPSS), there were 33.5 million members of occupational pension schemes in 20152 (Figure 2).
Figure 2: Total membership of occupational pension schemes in 2015
Source: Occupational Pension Schemes Survey, Office for National Statistics
Download this chart Figure 2: Total membership of occupational pension schemes in 2015
Image .csv .xlsState Pensions
The UK State Pension is based on a person’s National Insurance (NI) record throughout working life. The NI record can include contributions paid through employment and self-employment, when contributions are mandatory; credits for qualifying benefits (such as when a person is unemployed); credits during periods of caring for others; and voluntary contributions. References to the State Pension in this article do not include non-contributory state benefits for pensioners such as Pension Credit.
The State Pension aims to provide universal coverage (see Section 7 of the methodology article). It is designed to provide a basic income in retirement, which people are encouraged to add to though workplace pension schemes and other forms of saving for retirement. The State Pension is not designed with reference to a desired “replacement rate” (see Glossary).
Notes for: Introduction
See paragraph 17.06 of the ESA2010 Manual.
There are also deferred entitlements associated with GPPs, but we do not have membership figures for GPPs (only estimates of the value of members’ entitlements).
5. The layout of Table 29
The main part of Table 29 is Columns A to I, for which we are publishing a full set of results for 2010 to 2015. An additional Eurostat requirement for 2015 was to split pension entitlements according to whether they belong to UK-resident households or to households resident abroad (Columns J and K).
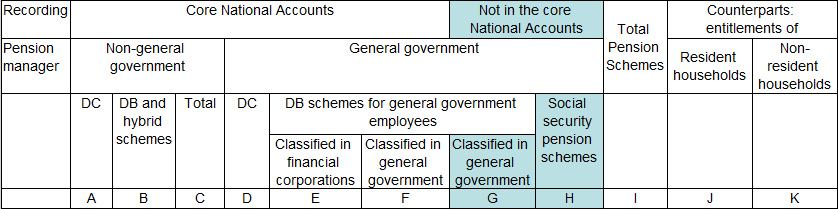
Table 29 starts by dividing pensions according to where they are recorded: in the core national accounts or “not in the core national accounts” (only in Table 29). This is shown in the first row of column headings for Columns A to H (Figure 3). The interpretation followed in the EU is that the liabilities of unfunded pension schemes for government employees and unfunded social security pension schemes such as UK State Pensions need only be recorded in Table 29 (not in the core accounts). Funded schemes, on the other hand, must be recorded in the core accounts1.
Figure 3: Table 29 column headings
Source: Office for National Statistics
Download this image Figure 3: Table 29 column headings
.png (17.0 kB)
The second important division of the main part of the table (Columns A to I) is between pension schemes for which the general government sector of the national accounts (S.13) is the pension manager and schemes for which the pension manager is not in S.13 (“non-general government”). The concept of pension manager refers to the organisation that is ultimately responsible for the pension obligations: general government in the national accounts is broadly similar to the lay-person’s definition of government, while “non-general government” pension managers may be private sector employers, multi-employer pension funds and insurance companies that provide pensions2. Any public sector organisations such as public corporations where the government is deemed not to be responsible for the pension liabilities are classified to non-general government as the pension manager (see Annex 2).
The next row of column headings relates to the type of pension scheme. Workplace pension schemes are in Columns A to G and social security schemes are in Column H. Workplace schemes are further divided according to whether they are defined benefit (DB) (including hybrid, see Glossary) or defined contribution (DC) and which sector of the national accounts the scheme administrator (see Glossary) is classified to – which may be different from the sector of the pension manager (see Annex 2).
In the UK, all workplace pension schemes for which non-general government is the pension manager (Columns A to C) are classified in the financial corporations sector (S.12). Workplace pension schemes where the pension manager is in general government are classified in financial corporations in terms of the pension administrator (Column E) if they are funded schemes and in general government in terms of the pension administrator (Column G) if they are unfunded schemes.
In the UK, there are no schemes in Column D or Column F.
Columns A and B
Column A comprises DC pensions for (mainly) private sector employees. The UK has thousands of DC pension schemes, both occupational (trust-based) and personal (contract-based). DC occupational pension schemes include the multi-employer “master trusts” set up since 2012 to provide pensions under the auto-enrolment programme if the employer does not already have a workplace pension scheme. Personal pensions are provided mainly by insurance companies. If they are group personal pensions (GPPs) they are in scope of Table 29, while if they are IPPs they are not in scope (see Section 4).
The values reported in Column A are for pension pots building up during peoples’ working lives and for drawdown in retirement (see Section 2 of the methodology article). Annuities paid out in retirement after DC pension pots have been converted to annuity entitlements are included in Column B, not Column A. This is a change with respect to the experimental Table 29 for 2010, where annuities were included in Column A.
Column B contains estimates for funded DB pensions for private sector employees (see Section 3 of the methodology article). Although active membership of such schemes is relatively low and declining because of closures to new members, these schemes still have a large “legacy” membership including pensioners and deferred members with entitlements to pensions which will be paid at retirement (see Section 4). Column B estimates are adjusted to take account of the entitlements of members whose schemes move into the Pension Protection Fund (PPF).
Column B also includes pension annuities paid by insurance companies in retirement (see Section 4 of the methodology article). This follows Eurostat guidance issued in 2016 to treat annuities as DB pension entitlements because the insurer assumes the risk and retirees receive a defined pension benefit. Annuities come from two sources: the sale of GPP pension pots at retirement; and occupational pension schemes which have been transferred to insurers to be paid as annuities.
Columns E and G
Column E comprises the obligations of funded DB workplace pension schemes for which government is responsible. The largest scheme in Column E is the Local Government Pension Scheme (LGPS), which provides pensions mainly for local authority employees. This column also includes pension schemes for Transport for London (TfL) employees. The pension manager for the LGPS and TfL schemes is the local government sub-sector S.1313 (see Annex 2). Column E also contains a number of schemes for which the central government sub-sector S.1311 is the pension manager, such as schemes for BBC employees and members of nationalised industries (railways and coal). A full list of Column E schemes is included in Section 5 of the methodology article.
Column G in the UK comprises centrally-administered unfunded pension schemes for public sector employees, of which the main schemes are those for: civil servants, teachers, National Health Service (NHS) employees, members of the Armed Forces, police officers, firefighters, the judiciary, members of the security services (MI5 and MI6), UK Atomic Energy Authority employees, Department for International Development (DFID) overseas employees and people working for the Research Councils. Since the 2010 table was published, the Royal Mail Statutory Pension Scheme has joined Column G (see Section 6 of the methodology article).
Column H
Column H contains estimates for the unfunded State Pension system, which covers most people in the UK and some pensioners resident overseas. State Pensions are the only mandatory UK pension: people must make NI contributions during their working lives except in certain circumstances such as unemployment or caring for others, when qualifying years are “credited” although no NI contributions have been paid (see Section 7 of the methodology article).
Notes for: The layout of Table 29
Estimates for funded schemes should be broadly consistent between Table 29 and the core accounts. This is the case for the UK, with some exceptions (see Annex 1).
It should be noted that the non-general government versus general government distinction for schemes’ pension managers does not map directly to private sector employees versus public sector employees. Nevertheless, pension schemes where non-general government is the pension manager are mainly for private sector employees (but they include a small proportion of public sector employee entitlements relating to GPPs provided by insurers that are not separately identifiable); while pension schemes where general government is the pension manager are mainly for public sector employees (but they include a small proportion of private sector employees, particularly in the case of schemes where local government is the pension manager).
6. Definitions and concepts
The gross liabilities approach
For defined contribution (DC) pensions, national accounts estimates of pension entitlements or liabilities are the same as the market value of their assets. By contrast under the European System of Accounts (ESA 2010), estimates of pension entitlements or liabilities of defined benefit (DB) (including hybrid) schemes must be calculated on an actuarial basis. The actuarial calculation uses assumptions (see Section 8) to estimate the pension and related benefits that will be paid out over time and discounts these future payments to produce a “present value” (see Glossary and Section 8) at the date of the accounts.
For funded DB pensions, the actuarial liabilities of the pension scheme may be higher or lower than the value of the scheme’s assets. If the actuarial estimate of liabilities is higher than the assets, there is a deficit; if lower, there is a surplus. Table 29 is based on a “gross liabilities” approach. It does not show the assets of funded DB pension schemes or their surplus or deficit (“net liability”).
Table 29 shows – for DB schemes – gross pension liabilities actuarially calculated and the increase or decrease in these gross liabilities each year that is the responsibility of the pension manager. This can be seen by looking at the rows of the table for Columns B, E and G:
the balances of entitlements or liabilities are shown in Rows 1 (start of year) and 10 (end of year)
Row 2 (except 2.2) to Row 6 show the in-year flows associated with contributions received by the scheme, benefits paid out, transfers and other transactions
Rows 7, 8 and 9 show the in-year flows associated with negotiated changes in scheme structure and changes in actuarial assumptions (see Section 8)
the “employer imputed social contribution” (Row 2.2) reflects the increase or decrease in the scheme liability during the year that is not accounted for elsewhere and is the responsibility of the pension manager; it is calculated as a residual or balancing item after taking into account all other changes
Thus, Table 29 shows changes in the gross liabilities of pension managers. It does not show the increase or decrease in such schemes’ assets or changes in the net liabilities of pension managers.
It should be noted that for unfunded DB workplace schemes (Column G), the same approach is followed as for funded schemes (Columns B and E). For unfunded social security schemes (Column H), the approach is similar but – as there is no employer for such schemes – the residual or balancing item after taking into account all other changes is shown in Row 3 “other (actuarial) change of pension entitlements” (see Section 10) rather than in Row 2.2. As unfunded schemes have no assets (by definition), they can have no surplus or deficit.
The accrued-to-date (closed system) concept
Table 29 shows estimates of pension entitlements or gross liabilities on an “accrued-to-date” basis, in line with other information in the national accounts. The balances of entitlements or liabilities at the start and end of each year may be interpreted as the amount that the pension manager (government or non-government) owes for service to date. This is similar to the amount that would be owed if the schemes were wound up at the date of the accounts and the liabilities were assumed in full.
The present value of liabilities calculation on an accrued-to-date basis takes into account the pension benefits that will be paid in future to:
people who are already retired
people of working age (with respect to their entitlements from service to date)
However, it excludes entitlements to pensions that will be built up in future by today’s workers (in respect of future service) or by people who are not yet of working age (future contributors). This approach is frequently referred to as the “closed system” approach.
Fiscal sustainability
As Table 29 is compiled on an accrued-to-date (closed system) basis, the estimates of entitlements or liabilities do not include rights that will be built up in the future. The table provides an important snapshot of UK pensions and is consistent with national accounts approaches, but the estimates are not an appropriate measure of fiscal sustainability.
Fiscal sustainability measures should use an “open system” approach, which takes into account:
on the liability side: pension entitlements that will be built up in future (from today’s workers and from future contributors) as well as those accrued to date
on the asset side: contributions and tax payments that will be received by the scheme or pension manager in future, as well as any funds accumulated to date and growth of funds in future
The fiscal sustainability approach is particularly useful in relation to unfunded pension schemes for public sector employees (Column G) and unfunded social security (state) pension schemes (Column H). As these schemes have no funds, fiscal sustainability analysis looks at whether projected future receipts of contributions and tax payments will be sufficient to meet projected future benefit payments.
Public sector finance fiscal aggregates
The pension liabilities shown in Columns E, G and H of Table 29 do not form part of public sector net debt (PSND), as published in the public sector finances. PSND measures liabilities in currency and deposits, debt securities and loans (Maastricht Debt), less any liquid assets.
The supplementary fiscal aggregate public sector net financial liabilities (PSNFL) includes the net liabilities of government as a pension manager for funded DB pension schemes (Column E). However, as noted previously, only gross pension liabilities are shown in Table 29. The net pension liability calculation is carried out for PSNFL using additional information in the core accounts.
Public sector finances statistics are compliant with the definitions and concepts of national accounts. Only funded pension scheme liabilities are recorded in the core accounts. As unfunded pension scheme liabilities are not in the core accounts, pension liabilities in Columns G and H are not included in PSNFL.
It is important to note that pension liabilities do not constitute previous borrowing that has to be serviced or repaid. It is possible to change the rules of DB pension schemes (including State Pensions) and thereby change the obligations outstanding. Such changes may affect service already accrued by pension scheme members as well as future service. When faced with pension liabilities that are considered to be unacceptably high, it is not unusual for governments to negotiate rule changes to reduce them; the impact of such changes can be seen in Table 29 (see Section 10). Therefore the pension liabilities in Table 29 represent the obligations outstanding implied by current pension rules and legislation. For this reason, they are properly defined as contingent pension obligations1 rather than debt.
Notes for: Definitions and concepts
- Contingent pension obligations are not the same as contingent liabilities as defined by HM Treasury for the purposes of the Whole of Government Accounts (see Annex 1) and by the Office for Budget Responsibility in its fiscal sustainability reports. These reports define contingent liabilities as liabilities that are associated with events that may arise in future but are improbable (less than 50% probability); some of these events are also unquantifiable.
7. UK pension entitlements or liabilities in 2015 (headline figures)
This section presents the headline figures from Table 29. These have been produced by the Office for National Statistics (ONS) in collaboration with the Department for Work and Pensions (DWP) for State Pensions (see Section 7 and 9 to 13 of the methodology article) and with the advice of the Government Actuary’s Department (GAD).
The methods used are complex and vary from column to column of the table; because of the differences between methods used to estimate results for defined benefit (DB) and defined contribution (DC) pensions and the different assumptions used for DB schemes with government and non-government as the pension manager (see Section 8), readers are urged to proceed with caution when comparing the results across columns of Table 29.
Figure 4 is an overview of the entitlements of households to pensions provided by the UK government, pension funds and insurance companies at end-2015. Although not part of Table 29, individual personal pension (IPP) entitlements are included in Figure 4. Total UK pension liabilities, with the exception of self-invested personal pensions (SIPPs)1, were worth £7.6 trillion in 2015 (see UK National Accounts Table 29: Accrued-to-date pension entitlements in social insurance).
Throughout this article, figures are presented in relation to gross domestic product (GDP) in market prices because this allows readers to put the magnitude of pension liabilities or entitlements into perspective, relating them to the size of the economy and the country’s ability to meet its obligations. It is important to bear in mind that GDP in market prices grew by 20% between 2010 and 2015, a rate which may or may not be sustained in coming years.
Total UK pension liabilities
Figure 4 shows that State Pension liabilities are the largest component of total UK pension liabilities (excluding SIPPs), with a present value of £4 trillion in 2015. Most adults are eligible to receive a State Pension and the average (mean) State Pension entitlement was estimated at £74,500 in 20152.
Workplace pensions where government is the pension manager were estimated at £1.3 trillion in 2015, while workplace pensions for which government is not responsible were £2.3 trillion. Together liabilities for social security and workplace pensions were over 400% of GDP in 2015. IPPs – beyond the scope of Table 29 and not managed by government – were worth £450 billion (24% of GDP) in 2015.
Figure 4: UK pension liabilities by type of pension and pension manager, end-2015
Source: Office for National Statistics
Notes:
- State Pensions = social security pensions, Column H of Table 29.
- Workplace pensions, Columns A and B of Table 29 (non-government) and Columns E and G of Table 29 (government).
- Individual pensions are not part of Table 29.
- Excludes SIPPs.
Download this chart Figure 4: UK pension liabilities by type of pension and pension manager, end-2015
Image .csv .xlsGovernment pension liabilities
Table 1 shows a more detailed breakdown of pensions for which government is responsible. Unfunded State Pension liabilities (Column H) rose from £3.8 trillion to £4.0 trillion (up 5%) between 2010 and 2015, but fell from 243% to 213% of GDP. Unfunded workplace pension liabilities (Column G) rose from £851 billion in 2010 to £917 billion in 2015 and also fell as a proportion of GDP (from 54% to 49%). Funded workplace pension liabilities (Column E) rose faster than GDP, reaching an estimated £334 billion (18% of GDP) in 20153.
Correction, 8 March 2018 :
A correction has been made to the units (corrected from millions to billions) referred to in this paragraph. This was due to a small typing error. We apologise for any inconvenience
Table 1: UK Government pension liabilities, end-year
| Table 29 column | E | G | H | |||
|---|---|---|---|---|---|---|
| DB workplace funded | DB workplace unfunded | State (social security) pensions | ||||
| 2010 £ billion | 263 | 851 | 3,843 | |||
| 2015 £ billion | 334 | 917 | 4,027 | |||
| 2010 % GDP | 17 | 54 | 243 | |||
| 2015 % GDP | 18 | 49 | 213 | |||
| Source: Office for National Statistics | ||||||
| Notes: | ||||||
| 1. GDP = Gross Domestic Product at market prices. | ||||||
| 2. Column E and G estimates for 2015 are provisional. | ||||||
Download this table Table 1: UK Government pension liabilities, end-year
.xls (29.7 kB)Figure 5 shows the breakdown for all pensions where government is the pension manager, showing that State Pensions represented just over three-quarters of the government’s total pension liability in 2015 and unfunded pension liabilities were worth 94% of the total. Sections 8 and 10 look in more detail at how the estimates for State Pensions and workplace pensions where government is the pension manager were produced, as well as trends over time.
Figure 5: Breakdown of UK government pension liabilities at end-2015, by type of pension
Source: Office for National Statistics
Notes:
- Figures do not add to 100% due to rounding.
Download this chart Figure 5: Breakdown of UK government pension liabilities at end-2015, by type of pension
Image .csv .xlsNon-government workplace pension liabilities
Table 2 shows a breakdown of the estimates for workplace pensions for which government is not the pension manager. The total in the last column of Table 2 comes from Column C of Table 29, which is the sum of Columns A and B. The liabilities for these schemes were estimated at £2.3 trillion in 2015, up from £1.6 trillion in 2010 (a 45% increase).
Table 2: UK non-government workplace pension liabilities, end-year
| Table 29 column (core accounts sub-sector) | A (S.128) | A (S.129) | B (S.128) | B (S.129) | C | |||||
|---|---|---|---|---|---|---|---|---|---|---|
| DC workplace pensions provided by insurers | DC workplace pensions provided by funds/schemes | Annuities associated with workplace pensions, provided by insurers | DB workplace pensions provided by funds/schemes | Total workplace pensions and annuities | ||||||
| 2010 £ billion | 143 | 23 | 61 | 1,385 | 1,612 | |||||
| 2015 £ billion | 203 | 38 | 103 | 2,001 | 2,344 | |||||
| 2010 % GDP | 9 | 1 | 4 | 88 | 102 | |||||
| 2015 % GDP | 11 | 2 | 5 | 106 | 124 | |||||
| Source: Office for National Statistics | ||||||||||
| Notes: | ||||||||||
| 1. GDP = Gross Domestic Product at market prices. | ||||||||||
| 2. The figure for annuities associated with workplace (vs. individual) pensions is estimated (see Section 4 of the methodology article). | ||||||||||
| 3. Excludes group SIPPs. | ||||||||||
| 4. Column A includes drawdown. | ||||||||||
| 5. S.128 is the insurance corporations sub-sector and S.129 is the pension funds sub-sector within S.12 in the core national accounts. | ||||||||||
Download this table Table 2: UK non-government workplace pension liabilities, end-year
.xls (36.9 kB)The largest part of Column C pension liabilities is Column B (S.129), which is the part of Column B relating to DB workplace pensions provided by occupational pension schemes or funds. Estimates for Column B (S.129) are calculated using a risk-free (market) discount rate (see Section 3 of the methodology article). Much of the increase in the value of Column C liabilities reflects the fact that Column B (S.129) liabilities in 2015 were calculated using a much lower discount rate than in 2010 (see Section 8).
The other parts of Column C pension liabilities also grew strongly between 2010 and 2015:
Column A – DC workplace pensions provided by the insurance corporations sub-sector (S.128) saw growth of 42% to reach £203 billion in 2015
Column A – DC workplace pensions provided by schemes in S.129 saw growth of 67%, fuelled by the establishment of master trusts associated with auto-enrolment
Column B – annuities associated with workplace pensions provided by insurers in S.128 rose by 68% to £103 billion
Individual pension liabilities
To complete the picture of pensions in the UK, Table 3 shows entitlements to IPPs provided by insurers. These are not part of Table 29 because they are not defined as pensions in social insurance (see Section 4). However, as part of the work for Table 29, ONS has produced estimates that are consistent with the Table 29 estimates. It is possible to estimate separately the pension pots building up in the accumulation phase4 and the annuities associated with them, and these were valued at £302 billion and £148 billion respectively in 2015, making a total of £450 billion (excluding SIPPs).
Table 3: UK individual pensions provided by insurers, end-year
| Individual pensions (accumulation phase and drawdown) | Annuities associated with individual pensions | Sub-total individual pensions and annuities | |||
|---|---|---|---|---|---|
| 2010 £ billion | 244 | 102 | 346 | ||
| 2015 £ billion | 302 | 148 | 450 | ||
| 2010 % GDP | 15 | 6 | 22 | ||
| 2015 % GDP | 16 | 8 | 24 | ||
| Source: Office for National Statistics | |||||
| Notes: | |||||
| 1. GDP = Gross Domestic Product at market prices | |||||
| 2. The figure for annuities associated with individual (vs. workplace) pensions is estimated (see Section 4 of the methodology article). | |||||
| 3. Individual pensions are not part of Table 29 but are produced as part of the work for Table 29. | |||||
| 4. Excludes individual SIPPs. | |||||
Download this table Table 3: UK individual pensions provided by insurers, end-year
.xls (36.4 kB)Alternative presentation
Figure 6 shows an alternative way of looking at the private (non-state) pension entitlements that people build up during their working lives, both workplace and individual. Figures are shown as a proportion of GDP. There is no change, with respect to the figures shown previously, for schemes where government is the pension manager. However, for non-government pensions the breakdown is between, on the one hand, funded DB workplace pensions provided by occupational pension schemes (106% of GDP in 2015) and, on the other, all DC pensions, defined as including annuities (42% of GDP in 2015). This was the approach followed for the first experimental Table 29 (for 2010) published by ONS in April 2012. In Figure 6, DC pensions comprise both workplace and individual pension entitlements and are provided by pension funds and insurers.
Figure 6: UK private pension entitlements at end-2015, by type of pension and pension manager
Notes:
- Private pension liabilities are defined as all non-state (social security) pensions, including IPPs which are not part of Table 29.
- Excludes SIPPs.
Download this chart Figure 6: UK private pension entitlements at end-2015, by type of pension and pension manager
Image .csv .xlsResident and non-resident household entitlements
For the first time in 2015, Eurostat asked EU member states to provide breakdowns of total entitlements (Column I of Table 29) according to whether the recipient households are resident at home or abroad. Figure 7 shows the results for the UK, with 3% of total entitlements estimated as belonging to households resident abroad. The data sources used to produce this estimate are described in Section 8 of the methodology article. For Columns E and G, we were unable to find data on the value of pension entitlements of households resident abroad; therefore we have used overseas membership figures as a proxy.
Figure 7: Household entitlements to UK pensions end-2015, by residency of household
Source: Office for National Statistics
Download this chart Figure 7: Household entitlements to UK pensions end-2015, by residency of household
Image .csv .xlsNotes for: UK pension entitlements or liabilities in 2015 (headline figures)
Individual and Group SIPPs are not at present separately identified in the UK National Accounts and it has not been possible to include them in Table 29.
This is based on dividing total State Pension liability by the number of people aged 16 and over (adults). The number of UK residents age 65 and over is adjusted (using DWP’s estimates of State Pension caseload paid outside the UK) to take into account pensioners living abroad.
Part of the rise in pension liabilities in Columns E and G was due to classification decisions, whereby schemes were classified to these columns and their liabilities were transferred in (see Section 10).
Includes drawdown.
8. Defined benefit methodology
Actuarial assumptions and sensitivity analysis
The discount rate
The estimates of entitlements or liabilities for defined benefit (DB) pensions (other than annuities) in Columns B, E, G and H are based on actuarial calculations. While actuarial calculations produce internationally accepted estimates of pension liabilities for DB schemes, interpreting the results is not straightforward. This is because actuarial methods involve modelling based on assumptions. In particular, in the case of pensions, they involve projections of streams of payments over a time horizon of up to 100 years discounted to give a “present value” using a chosen discount rate.
The present value (PV) at time (t) of a payment (P) payable one year in future (at t+1) is calculated as:
Where (r) is the discount rate chosen for the calculation.
Columns E, G and H
For estimating pension liabilities where government is the pension manager, there is an EU-level requirement to use a stable discount rate of 3% (real), 5% (nominal). This is relatively straightforward for State Pensions, as the discount rate can be changed in the Department for Work and Pensions (DWP)’s models; but for workplace pension schemes where government is the pension manager (funded and unfunded), it is necessary to convert results from the bases on which they were originally calculated in scheme accounts and valuations onto the “common discount rate” basis (see Sections 5 and 6 of the methodology article).
According to the Technical Compilation Guide for Pension Data in National Accounts (PDF, 424KB) published by Eurostat and the European Central Bank in 2011, the choice of discount rate is “one of the most crucial assumptions for estimating pension entitlements, since its accumulated impact over many decades can be quite high”. Variations in the discount rate produce big changes in the actuarial estimate of pension liabilities. Figures 8, 9 and 10 and these tables show the sensitivity of Columns E, G and H liabilities respectively to a plus or minus 1 percentage point change in the discount rate with respect to the central requirement (5% nominal discount rate).
Eurostat’s decision not to change the discount rate for government-managed pension schemes over the 2010 to 2015 period means that for Columns E, G and H, estimates of pension entitlements or liabilities can be compared on a like-for-like basis with respect to the discount rate over this time period.
Figure 8: Column E pension entitlements, end-2015
Source: Office for National Statistics
Notes:
- Figures are provisional and may be adjusted following publication of the schemes’ triennial valuations (see Section 5 of the methodology article).
Download this chart Figure 8: Column E pension entitlements, end-2015
Image .csv .xls
Figure 9: Column G pension entitlements, end-2015
Source: Office for National Statistics
Notes:
- Figures are provisional and may be adjusted following publication of the schemes’ triennial valuations (see Section 6 of the methodology article).
Download this chart Figure 9: Column G pension entitlements, end-2015
Image .csv .xls
Figure 10: State Pension entitlements, end-2015
Source: Office for National Statistics
Download this chart Figure 10: State Pension entitlements, end-2015
Image .csv .xlsColumn B
For estimating the liabilities of DB pension funds where government is not the pension manager (Column B), the European System of Accounts (ESA 2010) requires the use of a nominal “risk-free” discount rate based on the yield on high-quality government or corporate bonds with 10-year terms or more. The estimates of liabilities from the Pension Protection Fund’s (PPF’s) Purple Book that are used to compile Column B (S.129) are consistent with this approach. There are around 5,800 DB schemes in the Purple Book universe and the discount rates used vary between them (Section 3 of the methodology article). ONS estimates a representative nominal discount rate for these schemes based on yields on 15-year fixed interest gilts. In 2015, this was 2.2%, down from 4.4% in 2010.
The changes in the Column B discount rate and the fact that pension liability estimates are extremely sensitive to such changes make it difficult to compare estimates of Column B pension liabilities over time. It also means that estimates of liabilities (or entitlements) for workplace pensions where government is not the pension manager and the nominal discount rate in 2015 was around 2.2% are not strictly comparable with those for workplace pensions in Columns E and G, where government is the pension manager and the nominal discount rate in 2015 was 5%.
Impact on household contribution supplements and saving
The discount rate used for the actuarial calculations of DB pension schemes has a direct impact on the estimation of Row 2.4 “household social contribution supplements”, which, if the schemes are in the core accounts, feeds into main indicators such as household saving. Before actuarial modelling was introduced for national accounts estimates of DB pensions, this line was equivalent to “property income” (interest and dividends paid on funds’ investments). This is still the case for defined contribution (DC) pensions; but for DB pensions under ESA 2010, Row 2.4 represents the “unwinding of the discount rate” (see Glossary) and is calculated by multiplying the opening balance in Row 1 by the nominal discount rate. For example, in 2015, household social contribution supplements were calculated as 2.2% of pension liabilities at the beginning of the year for Column B schemes compared with 5% of pension liabilities at the beginning of the year for Column E schemes.
Other actuarial assumptions
In addition to the discount rate, there are two other main financial assumptions used in the actuarial calculations of DB schemes that have a major impact on pension liability estimates:
indexation (“uprating”) of benefits payable in future, which may be linked to inflation, earnings growth or a combination of these – as in the case of the State Pension triple lock policy, which uses Consumer Prices Index (CPI) inflation, earnings growth or 2.5% (whichever is higher)
salary uprating or wage or earnings growth assumptions, indicating how salaries of scheme members who have not yet reached retirement are expected to grow up to retirement1
These assumptions are usually scheme-specific. In the case of the State Pension, there are different financial assumptions used for each component of the model (see Sections 9 to 13 of the methodology article), and changes in these assumptions can have a considerable impact on liabilities (see Section 10). In the case of workplace pensions where government is the pension manager, some financial assumptions are scheme-specific while others may be shared by several schemes in the same category (see Sections 5 and 6 of the methodology article).
In addition to financial assumptions, DB pension liability estimates change when demographic assumptions, in particular life expectancy, are updated. For State Pensions, DWP updates these assumptions when ONS updates its population projections (see Section 10). For non-state pensions, demographic assumptions are specifically calculated for the membership of each pension scheme and updated by the actuary compiling the scheme accounts or valuation. However, changes in demographic assumptions are not always separately identified in pension scheme accounts.
Section 10 shows how changes in financial assumptions are recorded in Table 29 Row 8 “changes in entitlements due to revaluations” and demographic assumptions are recorded in Row 9 “changes in entitlements due to other changes in volume”. It provides examples of the impact of changes in these assumptions between 2010 and 2015 on the estimates of pension liabilities or entitlements.
Rule changes and reforms for DB schemes
In addition to financial and demographic assumptions, the estimates of DB pension scheme liabilities shown in Table 29 (particularly for pensions where government is the pension manager) may be affected by reforms and rule changes known as “negotiated changes in scheme structure”. These are changes that have been agreed between the interested parties or approved by the legislature (Parliament in the UK). Any such changes that affect past service cost are recorded in Row 7 of Table 29.
The changes recorded in Row 7 apply to entitlements accrued in the past, not to entitlements that will be accrued in future. This is in line with the accrued-to-date (closed system) approach. However, reforms designed to improve fiscal sustainability of government-managed pensions by reducing future service cost are not included, reinforcing the cautionary message that Table 29 is not an appropriate tool for fiscal sustainability analysis (see Section 6).
Section 10 shows how specific UK reforms and rule changes have been recorded in Row 7 of Table 29 “changes in entitlements due to negotiated changes in scheme structure” and their impact on the estimates of pension liabilities or entitlements.
Notes for Defined benefit methodology
- This may be on a projected benefits obligation (PBO) basis, which takes into account future salary increases due to career development; or an accumulated benefits obligation (ABO) method, which does not. In the UK, the PBO basis is used for workplace pension schemes.
9. Defined contribution methodology
In Table 29, estimates for defined contribution (DC) pensions relate to pension pots building up during peoples’ working lives and drawdown in retirement (see Section 2 of the methodology article). Annuities paid out in retirement (after DC pension pots are converted to annuity entitlements) are treated as defined benefit (DB) rather than DC pensions following a Eurostat ruling in 2016. The rationale for this is that insurers assume the risk during retirement by promising to pay defined pension benefits in the form of annuities.
Figure 11 shows DC pension liabilities, which are equal to the assets building up as pension pots during working lives (including drawdown but excluding annuities). The largest category of DC pensions shown in Figure 11 is individual personal pensions (IPPs) provided by insurers in S.128 (not in Table 29), estimated at 16% of gross domestic product (GDP) in 2015. Workplace pensions provided by insurers (in Table 29, Column A) were worth an estimated 11% of GDP in 2015. DC pension pots associated with workplace pensions provided by pension funds in S.129 (also in Table 29, Column A) were only worth some 2% of GDP, but this proportion is expected to grow rapidly in future as assets in multi-employer master trusts build up.
Figure 11: UK DC pension liabilities excluding annuities at end-2015, by type of pension and provider
Source: Office for National Statistics
Notes:
- The estimate for "workplace pensions provided by pension funds" is provided to ONS by The Pensions Regulator, based on work done for its publication DC Trust, and includes pensions provided by master trusts.
- Excludes SIPPs.
Download this chart Figure 11: UK DC pension liabilities excluding annuities at end-2015, by type of pension and provider
Image .csv .xlsIt is important to note that the DC workplace pension liabilities shown in Table 29 Column A are not strictly comparable with the DB workplace pension liabilities shown in the other parts of the table. This is because while DB pension liabilities are calculated actuarially using a set of assumptions (see Section 8), DC liabilities are simply equal to the market value of the assets. This is the information shown in Rows 1 and 10 for Column A.
The different approach also has implications for the other rows of Column A:
Row 7 “changes in entitlements due to negotiated changes in scheme structure” for DB schemes and Row 9 “changes due to other changes in volume” (mainly demographic assumption changes for DB schemes) are, by definition, zero for DC pensions
Row 8 “changes in entitlements due to revaluations” does not show financial assumption changes, as in the case of DB schemes; instead it shows any changes in the capital value of assets during the year (holding gains and losses), and is calculated as a residual after taking into account contributions, property income (interest and dividends), benefits and transfers
as liabilities are, by definition, equal to assets for DC pensions, there can be no pension deficit or surplus and Row 2.2 “employer imputed social contribution” does not apply
10. Trends over time (government-managed schemes)
This section uses the information in Table 29 to explain changes in pension entitlements or liabilities of schemes managed by government between end-20091 and end-2015. This is possible because of the use of a stable discount rate (3% real, 5% nominal). As the discount rate does not change from year to year, any other changes are not obscured by changes in discount rates.
Column E
The pension schemes in Column E are funded defined benefit (DB) workplace schemes where government is the pension manager. The largest scheme in this column is the Local Government Pension Scheme (LGPS), but Column E also includes a number of other funded schemes classified to local and central government as the pension manager (see Section 5 and Section 5 of the methodology article). The value of Column E pension liabilities rose by 27% between 2010 and 2015, following a decrease in 2010 (Figure 12 and UK National Accounts Table 29: Column E).
Figure 12: Column E pension liabilities at end-year, 2009 to 2015
Source: Office for National Statistics
Notes:
- The figures for 2013 onwards are provisional and may be adjusted following publication of the schemes’ triennial valuations.
Download this chart Figure 12: Column E pension liabilities at end-year, 2009 to 2015
Image .csv .xlsThe decrease in 2010 is explained by a reform that changed the basis used for the indexation of pensions for public sector employees from the Retail Prices Index (RPI) to the Consumer Prices Index (CPI). This reduced the value of pension liabilities by an estimated £22 billion. As a negotiated change or reform reducing past service cost, this is reported as a negative value (Figure 13).
Figure 13: Components of change in Column E pension liabilities, 2010 to 2015
Source: Office for National Statistics
Notes:
- The figures for 2013 onwards are provisional and may be adjusted following publication of the schemes’ triennial valuations.
- The labels shown here correspond to the following rows of Table 29: Contributions received: Row 2; Pension benefits paid: Row 4; Transfers (net): Row 6; Negotiated changes/reforms: Row 7; Financial assumption changes: Row 8; Demographic assumption changes: Row 9.
Download this chart Figure 13: Components of change in Column E pension liabilities, 2010 to 2015
Image .csv .xlsAnother one-off change in Column E took place in May 2012, with the transfer of the pension manager for the Audit Commission Pension Scheme to central government. This resulted in the positive net transfer value that can be seen in Figure 13.
Otherwise there were no major changes over this period. Each year the present value of liabilities (or entitlements) rose, reflecting contributions received to cover current service cost less pension benefits paid. There were also small positive changes in the demographic assumptions used by the actuaries, leading to increases in the actuarial estimates of pension liabilities. On average £1.6 billion of “employer imputed social contributions” was recorded between 2010 and 2015, reflecting a shortfall in actual contributions received (net of service charges), as well as possible experience effects2.
Column G
The schemes in Column G are unfunded, centrally-administered pension schemes for government employees (see Section 5). The value of Column G pension liabilities fell in 2010 reflecting – as in the case of Column E – the move from RPI to CPI; this reduced liabilities by £97 billion, recorded in the negotiated changes and reforms line (Figure 14). Another important one-off change was the move of the Royal Mail Statutory Pension Scheme to central government in April 2012, which was reported as a transfer.
Figure 14: Column G pension liabilities at end-year, 2009 to 2015
Source: Office for National Statistics
Notes:
- The figures for 2013 onwards are provisional and may be adjusted following publication of the schemes’ triennial valuations.
Download this chart Figure 14: Column G pension liabilities at end-year, 2009 to 2015
Image .csv .xlsFor most of the unfunded pension schemes for government employees in Column G, estimates are compiled using the schemes’ annual resource accounts (see Section 6 of the methodology article). Where actuarial assumptions change during the year, the resource accounts do not always report these changes in enough detail for compiling Rows 8 and 9 of Table 29 (financial assumption changes and demographic assumption changes respectively). Also some assumption changes are not separately identified but are allocated to “experience effects”. The current estimates show negative changes in financial assumptions every year from 2010 to 2015 and in most years for demographic assumptions (Figure 15)3.
Figure 15: Components of change in Column G pension liabilities, 2010 to 2015
Notes:
- The figures for 2013 onwards are provisional and may be adjusted following publication of the schemes’ triennial valuations.
- The labels shown here correspond to the following rows of Table 29: Contributions received: Row 2; Pension benefits paid: Row 4; Transfers (net): Row 6; Negotiated changes/reforms: Row 7; Financial assumption changes: Row 8; Demographic assumption changes: Row 9.
Download this chart Figure 15: Components of change in Column G pension liabilities, 2010 to 2015
Image .csv .xlsEmployer imputed social contributions (Row 2.2) for Column G schemes were positive in 2010 to 2012 (£9 billion on average, see UK National Accounts Table 29: Column G), probably reflecting a shortfall in actual contributions received (net of service charges). From 2012, household (employee) actual contributions were increased for most schemes in Column G5. In 2013 to 2015, employer imputed social contributions became negative (negative £11 billion on average), suggesting that either more actual contributions than required were being paid in or that there were experience effects, which may be explained when data from the next triennial valuations becomes available.
Column H
Column H contains estimates for unfunded social security pensions. In the case of the UK, this is the State Pension system. People of working age in the UK contribute to the State Pension through National Insurance (NI) contributions, except in certain circumstances when contributions are “credited” (see Section 5).
The estimates for Column H come from the Department for Work and Pensions’ (DWP’s) State Pensions forecasting models, which comprise models used for the pre-2016 State Pension and a model for the new State Pension introduced by the Pensions Act 2014 (see Sections 9 to 13 of the methodology article).
These models are used for DWP’s long-term expenditure projections, which feed into the Office for Budget Responsibility (OBR)’s fiscal sustainability reports, and for DWP's impact assessments. However, they have to be adapted to produce estimates for Table 29, which requires accrued-to-date (closed system) estimates rather than fiscal sustainability (open system) estimates (see Section 6). As the accrued-to-date approach does not take into account pension entitlements that will be built up in future by today’s workers and future contributors, the results presented here are not directly comparable with those published in the OBR’s fiscal sustainability reports and DWP’s impact assessments, which take future accruals into account.
Figure 16: Column H pension liabilities at end-year, 2009 to 2015
Source: Office for National Statistics
Notes:
- The vertical lines between 2010 and 2011, 2012 and 2013, and 2013 and 2014 represent structural breaks. The first two are due to differences in the order in which in-year changes were modelled in the pre-2016 state pension model. The third is due to the transition from the pre-2016 state pension model to the new state pension model for "inflows" (see Sections 9 to 13 of the methodology article).
Download this chart Figure 16: Column H pension liabilities at end-year, 2009 to 2015
Image .csv .xlsThe models suggest that the value of Column H pension liabilities rose between end-2009 and end-2011, to reach nearly £4.2 trillion and then stabilised before falling to £4 trillion at the end of 2015 (Figure 16 and UK National Accounts Table 29: Column H). However, some caution is required in interpreting these results because of structural breaks in the series. The breaks between 2010 and 2011 and between 2012 and 2013 reflect changes in the modelling procedure (the order in which each in-year change was modelled); these are thought to be of relatively minor importance. The break between 2013 and 2014 is more significant, as it reflects the transition from the pre-2016 State Pension model to the new State Pension model (see Section 7 of the methodology article).
Figure 17: Components of change in Column H pension liabilities, 2010 to 2015
Source: Office for National Statistics
Notes:
- The labels shown here correspond to the following rows of Table 29: Actual contributions received: Rows 2.1 and 2.3; Household contribution supplements: Row 2.4; Balancing item: Row 3; Pension benefits paid: Row 4; Transfers (net): Row 6; Negotiated changes or reforms: Row 7; Financial assumption changes: Row 8; Demographic assumption changes: Row 9.
- The vertical lines between 2010 and 2011, 2012 and 2013, and 2013 and 2014 represent structural breaks. The first two are due to differences in the order in which in-year changes were modelled in the pre-2016 state pension model. The third is due to the transition from the pre-2016 state pension model to the new state pension model for "inflows" (see Sections 9 to 13 of the methodology article).
Download this chart Figure 17: Components of change in Column H pension liabilities, 2010 to 2015
Image .csv .xlsFigure 17 shows the components of change in State Pension liabilities each year from 2010 to 2015. As Column H is compiled differently from the other columns of Table 29, the components are different from those shown for Columns E and G. As noted previously, the components of change have been calculated using a “closed system” approach and are not directly comparable with figures calculated using an “open system” approach such as those found in DWP’s impact assessments.
Figure 17 shows that actual contributions received and benefits paid are stable over time. Household contribution supplements are calculated to reflect the “unwinding of the discount rate” (5% of the balance of pension liabilities at the beginning of the year), so any changes in this line reflect changes in the opening balance.
The main changes in Figure 17 relate to negotiated changes and reforms (Row 7 of Table 29), changes in financial assumptions (Row 8), changes in demographic assumptions (Row 9) and the residual or balancing item (Row 3).
Negotiated changes and reforms
There was an increase of £33 billion in 2010 because the introduction of the “triple lock” policy for indexation of Basic State Pension (BSP) benefits added £162 billion to entitlements, which more than outweighed a fall of £124 billion due to the change from the RPI to the CPI for indexation of Additional Pension (AP) benefit payments4.
There was a reduction of £8 billion in 2011 due to changes in the Pensions Act 2011, which accelerated the equalisation of women’s State Pension Age (SPA) with men’s by 18 months and brought forward the increase in men’s and women’s SPA to 66. Under the 2011 Act, SPA equalises by November 2018 and reaches 66 by October 2020.
There was a reduction of £43 billion in 2014 due to changes in the Pensions Act 2014, which brought forward the increase in SPA from 66 to 67 so that it takes place between 2026 and 2028 rather than 2034 and 2036.
Changes in financial assumptions
There was a reduction of £448 billion in 2012, explained by a fall in the long-run uprating factor (indexation assumption) for pension benefits from 5.02% to 4.75%. This highlights how sensitive such models are to changes in financial assumptions other than the discount rate.
There was a reduction of £265 billion in 2015, explained by updating of the economic assumptions used from those in the 2015 Budget and fiscal sustainability report to those used in the 2016 Budget and January 2017 fiscal sustainability report, in particular a change in the long-run uprating factor for pension benefits from 4.89% to 4.64%.
Changes in demographic assumptions
The State Pension models rely on ONS population projections, which are updated every two years.
The 2012 update added £114 billion to liabilities, reflecting an increase in the number of pensioners in ONS’s 2012-based population projections.
The 2014 update reduced liabilities by £149 billion reflecting a reduction in projected life expectancy in ONS’s 2014-based population projections compared with the 2012-based population projections, reducing the number of people expected to live to older ages.
The residual or balancing item
Row 3 in Figure 17 captures:
- the increase in entitlements for people who do not make National Insurance (NI) contributions through work (for instance, people of working age who are unemployed, looking after children or caring for elderly relatives); these people are credited with qualifying years for State Pensions
- for working people, the difference between the actual value of NI contributions made by them or their employers and what they will receive as a result of these contributions
- experience effects (where the outcome differs from the modelling assumptions) and model changes or corrections
The first of these should always show positive values and should not vary much over time. The second may have either positive or negative values but, like the first, should not vary much over time. Only the third is likely to vary from one year to the next (and may have positive or negative values). Therefore the result shown in Figure 17 for Row 3 – high negative values in 2013 and 2014, following positive values in 2010 to 2012 – is unexpected. The main reasons for this pattern are:
in 2013, DWP made a significant correction to the model, which had the effect of reducing the estimate of liabilities by around £200 billion; this turned Row 3 negative
in 2014, the new State Pension brought in by the Pensions Act 2014 was introduced – even though no pensions were paid under the new system until April 2016 ¬– because the national accounts approach requires changes to be taken on when they are legislated (see Sections 9 to 13 of the methodology article); the introduction of the new State Pension produced a negative figure of £87 billion, which was treated a model change and allocated to Row 36
The unexpected Row 3 pattern may, at least in part, reflect the fact that DWP’s State Pension models were originally designed for fiscal sustainability analysis rather than to produce results on an accrued-to-date basis. The modelling team at DWP is confident that the Table 29 results for 2015 are robust, although the historical series (before 2015) may be imperfect.
Notes for Trends over time (government-managed schemes)
Although Table 29 is only compiled for the years 2010 onwards, in Figures 12, 14 and 16 we include end-2009 on the assumption that it is equal to the opening balance for 2010.
Experience effects, often referred to as experience gains and losses, reflect differences in the outcome because some actual changes turn out to be different from those assumed in the actuarial model.
ONS has worked with GAD to produce the estimates required for Table 29, including Rows 8 and 9 and the residual Row 2.2 “employer imputed social contributions”. This work is as complete as it can be with the information currently available, but results may have to be adjusted from 2013 onwards following publication of the schemes’ triennial valuations (which are not yet available).
BSP and AP are the two largest components of the pre-2016 state pension. See Section 7 of the methodology article for details.
The main exception was the Armed Forces; see House of Commons research briefing Public service pension reform – 2010 onwards.
There was some discussion about how to treat this figure. The new State Pension was the result of legislated reform, so in theory it should appear in Row 7 of Table 29. However, in practice it was not possible to separate out the “reform” element from the effect of the move from the pre-2016 State Pension model to the new State Pension model: the £87 billion figure includes both. Therefore it was decided to include it in Row 3.
11. Future work
Office for National Statistics (ONS) intends to continue producing and publishing Table 29. The results will feed into our wider programme of improving pension estimates in the UK’s core National Accounts (Blue Book series) and, more generally, improving our economic and financial statistics. By developing a fuller picture of pensions in the UK, ONS also aims to improve the understanding of the macro-economic impact of pensions and inform decisions in the business and policy worlds.
Back to table of contents12. Annex 1: Differences between Table 29 and other presentations
Information on pension scheme entitlements or liabilities and on related transactions and other flows can be found in other official publications. This annex sets out in brief the main differences between the approach followed in Table 29 and those of:
- the UK National Accounts (core national accounts tables) produced by the Office for National Statistics (ONS)
- the Whole of Government Accounts (WGA) estimates produced by Her Majesty’s Treasury
The UK National Accounts (core national accounts tables)
It should be possible to compare results for Table 29 Columns A to E (funded pensions) with those published in the core national accounts. In 2012, at the time of publication of the experimental Table 29 for 2010, the core national accounts still calculated liabilities of defined benefit (DB) pension schemes as equal to the market value of assets. However, improvements were made in Blue Book 20141. These introduced into the core accounts the actuarial basis for calculating defined benefit pension scheme liabilities, in line with the method used for Table 29. Therefore, there is broad consistency between the information shown in the core national accounts (Blue Book 2017) and Table 29.
The main exception is that “employer imputed social contributions” (D6121 in the core accounts) continue to be calculated in the core accounts as percentage of wages and salaries, a “second best” method permitted under the European System of Accounts 2010 (ESA 2010) and used by many countries. This means that D6121 is not comparable with Row 2.2 in Table 29. However, ONS is gradually moving the calculations in the UK core accounts onto the “first best” basis, starting with funded DB pensions where government is the pension manager (in Blue Book 2018).
At present there is one other area of inconsistency between Table 29 and the core accounts: pension benefits are lower in Table 29 Row 4 than in D622 in the core accounts, due mainly to the identification (during work on Table 29) of an overestimate in the core accounts data feed for pension benefits provided by insurance companies. Now that the issue has been identified, we will work to revise the data in the core accounts in line with the estimates in Table 29.
In both cases, the inconsistencies that will remain after publication of Blue Book 2018 later this year relate to funded DB pensions where non-government is the pension manager (Column B in Table 29). In Blue Book 2018, the estimates for funded DB pensions where government is the pension manager will be consistent with the estimates published in Column E of Table 29.
In theory, the D8 adjustment for the changes in pension entitlements (see Section 14: Glossary) in the core accounts, which feeds into the calculation of household savings and the household saving ratio, should be equal to Row 5 in Table 29. However, as D6121 and D622 have not yet taken on the improvements made for Table 29, D8 is not consistent with Row 5 of Table 29 at present.
Whole of Government Accounts estimates
HM Treasury produces estimates of the government’s pension obligations in its WGA series. These are not comparable with Table 29 because the approaches used are different in respect of:
the discount rate
gross and net liabilities
scope of accounts
reporting of in-year flows
State Pensions
These will be discussed in more detail in this section.
The discount rate
Table 29 uses a stable discount rate (3% real, 5% nominal) and the estimates for DB pension schemes where government is the pension manager are converted onto this basis. By contrast, the WGA sources data from the accounts compiled by central government bodies and local authorities, which vary from year to year and (particularly for local authorities) use different rates as advised by their own actuaries at the time of compiling the accounts.
Gross and net liabilities
Table 29 shows gross pension liabilities (see Section 9), whereas the WGA presents information for net pension liabilities. Net is the same as gross in the case of unfunded pension schemes where there are no assets; but for funded schemes such as the Local Government Pension Scheme (LGPS), the net figures represent the deficit (assets minus liabilities).
Scope of accounts
The two approaches are similar in terms of which public sector employee schemes are included in the accounts, but for the Local Government Pension Scheme (LGPS), police and firefighters’ pension schemes, the WGA approach excludes the obligations in respect of private sector employees who belong to public sector employee schemes. Table 29 follows the “pension manager” approach, where the government is seen as ultimately responsible for pension liabilities in respect of all employees who are members of the schemes in Columns E and G.
Reporting of in-year flows
Table 29 shows all flows relating to pensions during the year (Rows 2 to 9 of the table), whereas in the WGA approach any payments and receipts within the public sector are consolidated out of the accounts.
State Pensions
The WGA information does not include estimates of obligations with respect to State Pensions.
As part of work to produce Table 29, ONS has had access to WGA data and results have been compared. We are confident that where comparisons are possible, the results are consistent.
Notes for Annex 1: Differences between Table 29 and other presentations
- See articles published by the Office for National Statistics in April 2014 and September 2014 for more information.
13. Annex 2: Classifications
The Office for National Statistics’ Economic Statistics Classifications Committee (ESCC) is responsible for determining whether pensions-related organisations are classified to the general government (central government or local government) and public corporations sectors of the core national accounts.
There are two levels of classification for pension schemes: “pension administrator” and “pension manager” (see Section 14: Glossary). The latter is the most important for Table 29 because it determines whether funded defined benefit (DB) pension schemes appear in Column B (pension manager not in general government) or in Column E (pension manager in general government).
The ESCC has made the following classification decisions in respect of pensions-related organisations:
Table 1: Classification of pensions-related organisations according to the Economic Statistics Classifications Committee
| Name of scheme or fund | Pension manager sector | Pension administrator sector | Column of Table 29 |
|---|---|---|---|
| BT Pension Scheme (The) | S.11002 | S.12902 | B |
| Pension Protection Fund | S.12001 | S.12901 | B |
| Local Government Pension Scheme (LGPS) | S.1313 | S.12901 | E |
| Transport for London (TfL) Pension Fund | S.1313 | S.12901 | E |
| BBC Pension Scheme | S.1311 | S.12901 | E |
| National Museum of Wales Pension Scheme | S.1311 | S.12901 | E |
| The British Coal Staff Superannuation Scheme | S.1311 | S.12901 | E |
| Mineworker's Pension Scheme | S.1311 | S.12901 | E |
| The National Library of Wales Staff Superannuation Scheme | S.1311 | S.12901 | E |
| Audit Commission Pension Scheme (The) | S.1311 | S.12901 | E |
| Bradford and Bingley Pension Scheme | S.1311 | S.12901 | E |
| Railway Pension Scheme (RPS) – 1994 Pensioners Section | S.1311 | S.12902 | E |
| RPS – BR Section | S.1311 | S.12902 | E |
| RPS – British Transport Police Section | S.1311 | S.12902 | E |
| RPS – East Coast Main Line Section | S.1311 | S.12902 | E |
| RPS – London Underground Section | S.11001 | S.12902 | See Note 1 |
| RPS – Network Rail Section | S.1311 | S.12902 | E |
Notes:
The London Underground Section of the RPS should appear in Column B but it cannot be separately identified from the rest of the RPS so it is included in Column E.
S.11001 equals public non-financial corporations (part of non-financial corporations sector S.11).
- S.11002 equals private non-financial corporations (part of non-financial corporations sector S.11).
- S.12001 equals public financial corporations (part of financial corporations sector S.12).
- S.12901 equals public pension fund (part of financial corporations sector S.12).
- S.12902 equals private pension fund (part of financial corporations sector S.12).
- S.1311 equals central government (part of general government sector S.13).
- S.1313 equals local government (part of general government sector S.13).
Further information is available from the Economic statistics classifications page and from the Public sector classification guide.
Back to table of contents14. Glossary
Accrued-to-date basis
The accrued-to-date basis for calculating pension liabilities in the national accounts – also known as the “closed system” approach – takes into account the pension benefits that will be paid in future to people who are already retired and people of working age (with respect to their entitlements from service to date); but it does not take into account any future accruals of entitlements. See also fiscal sustainability approach.
Active membership
Active members are current employees who would normally contribute (or have contributions made on their behalf) to a pension scheme.
Additional Voluntary Contributions (AVCs)
An AVC is a pension top-up arrangement where an employee pays additional amounts into a pension run by their employer.
Auto-enrolment
Automatic enrolment is a UK government programme, phased in between 2012 and 2018, whereby it becomes compulsory for employers to enroll eligible employees into a pension scheme. Employees are enrolled automatically, but can opt out if they choose to do so. The programme was introduced with low minimum contribution rates: 2% initially, with 1% coming from the employer. Rates are rising and will reach 8% (3% from the employer) by April 2019.
Annuities
An annuity is a financial instrument provided by an insurance company that pays a guaranteed annual income to the holder (normally in retirement). Pension annuities are treated as defined benefit by Eurostat because the rules specify the rate of benefits to be paid.
CETV transfers
Cash Equivalent Transfer Value (CETV) transfers occur when members of defined benefit schemes transfer their money out as a cash equivalent. They can do this under certain rules, as set out by The Pensions Regulator. Money transferred out may be invested at home (in a pension scheme that may not be employment-related) or abroad, via a QROPS.
Contract-based pensions
See personal pensions for information on contract-based pensions.
Contracted out
In the past, private pension schemes could be “contracted out” of the state earnings-related Additional Pension (AP) if they provided members with a pension at least equivalent to what they would have got by remaining in the AP. The members’ and employers’ National Insurance contributions were reduced or partially rebated.
Contracted out deduction
The contracted out deduction refers to a reduction in the starting amount of new State Pension entitlement for members of schemes that were contracted out of state earnings-related AP.
Consumer Prices Index (CPI)
The Consumer Prices Index (CPI) is used to estimate consumer price inflation, the rate at which the prices of goods and services bought by households rise or fall.
D8 adjustment for the changes in pension entitlements
This is a mechanism in the core accounts (for funded pensions only), which takes pension contributions and contribution supplements out of household disposable income, while retaining pension benefit payments; and adds contributions to household saving (removing benefit payments). The D8 adjustment is equal to Row 5 of Table 29, which equals Row 2 (net of service charge) minus Row 4.
Deferred membership
Deferred members of pension schemes are those who have accrued entitlements that will come into payment in future, but who are no longer actively contributing (or having contributions paid on their behalf) into the scheme.
Defined benefit (DB) pension schemes
Defined benefit (DB) pension schemes are workplace schemes in which the rules specify the rate of benefits to be paid. The benefits promised to members must be paid in retirement irrespective of the performance of any invested funds.
The most common DB scheme is one in which the benefits are based on the number of years of pensionable service, the accrual rate and final salary. However, Career Average Revalued Earnings schemes are becoming increasingly common in the UK. These base the pension on earnings over the whole career, adjusted by prices or earnings.
Defined contribution (DC) pension schemes
Defined contribution (DC) pension schemes are those in which the benefits are determined by the contributions paid into the scheme, the investment performance and the type of product chosen at retirement (such as an annuity or drawdown product). DC pensions are also known as money purchase pensions. They may be individual or workplace pensions; and they include money purchase AVCs.
Discount rate
A rate used to reduce an amount of money at a date in the future to an equivalent value in the present (present value). It represents the idea that people place more value on consuming goods and services today than in the future; therefore, future value should be “discounted” to give an equivalent present value.
Drawdown
An arrangement where an individual does not buy an annuity with their pension pot on retirement, but instead draws down money from the fund in the form of lump sum cash and/or variable income payments.
Economic Statistics Classifications Committee (ESCC)
The Economic Statistics Classifications Committee (ESCC) decides where pension schemes (and other organisations) are classified in the national accounts. See Annex 2: Classifications for more information.
ESA 2010
The European System of Accounts (2010) is the latest version of the European Union standard for the national accounts.
Eurostat
Eurostat is the statistical agency of the European Union.
Fiscal sustainability approach
The fiscal sustainability or “open system” approach looks at whether projected future receipts of contributions and tax payments, together with any funds accumulated to date and growth of funds in future, will be sufficient to meet projected future benefit payments (including those resulting from future accruals of entitlements). See also accrued-to-date basis.
Funded
Funded pensions are those where benefits are met from a fund built up in advance from contributions and the return on investments. The fund may be worth more or less than the pension liabilities (that is, there may be a financing surplus or deficit). See also unfunded.
Group personal pension (GPP)
A group personal pension (GPP) is an arrangement made for the employees of a particular employer or group of employers to participate in a personal pension on a group basis. Although the employer facilitates the arrangement and makes contributions, the contract is between the individual and the pension provider, normally an insurance company.
Household pension entitlement
In the national accounts, all pensions involve a household pension entitlement. For defined benefit pensions, they are measured as the actuarial value of the scheme’s liability towards the household up to the date of the accounts. For defined contribution pensions, they are simply equal to the assets in the pension pot at the date of the accounts.
Hybrid
Hybrid pension schemes are those offering a choice, or mixture, of defined benefit and defined contribution rights at retirement. In Table 29, hybrid schemes are included with DB schemes.
Individual personal pension (IPP)
Individual personal pensions (IPP) are personal pensions that are not organised through an employer. In the past, these have been the main pension option for the self-employed, although individual self-invested personal pensions (SIPPs) are an alternative to IPP, which are growing in popularity.
Liability (pension)
Pension liabilities are the estimate of providers’ total pension obligations outstanding at a point in time. When measured gross (as in Table 29), they are equal to household pension entitlements.
Mandatory pension schemes
Schemes to which people are obliged to belong and into which they must pay contributions during their working lives, except in certain clearly-defined circumstances (see also voluntary pension schemes).
Master trust
A multi-employer occupational, trust-based pension scheme with one legal trust and board of trustees covering the staff of many unconnected employers. Several large master trusts, including the government’s NEST pension scheme, have been established since 2012 as part of the government’s auto-enrolment policy.
Pension administrator
The pension administrator in the context of the national accounts is the organisation that runs a workplace pension scheme or fund, taking the day-to-day management decisions. The classification of the pension administrator is decided by the Office for National Statistics Economic Statistics Classifications Committee (see Annex 2: Classifications for more information) and may be different from that of the pension manager.
Except for multi-employer pension schemes, pension schemes or funds themselves are assumed in the national accounts to be mere administrators; as such, they are not responsible for the deficit nor are they entitled to keep the surpluses.
Pension manager
The pension manager is a concept central to the ESA 2010 treatment of pensions in the national accounts and Table 29. It refers to whether general government or non-general government is ultimately responsible for the pension obligations, more specifically for any deficit. A scheme’s pension manager is decided by the Office for National Statistics Economic Statistics Classifications Committee (see Annex 2: Classifications for more information).
Whilst in most cases workplace pension schemes are pension administrators and the associated employer is the pension manager, multi-employer pension schemes or funds that collect contributions from multiple employers may be seen as pension managers.
Personal pensions
Pensions where the legal contract is between the individual and the pension provider, usually an insurance company, even if the arrangement is facilitated through an employer. Personal pensions may be group personal pensions or individual personal pensions. They are also known as contract-based pensions.
Present value
The equivalent in today’s money of a future sum of money or series of payments or receipts, when discounted at a rate designed to represent people’s time preferences (the value that people put on consuming goods and services today compared with consuming them in future); see also discount rate.
Preserved pension entitlements
Entitlements of people with deferred membership of a pension scheme that will lead to benefits being paid in future.
Public sector
In the UK, the public sector consists of five sub-sectors: central government, local government, public non-financial corporations, Bank of England and public financial corporations (or public sector banks).
QROPS
Since April 2006, people residing in the UK have been able to transfer their pension savings in a registered pension scheme to a Qualifying Recognised Overseas Pension Scheme (QROPS).
Replacement rate
The ratio of pension benefits paid during retirement to income earned during working life. Some pension systems aim to deliver specific levels of benefit in retirement in relation to people’s wages or salaries when they were working. The replacement rate can be used to measure this.
RPI
The Retail Price Index (RPI) is a legacy index used to estimate inflation before the Consumer Prices Index (CPI).
S.12
Financial corporations sector in the core national accounts.
S.128 and S.129
S.128 is the insurance corporations sub-sector and S.129 is the pension funds sub-sector within S.12 in the core national accounts.
S.13
General government sector in the core national accounts.
S.1311 and S.1313
S.1311 is the central government sub-sector and S.1313 is the local government sub-sector within S.13 in the core national accounts.
Self-invested personal pension (SIPP)
Self-invested personal pensions (SIPPs) are a form of personal pension where the policy holder rather than the pension provider chooses the investments. SIPPs can borrow money and are often used in relation to property purchases that require mortgages. They can be provided on a group or individual basis.
SNA 2008
The System of National Accounts 2008 (SNA 2008) is the latest version of the international standard for the national accounts.
Social insurance schemes (in the national accounts)
According to ESA 2010 paragraphs 17.01 and 17.02, social insurance schemes are schemes in which participants are obliged, or encouraged, by a third party to take out insurance against certain social risks or circumstances that may adversely affect their welfare or that of their dependants. ESA 2010 identifies two types of pension in social insurance schemes: social security pension schemes and other employment-related pension schemes.
Social security pension schemes (in the national accounts)
A form of pension scheme in social insurance. According to ESA 2010 paragraph 17.02, social security schemes cover the entire community, or large sections of the community and are imposed, controlled and financed by government.
State Pension Age (SPA)
The age at which an individual can claim a State Pension.
Trust-based pension schemes
Occupational pension schemes in the private sector are also known as trust-based workplace pension schemes. They are set up under trust law by one or more employers for the benefit of their employees.
Unfunded
Unfunded pensions are those in which obligations are not underpinned by a fund or funds (there are no assets). The pension payments made by the government for unfunded pensions are financed from National Insurance contributions, pension scheme contributions and general taxation. Unfunded pensions may also be referred to as “Pay As You Go” (PAYG) pensions (see also funded).
Unwinding of the discount rate
The unwinding of the discount rate refers to the revaluation of liabilities between the start and end of each year (the increase associated with the liabilities coming closer to settlement).
Voluntary pension schemes
Schemes to which people choose to belong. In the UK, this includes schemes into which people are automatically enrolled, as they can choose to opt out of the scheme.
Back to table of contents