Table of contents
- Executive summary
- Introduction
- Methodological and other improvements affecting the sector and financial accounts
- Publication of change in volume of assets account and revaluation account
- Experimental alternative measures of the households saving ratio
- Appendix A: Estimated lending or net borrowing by sector
- Appendix B: Contributions to revisions to estimated lending or net borrowing and net worth by for selected sectors, by transaction
1. Executive summary
This article explains the main methodological changes that will be introduced in Blue Book 2017 and Pink Book 2017 for the sector and financial accounts. It provides updates to an earlier article published on 5 June 2017, and covers the period 1997 to 2015.
The UK National Accounts published on 29 September 2017 will be consistent with Blue Book 2017 and Pink Book 2017.
There are over 15 methodological changes. The largest have been separating the household and non-profit institutions serving households (NPISH) accounts and improving the data sources, especially for dividend income of self-employed; introducing the new securities dealers survey data and methods; and improving the treatment of corporate bonds, shares and dividends methods and data sources.
The main results of these changes are:
newly separated accounts for the household sector and the NPISH sector (that is, most charities and universities); for 2010 to 2015 the average difference between the saving ratio for the combined household and NPISH sector and the households-only saving ratio is only 0.1 percentage points
a significant upward revision in gross income of the household and NPISH sector, revising household net lending upwards and revising the household and NPISH saving ratio upwards by on average 0.8 percentage points from 1997 to 2015
a significant downward revision in net lending by the private non-financial corporations sector, making the sector net borrowers in several years
an upward revision to the current account deficit
revisions to the financial balance sheets of the non-government sectors
A separate article analyses the changes to the balance of payments from 1997 to 2015. Changes that affect current price (or nominal) and chained volume (CVM or “real”) gross domestic product (GDP) for the years 1997 to 2015 have already been published in an article on 6 July 2017. We also published Changes to the presentation of the tables within Blue Book 2017 and Pink Book 2017 on 6 July 2017.
Back to table of contents2. Introduction
This article is part of a series describing changes to national accounts and improvements that will be made on 29 September 2017 when we publish revised estimates, including gross domestic product (GDP), the sector and financial accounts and the Balance of Payments.
Changes will be made in line with international standards adopted by all EU member states and with worldwide best practice. These changes, as well as additional improvements that are being made, will ensure that the UK National Accounts continue to provide a reliable framework for analysing the UK economy and comparing it with the economies of other countries. This article focuses on the impact of methodological improvements to the sector and financial accounts. It provides a summary of each of the main improvements being implemented alongside the indicative overall impact and revisions to net lending or net borrowing.
The figures presented in this article are indicative estimates while final quality assurance is being undertaken. Indicative impacts have been given for the non-financial accounts, financial accounts, financial balance sheets and main economic indicators such as the saving ratio and real households’ disposable income. The remainder of the article is structured as follows:
Section 3 – describes the changes and provides links to tables showing the indicative overall average impacts and revisions to the net lending or borrowing and other main aggregates in the non-financial accounts, financial account and financial balance sheets by transaction and sector
Section 4 – provides detail about the publication of changes in volume of assets account and revaluation account
Section 5 – provides indicative estimates of the “cash” saving ratio for the household sector as defined in the “alternative measures of UK real households disposable income and the saving ratio” article
Appendix A – provides charts showing the indicative estimates of the net lending or borrowing for the non-financial account, financial account and financial balance sheets, showing the impact of the changes to all sectors
Appendix B – provides charts showing the indicative estimates of contributions to revisions to estimated lending or net borrowing and net worth by for selected sectors, by transaction
3. Methodological and other improvements affecting the sector and financial accounts
3.1 Estimates of the impact on net lending or borrowing by sector
This article provides updated information to the impacts on the net lending or net borrowing of the institutional sector that were previously published in National Accounts articles: Detailed assessment of changes to sector and financial accounts, 1997 to 2012 on 5 June 2017. The following section sets out the average indicative impact (annually for 1997 to 2015) of all improvements introduced this year into the sector and financial accounts.
Table 1 sets out the indicative average impact of the changes being introduced into the non-financial accounts, the financial accounts and financial balance sheets for 1997 to 2015, when revised figures for the UK National Accounts, consistent with Blue Book 2017 and Pink Book 2017, are published on 29 September 2017.
Appendix A gives greater detail on the revisions shown in Table 1.
Table 1: Latest indicative average impact of the changes to the net lending or net borrowing for the UK non-financial account, net lending or net borrowing for the financial account and financial net worth from the balance sheets
| UK, 1997 to 2015 | ||||||||||||||
| £billion | ||||||||||||||
| Sector | Average impact of the changes 1997 to 2015 | |||||||||||||
| Total Impact upon net lending/ borrowing from the non-financial account (B.9n) | ||||||||||||||
| Methodological changes | Data revisions separate to methodological changes | Indicative average revision to net lending (+) or borrowing (B.9n) | ||||||||||||
| Public corporations | -4.6 | 0.2 | -4.4 | |||||||||||
| Private non-financial corporations | -33.3 | 3.0 | -30.3 | |||||||||||
| Financial corporations | -2.3 | 1.8 | -0.5 | |||||||||||
| Central government | 0.5 | -0.3 | 0.2 | |||||||||||
| Local government | -0.2 | -0.2 | -0.4 | |||||||||||
| Households and non-profit institutions serving households | 18.8 | 2.0 | 20.8 | |||||||||||
| Rest of the world | 12.6 | -0.1 | 12.5 | |||||||||||
| Sector | Total Impact upon net lending/ borrowing from the financial account (B.9f) | |||||||||||||
| Methodological changes | Data revisions separate to methodological changes | Indicative average revision to net lending or net borrowing for the financial account (B.9f) | ||||||||||||
| Public corporations | -1.2 | -2.4 | -3.6 | |||||||||||
| Private non-financial corporations | -30.1 | 2.6 | -27.5 | |||||||||||
| Financial corporations | -3.0 | 1.1 | -1.9 | |||||||||||
| Central government | -0.2 | 0.6 | 0.4 | |||||||||||
| Local government | 0.0 | -0.6 | -0.6 | |||||||||||
| Households and non-profit institutions serving households | 18.9 | 1.9 | 20.8 | |||||||||||
| Rest of the world | 12.7 | -0.2 | 12.5 | |||||||||||
| Sector | Total Impact upon financial net worth from the balance sheets (BF.90) | |||||||||||||
| Methodological changes | Data revisions separate to methodological changes | Indicative average revision to financial net worth (BF.90) | ||||||||||||
| Public corporations | -18.0 | 0.6 | -17.4 | |||||||||||
| Private non-financial corporations | -48.3 | 27.8 | -20.5 | |||||||||||
| Financial corporations | 157.4 | 13.2 | 170.6 | |||||||||||
| Central government | -5.2 | -0.4 | -5.6 | |||||||||||
| Local government | 0.0 | -8.2 | -8.2 | |||||||||||
| Households and non-profit institutions serving households | -97.5 | -1.5 | -99.0 | |||||||||||
| Rest of the world | -12.0 | -7.9 | -19.9 | |||||||||||
| Source: Office for National Statistics | ||||||||||||||
Download this table Table 1: Latest indicative average impact of the changes to the net lending or net borrowing for the UK non-financial account, net lending or net borrowing for the financial account and financial net worth from the balance sheets
.xls (56.3 kB)3.2 Indicative impacts on the household and non-profit institutions serving households saving ratio and real household disposable income
Figure 1 shows the indicative revisions between Blue Book 2017 and the previously published Blue Book 2017 for the combined household and non-profit institutions serving households (NPISH) gross saving and saving ratio for 1997 to 2015. Revisions to the household and NPISH saving ratio range from negative 0.4 percentage points in 2001 to positive 2.3 percentage points in 2008. The average revision to the saving ratio was positive 0.8 percentage points.
This year we will introduce a household-only saving ratio. Section 3.3.2 gives indicative value for this measure up to 2015.
Figure 1: Indicative impact on households and non-profit institutions serving households (NPISH) gross saving (left hand side, £billion) and household and NPISH saving ratio (right hand side, percentage points)
UK, 1997 to 2015

Source: Office for National Statistics
Download this image Figure 1: Indicative impact on households and non-profit institutions serving households (NPISH) gross saving (left hand side, £billion) and household and NPISH saving ratio (right hand side, percentage points)
.png (27.1 kB) .xls (29.2 kB)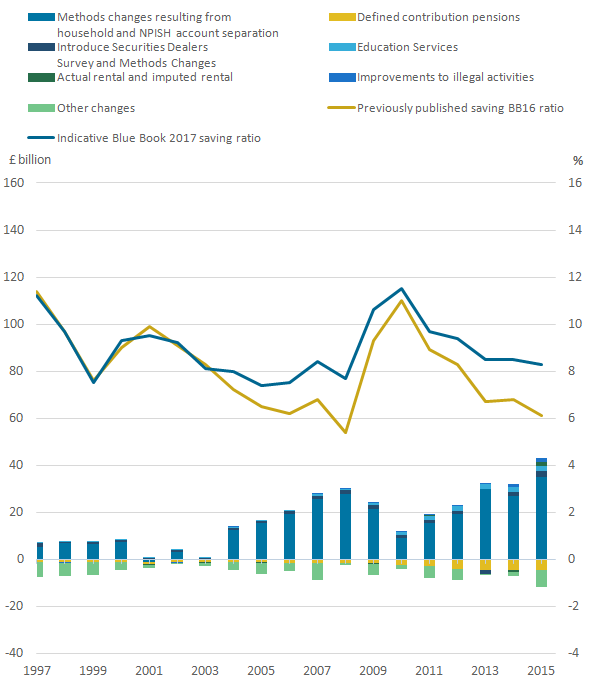
Table 2 gives a summary of the indicative impact to the saving ratio for the methodological improvements that have been implemented for the sector and financial accounts, consistent with the Blue Book and Pink Book 2017. Details of these methodological changes can be found in section 3.3.2
Table 2: Impact on households and non-profit institutions serving households saving ratio
| UK 1997 to 2015 | |||
| Average impact of changes for 1997 to 2015 | |||
| Percentage points | |||
| Methods changes resulting from households and NPISH split | 1.3 | ||
| Actual rental and imputed rental | -0.1 | ||
| Education services | 0.1 | ||
| Defined pension contributions | -0.2 | ||
| Introduce Securities Dealers Survey and Methods Changes | 0.1 | ||
| Source: Office for National Statistics | |||
Download this table Table 2: Impact on households and non-profit institutions serving households saving ratio
.xls (52.7 kB)Figure 2 shows the indicative revisions to real household and NPISH disposable income (RHDI) growth. The largest upward revision to the RHDI growth was for 2004 (1.3%) and the downward revision was in 2009 (-0.9%).
Figure 2: Indicative impact to real household and non-profit instituions serving households (NPISH) disposable income growth rates
UK, 1997 to 2015
Source: Office for National Statistics
Notes:
- Includes change of base year and changes to the HN consumption deflator, which may change due to methodological changes to HN consumption
Download this chart Figure 2: Indicative impact to real household and non-profit instituions serving households (NPISH) disposable income growth rates
Image .csv .xls3.3 Summary of the methodology improvements impacting sector and financial accounts
This section discusses the changes to the methodological improvements to the sector and financial accounts.
Indicative impacts have been given for the non-financial accounts, financial accounts and balance sheets as well as the main economic indicators such as the saving ratio.
3.3.1 Improvements to the treatment of corporate bonds interest, bond redemptions, share ownership and dividends
Corporate bond interest
As previously announced, we are making a substantial improvement to the calculation of interest paid and received on UK corporate bonds. This improvement is the result of internal investigations into the plausibility of the current estimates and working with the Bank of England to better measure these payments. The result of this change is an increase to the size of these payments from 1998 onwards. By definition, the UK economy makes all UK corporate bond interest payments and some of these payments are received by overseas owners of these bonds. The change has therefore resulted in an increase in the current account deficit and a reduction in gross national income (GNI). An article, Improvements to the treatment of Corporate Bonds Interest published on 19 April 2017, gives further details of this methodological change. However this change is large on the financial account and assumptions have been made about which other transactions should be revised to ensure the overall net lending or net borrowing position is consistent with the non-financial account. This has led to other loans being revised, but has been included within the improvements to securities dealers.
Share ownership and dividends
We are making two improvements to the treatment of shares and dividends in Blue Book 2017. The first improvement is that dividend payments have been reprocessed from 2011 onwards, resulting in some dividends being captured for the first time and some double-counting being eliminated, with the overall impact being a rise in dividend payments in most periods.
The second improvement is as a result of benchmarking estimates of UK-listed share asset holdings to our latest available share ownership survey data, up to and including 2014. This has the effect of reallocating these assets between different sectors, particularly to the rest of the world. The most significant effect of these two changes is an increase in share dividend payments from the UK to the rest of the world, increasing the current account deficit and reducing gross national income (GNI).
Tables 3 and 4 of the indicative impact on sector and financial accounts show the estimated average impact on the sectors and transactions affected by the revised methodology for the period 1997 to 2015.
Bond redemptions
In the 19 April 2017 article, we announced an improvement in the treatment of corporate bond redemptions. Bonds are redeemed when the holder is repaid the face value (principal) of the bond. Most bonds are issued with a specified date (the maturity date) when this will occur, although bonds can be redeemed before this, for example, by the issuer repurchasing the bond. We determined that bond redemptions, particularly those issued by private non-financial corporations and other financial institutions, were being undercounted. For Blue Book 2017 we are using Bank of England data to better estimate corporate bond redemptions. Increasing bond redemptions decreases net bond liability issuance by these sectors and bond asset flows for the rest of the world. This change has little impact on corporate bond levels because listed bond levels and flows are estimated separately in the UK National Accounts.
Tables 5 to 7 of the indicative impact on sector and financial accounts show the estimated average impact on the sectors and transactions affected by the revised methodology for the period 1997 to 2015.
3.3.2 Separating estimates and improved measurement for the households and non-profit institutions serving households sectors
The European System of Accounts 2010 (ESA 2010) requires the presentation of separate estimates for the households sector and the non-profit institutions serving households (NPISH) sector. Currently these two sectors are combined for most processing and presentation in the national accounts. Additionally, users have requested estimates for the households sector are published separately for a more representative view of what they are earning and saving, including the presentation of a saving ratio representing only the households sector.
The review of data and methods to produce this split provided an opportunity to refresh how we produce data on households and in particular their income. The largest component of household income remains earnings from employment, which is relatively easy to measure. However, there are other components of income that have been more challenging to measure and have become increasingly important.
In particular, over the last decade or so, there has been strong growth in the number of self-employed people who have incorporated themselves; as well as paying themselves as employees, they also receive income in the form of dividends from the “company”. Although a number of improvements have been made to the measurement of the households and NPISH sectors, this improvement has by far the largest effect of all the changes being introduced in Blue Book 2017.
An article, Improving the household, private non-financial corporations and non-profit institutions serving households sectors' non-financial accounts, published on 19 April 2017, gives further detail on the methodological changes being introduced in Blue Book 2017. We have noted that from 2016 onwards changes to dividends tax policy will need to be built into the method. This will be expanded in the final Blue Book 2017 impact article on 29 September 2017.
Tables 8 to 10 of the indicative impact on sector and financial accounts show the estimated average impact on the sectors and transactions affected by the revised methodology for the period 1997 to 2015. Many transactions are affected.
These methodological changes now enable us to produce a saving ratio specifically for the households sector, which is shown in Figure 3. From 1997 to 2015 the households-only saving ratio is on average 0.3 percentage points lower than the households and NPISH combined saving ratio; however, this gap narrows after 2010.
Household financial assets
The Wealth and Assets Survey is being used to calculate financial balance sheet information for household assets of bonds and mutual funds issued by UK and overseas residents. NPISH assets of bonds are derived from a selection of published charity accounts. Financial account flows are then calculated as the difference between the financial balance sheet level with a price changes effect removed. In some cases the improved estimates have meant previous quality adjustments applied have been removed.
Figure 3: Indicative household saving ratio
UK, 1997 to 2015
Source: Office for National Statistics
Download this chart Figure 3: Indicative household saving ratio
Image .csv .xlsNet lending or borrowing between the non-financial and financial accounts
In previously published data, there has been a small bias between the financial and the non-financial accounts for the households and NPISH sector: the financial account recorded higher net lending than the non-financial account. Conceptually, these measures should be equal.
Introducing the methodological changes has not fully addressed this bias in the financial accounts, and we are continuing to investigate this issue. Figure 4 shows the discrepancies in the previously published data and the indicative new discrepancy.
Figure 4: Indicative households and NPISH net lending or net borrowing in the non-financial account (B.9n) and the financial account (B.9f) compared with previously published data
UK, 1997 to 2015
Source: Office for National Statistics
Download this chart Figure 4: Indicative households and NPISH net lending or net borrowing in the non-financial account (B.9n) and the financial account (B.9f) compared with previously published data
Image .csv .xls3.3.3 Introduction of new securities dealers survey data
As part of our plans to enhance the UK financial accounts, we have introduced improvements to the measurement of the activities of securities dealers due to the introduction of an improved and expanded security dealers survey.
Due to more data being available from more detailed surveys, there have been large revisions to many transactions. Based on the new surveys, data have been revised to map accurately to the European System of Accounts 2010 (ESA 2010) categorisation of financial assets and liabilities. Further revisions are due to changes to the methodology for calculation of acquisitions and disposals of assets. For 2013, revisions are larger to partially offset previously under-recorded bond redemptions.
Further details can be found in the methods article on financial sub-sectorisation and the introduction of the new securities dealers survey data, which was published on 5 June 2017.
Tables 11 to 13 of the indicative impact on sector and financial accounts show the estimated average impact on the sectors and transactions affected by the revised methodology for the period 1997 to 2015.
3.3.4 Expansion of financial sub-sector detail: separate identification of non-money market investment funds in the financial accounts and balance sheets
As part of our ongoing work programme to incorporate methodological improvements for the European System of Accounts 2010 (ESA 2010), we are introducing new methodology for estimating the transactions of the non-money market investment funds (S.124) sub-sector in the financial accounts and balance sheets. This has no impact on the estimates for the aggregated financial sector. A detailed explanation was published on 5 June 2017 in the article Financial sub-sectorisation and the introduction of the new securities dealers survey data.
3.3.5 Unfunded public sector pensions
There are different types of voluntary occupational pensions available to general government employees. The majority of public sector schemes in the UK are defined benefit and unfunded, where government has full responsibility for the deficit of the pension scheme. Following the transition to the European System of Accounts 2010 (ESA 2010), the methodology applied to these schemes has been reviewed.
The term “imputed contributions” has been defined specifically in ESA 2010 (paragraph 4.10) as: “The increase in benefit due to current period of employment less the sum of the employer's actual contribution, less the sum of any contribution by the employee, plus the costs of operating the scheme.”
Most unfunded schemes for government employees regularly review and amend contribution rates with the view of ensuring both the sustainability of the schemes in the long-term and their affordability to the taxpayer. In accordance with the new definition, it has therefore been decided to remove an element of imputation related to the net cost of benefits payable to the existing retired members and treat the contributions set to meet the cost of accruing benefits as actual. This change will be included from 2006 as the pension reforms of that year provide the required data. Alongside this, a smaller-scale review of the data sources and processing has taken place.
There is no impact on the financial accounts or financial balance sheets for this change.
Table 14 of the indicative impact on sector and financial accounts show the estimated average impact on the sectors and transactions affected by the revised methodology for the period 1997 to 2015.
3.3.6 Public sector finances alignment changes
There are small changes to bring the UK National Accounts in line with public sector finances (PSF). PSF datasets usually incorporate latest data and methodological changes affecting the public finances ahead of national accounts, owing to an unrestricted revisions policy. In Blue Book 2017, we improved the consistency between the datasets by introducing the data for light dues, Air Travel Organisers' Levy (ATOL) protection contributions, Community Infrastructure Levy, changing the treatment of the fees charged by the British Transport Police in accordance with the latest statistical classification, as well as making other improvements to the coverage and presentation of departmental revenue and interest data.
Tables 16 to 17 of the indicative impact on sector and financial accounts show the estimated average impact on the sectors and transactions affected by the revised methodology for the period 1997 to 2015.
3.3.7 Actual and imputed rental
For Blue Book 2017, there are improvements to private actual rentals, which make up the bulk of total actual rentals for housing. Other actual rentals, such as rentals to households from housing associations and public sector bodies are unchanged.
The new approach for private actual rentals will bring consistency with the methods for imputed rentals introduced in Blue Book 2016. It will also allow us to remove the discontinuity in the current price data at 2010, which was due to an interim solution in place since Blue Book 2014.
The new approach uses Valuation Office Agency (VOA) data on private rental prices and similar data from the devolved administrations, instead of prices from the Living Costs and Food Survey (LCF). These administrative sources have much larger sample sizes than the LCF, which allows us to implement an improved methodology using stratification. In addition, the new price data enables furnished and unfurnished properties to be separately identified.
As part of the process of bringing the sources and methods for private actual rentals in line with imputed rentals, we identified some further improvements to imputed rentals. These are being implemented in Blue Book 2017. They include improvements to the way that non-calendar year data for housing stocks and rental prices are mapped to calendar years.
Further details on the actual and imputed rental changes were published on 16 February 2017 in the article Changes to National Accounts: actual and imputed rental (Blue Book 2017).
There is no impact to the financial accounts or financial balance sheets from these methodological changes.
Table 18 of the indicative impact on sector and financial accounts shows the estimated average impact on the sectors and transactions affected by the revised methodology for the period 1997 to 2015.
3.3.8 Gross fixed capital formation survey improvements
Following a quality review of software in gross fixed capital formation (GFCF), analysis has shown that elements in the estimates of purchased software – a component of intellectual property products (IPP) – have been double-counted from 2001.
In 2001, purchased software data from the Quarterly Survey of Capital Expenditure were included in the UK National Accounts, but the previous modelled data used in estimates of purchased software were not discontinued. This case of double-counting also uncovered a discrepancy in the modelled data prior to 2001; both will be amended for Blue Book 2017.
The IPP asset will also be impacted as a result of updated data for entertainment, literary or artistic originals. Revised data are available between 2007 and 2009 and new estimates have been sourced for 2010 and 2011, which replace current forecasted data.
Further details on the GFCF survey improvements were published on 16 February 2017 in the article Annual improvements to gross fixed capital formation source data for Blue Book 2017.
Table 19 of the indicative impact on sector and financial accounts shows the estimated average impact on the sectors and transactions affected by the revised methodology for the period 1997 to 2015.
3.3.9 Gross fixed capital formation transfer costs
Gross fixed capital formation (GFCF) transfer costs have been affected by an update to the UK House Price Index (HPI). GFCF uses the UK HPI as part of the calculation of current price transfer costs data. A new HPI (with an associated back series) was introduced in 2016 and data based on this new methodology will be used in the compilation of GFCF for Blue Book 2017.
An improved method for the allocation of transfer costs will also be implemented. The new method assumes that those components where administrative sources are used (for example, Land Registry fees and Stamp Duty) are proportionally assigned to institutional sectors based on the pattern of acquisitions of dwellings and other buildings and structures.
Further information can be found in the Review of costs of ownership transfer and treatment in the UK National Accounts.
Table 20 of the indicative impact on sector and financial accounts shows the estimated indicative average impact on the sectors and transactions affected by the revised methodology for the period 1997 to 2015.
3.3.10 Introduction of new gross fixed capital formation processing system
The gross fixed capital formation (GFCF) estimation system has been redeveloped in line with the 5-year strategy for the UK National Accounts 2015 to 2020, published in July 2015, and recommendations from the Independent review of UK economic statistics. This has resulted in methodological improvements, some of which were introduced in February 2017 in the quarterly national accounts. The remaining changes, which affect data from 1997, will be introduced in Blue Book 2017.
At a sector level, the largest of these changes is the way in which dwellings data are split between private non-financial corporations (PNFCs) and households. A review of the available source data identified that the level of investment in dwellings by PNFCs was too small and that of households too high and so new proportions were calculated.
Table 21 of the indicative impact on sector and financial accounts shows the estimated average impact on the sectors and transactions affected by the revised methodology for the period 1997 to 2015.
3.3.11 Improvements to measurement of illegal activities
New data for the number of users for individual drugs from the Crime Survey for England and Wales have been incorporated into our estimates of illegal activities. The data mainly replaces modelled data between 2000 and 2005.
Table 22 of the indicative impact on sector and financial accounts shows the estimated average impact on the sectors and transactions affected by the revised methodology for the period 1997 to 2015.
3.3.12 Reclassification of English Housing Associations as public corporations
In October 2015, registered housing associations in England were reclassified from the private sector to public corporations, effective from July 2008. Further details on the reclassification of housing associations were published on 5 June 2017 in Reclassification of English Housing Associations and other classification decisions.
Tables 23, 24 and 25 of the indicative impact on sector and financial accounts show the estimated average impact on the sectors and transactions affected by the revised methodology for the period 1997 to 2015.
3.3.13 Defined contribution pensions
We have improved the method for estimating defined contribution (DC) pension entitlements, with an estimate based on regulatory data on DC pension fund assets provided by The Pensions Regulator (TPR). The current method uses the defined benefit (DB) versus DC split for regular contributions to pensions funds by employers and employees to calculate DC asset levels.
An article, The UK Enhanced Financial Accounts: changes to defined contribution pension fund estimates in the national accounts; part 1 – the method published on 16 January 2017, provides an explanation of the methodological changes.
Tables 26, 27 and 28 of the indicative impact on sector and financial accounts show the estimated average impact on the sectors and transactions affected by the revised defined contribution methodology for the period 1997 to 2015.
3.3.14 Education services
We have included a new data source from the Higher Education Statistics Agency (HESA) for higher education tuition fees, which replaces the fees element currently sourced from the International Passenger Survey (IPS). This has resulted in an upward revision to export of services and an equal downward revision to household expenditure.
Table 29 of the indicative impact on sector and financial accounts shows the estimated indicative average impact on the sectors and transactions affected by the improved measurement of education services for the period 1997 to 2015.
3.3.15 Presentation of UK net contributions to the EU
The UK government’s official contributions to the EU are calculated based upon the UK’s gross national income (GNI) and Value Added Tax (VAT) levels, alongside other smaller payments based upon custom duties and levies on sugar. This contribution is lowered due to the UK’s entitlement to an abatement, officially known as the Fontainebleau Abatement, but often referred to as the “UK rebate”.
The abatement is now shown as a separate series and recorded as a component of “VAT and GNI based EU own resources”. In this presentation “VAT and GNI based EU own resources “ is equal to the UK gross contributions to the EU, less “abatement”. “Current international co-operation” now excludes the abatement and so has been footnoted to reflect this change.
These changes are presentational only and have no impact on the UK level statistical aggregates.
3.2.16 Foreign direct investment benchmarking
For the rest of the world sector, the sector and financial accounts utilises information from our quarterly Foreign Direct Investment (FDI) and annual FDI surveys. In the short-term, the quarterly survey is used within the sector and financial accounts and then later revised when the more comprehensive annual survey data become available, known as the FDI benchmark process.
This benchmark process is an annual reconciliation between the quarterly and annual FDI surveys. The quarterly survey for outward and inward FDI has 680 and 970 sampled enterprise groups respectively; these increase to 2,100 and 3,500 enterprise groups respectively on an annual basis. The increased sample size and responses being taken from audited annual accounts, rather than quarterly management accounts, can result in revisions.
This annual process ensures that the sector and financial accounts and annual FDI publications are coherent.
Back to table of contents4. Publication of change in volume of assets account and revaluation account
From Blue Book 2017, we will publish the revaluations and other changes in the volume of asset accounts to allow users to analyse a complete sequence of national accounts.
The other changes in assets account records changes in the values of assets and liabilities between opening and closing balance sheets that result from flows that are not transactions, referred to as “other flows”. The revaluation account records holding gains or losses accruing during the accounting period to the owners of financial and non-financial assets and liabilities.
The UK has a legal requirement to transmit the revaluation and change in volume accounts to Eurostat for the period 2015 onwards, at the main sub-sector level by main financial instrument.
These accounts have been compiled using data already held in national accounts and from the Bank of England. These will be annual only and further details on the layout of the account was published in an article, Changes to the presentation of the tables within Blue Book 2017 and Pink Book 2017 on 5 July 2017.
Back to table of contents5. Experimental alternative measures of the households saving ratio
For Blue Book 2017, there are methodological improvements made to the measurement of the households and non-profit institutions serving households (NPISH) sectors. As a result of the changes in methodology, we can update the estimate of the “cash” basis’ households and NPISH saving ratio.
Within the sequence of accounts, there are transactions which, though important for compiling internationally comparable statistics, are not directly observed by households. As a result, the saving ratio estimated by following guidance from the European System of Accounts 2010 (ESA 2010) may differ from the experience of households. We therefore also estimate another saving ratio, “on a cash basis”.
The saving ratio “on a cash basis” is an Experimental Statistic that estimates the amount of money households have available to spend or save, excluding imputed transactions (which households would not recognise as either income or expenditure), as a percentage of their gross disposable income.
It should be noted that given that the “on a cash basis” saving ratio is an Experimental Statistic, we continue to review the methodology used. The estimates for the saving ratio “on a cash basis” presented in this article are based on the current methodology, which may be subject to change between the publication of this article and the publication of Blue Book 2017 consistent data.
Figure 5 shows the alternative measure of “cash” saving ratio published in July 2017 compared with the indicative “cash” saving ratio that will be presented from September 2017.
Figure 5: Comparison of currently published households and non-profit institutions serving households (NPISH) cash-based saving ratio and indicative households only cash saving ratio
UK, 1997 to 2015
Source: Office for National Statistics
Download this chart Figure 5: Comparison of currently published households and non-profit institutions serving households (NPISH) cash-based saving ratio and indicative households only cash saving ratio
Image .csv .xls6. Appendix A: Estimated lending or net borrowing by sector
The figures in this section show the previously published, estimated current position and associated impact of changes for the non-financial net lending or borrowing position and the financial balance sheet financial net worth by sector.
Public corporations
Figure 6: Public corporations net lending or net borrowing from the non-financial account
UK, 1997 to 2015
Source: Office for National Statistics
Download this chart Figure 6: Public corporations net lending or net borrowing from the non-financial account
Image .csv .xls
Figure 7: Public corporations net lending or net borrowing from the financial account
UK, 1997 to 2015
Source: Office for National Statistics
Download this chart Figure 7: Public corporations net lending or net borrowing from the financial account
Image .csv .xls
Figure 8: Public corporations net financial wealth
UK, 1997 to 2015
Source: Office for National Statistics
Notes:
- 21 August 2017: A correction has been made to the value for "Reclassification of Housing Associations as Public Corporations" in 2015, which was incorrect as originally published. We apologise for any inconvenience.
Download this chart Figure 8: Public corporations net financial wealth
Image .csv .xlsPrivate non-financial corporations
Figure 9: Private non-financial corporations net lending or net borrowing from the non-financial account
UK, 1997 to 2015
Source: Office for National Statistics
Download this chart Figure 9: Private non-financial corporations net lending or net borrowing from the non-financial account
Image .csv .xls
Figure 10: Private non-financial corporations net lending or net borrowing from the financial account
UK, 1997 to 2015
Source: Office for National Statistics
Download this chart Figure 10: Private non-financial corporations net lending or net borrowing from the financial account
Image .csv .xls
Figure 11: Private non-financial corporations net financial wealth
UK, 1997 to 2015
Source: Office for National Statistics
Download this chart Figure 11: Private non-financial corporations net financial wealth
Image .csv .xlsFinancial corporations
Figure 12: Financial corporations net lending or net borrowing from the non-financial account
UK, 1997 to 2015
Source: Office for National Statistics
Download this chart Figure 12: Financial corporations net lending or net borrowing from the non-financial account
Image .csv .xls
Figure 13: Financial corporations net lending or net borrowing from the financial account
UK, 1997 to 2015
Source: Office for National Statistics
Download this chart Figure 13: Financial corporations net lending or net borrowing from the financial account
Image .csv .xls
Figure 14: Financial corporations net financial wealth
UK, 1997 to 2015
Source: Office for National Statistics
Download this chart Figure 14: Financial corporations net financial wealth
Image .csv .xlsCentral government
Figure 15: Central government net lending or net borrowing from the non-financial account
UK, 1997 to 2015
Source: Office for National Statistics
Notes:
Central government net lending or net borrowing from the non-financial account remained largely unchanged.
Download this chart Figure 15: Central government net lending or net borrowing from the non-financial account
Image .csv .xlsLocal government
Figure 16: Local government net lending or net borrowing from the non-financial account
UK, 1997 to 2015
Source: Office for National Statistics
Download this chart Figure 16: Local government net lending or net borrowing from the non-financial account
Image .csv .xlsHouseholds and non-profit institutions serving households (NPISH)
Figure 17: Households and non-profit institutions serving households (NPISH) net lending or net borrowing from the non-financial account
UK, 1997 to 2015
Source: Office for National Statistics
Download this chart Figure 17: Households and non-profit institutions serving households (NPISH) net lending or net borrowing from the non-financial account
Image .csv .xls
Figure 18: Households and non-profit institutions serving households (NPISH) net lending or net borrowing from the financial account
UK, 1997 to 2015
Source: Office for National Statistics
Download this chart Figure 18: Households and non-profit institutions serving households (NPISH) net lending or net borrowing from the financial account
Image .csv .xls
Figure 19: Households and non-profit institutions serving households (NPISH) net financial wealth
UK, 1997 to 2015
Source: Office for National Statistics
Download this chart Figure 19: Households and non-profit institutions serving households (NPISH) net financial wealth
Image .csv .xlsRest of the world
Figure 20: Rest of the world net lending or net borrowing from the non-financial account
UK, 1997 to 2015
Source: Office for National Statistics
Download this chart Figure 20: Rest of the world net lending or net borrowing from the non-financial account
Image .csv .xls
Figure 21: Rest of the world net lending or net borrowing from the financial account
UK, 1997 to 2015
Source: Office for National Statistics
Download this chart Figure 21: Rest of the world net lending or net borrowing from the financial account
Image .csv .xls
Figure 22: Rest of the world net financial wealth
UK, 1997 to 2015
Source: Office for National Statistics
Download this chart Figure 22: Rest of the world net financial wealth
Image .csv .xls7. Appendix B: Contributions to revisions to estimated lending or net borrowing and net worth by for selected sectors, by transaction
The figures in this section show the indicative revision to the previously published Blue Book 2016 data, for the non-financial and financial net lending or borrowing position and the financial balance sheet financial net worth by sector, and show the contributions to the revision by category of transaction.
Private non-financial corporations
Figure 23: Indicative revision to private non-financial corporations net lending or borrowing from the non-financial account
UK, 1997 to 2015
Source: Office for National Statistics
Download this chart Figure 23: Indicative revision to private non-financial corporations net lending or borrowing from the non-financial account
Image .csv .xls
Figure 24: Indicative revision to private non-financial corporations net lending or borrowing from the financial account
UK, 1997 to 2015
Source: Office for National Statistics
Download this chart Figure 24: Indicative revision to private non-financial corporations net lending or borrowing from the financial account
Image .csv .xls
Figure 25: Indicative revision to private non-financial corporations net financial wealth
UK, 1997 to 2015
Source: Office for National Statistics
Download this chart Figure 25: Indicative revision to private non-financial corporations net financial wealth
Image .csv .xlsFinancial corporations
Figure 26: Indicative revision to financial corporations net lending or borrowing from the non-financial account
UK, 1997 to 2015
Source: Office for National Statistics
Download this chart Figure 26: Indicative revision to financial corporations net lending or borrowing from the non-financial account
Image .csv .xls
Figure 27: Indicative revision to financial corporations net lending or borrowing from the financial account
UK, 1997 to 2015
Source: Office for National Statistics
Download this chart Figure 27: Indicative revision to financial corporations net lending or borrowing from the financial account
Image .csv .xls
Figure 28: Indicative revision to financial corporations net financial wealth
UK, 1997 to 2015
Source: Office for National Statistics
Download this chart Figure 28: Indicative revision to financial corporations net financial wealth
Image .csv .xlsHouseholds and non-profit institutions serving households
Figure 29: Indicative revision to households and non-profit institutions serving households (NPISH) net lending or borrowing from the non-financial account
UK, 1997 to 2015
Source: Office for National Statistics
Download this chart Figure 29: Indicative revision to households and non-profit institutions serving households (NPISH) net lending or borrowing from the non-financial account
Image .csv .xls
Figure 30: Indicative revision to households and non-profit institutions serving households (NPISH) net lending or borrowing from the financial account
UK, 1997 to 2015
Source: Office for National Statistics
Download this chart Figure 30: Indicative revision to households and non-profit institutions serving households (NPISH) net lending or borrowing from the financial account
Image .csv .xls
Figure 31: Indicative revision to households and non-profit institutions serving households (NPISH) net financial wealth
UK, 1997 to 2015
Source: Office for National Statistics
Download this chart Figure 31: Indicative revision to households and non-profit institutions serving households (NPISH) net financial wealth
Image .csv .xlsRest of the world
Figure 32: Indicative revision to rest of the world net lending or borrowing from the non-financial account
UK, 1997 to 2015
Source: Office for National Statistics
Download this chart Figure 32: Indicative revision to rest of the world net lending or borrowing from the non-financial account
Image .csv .xls
Figure 33: Indicative revision to rest of the World net lending or borrowing from the financial account
UK, 1997 to 2015
Source: Office for National Statistics
Download this chart Figure 33: Indicative revision to rest of the World net lending or borrowing from the financial account
Image .csv .xls