1. Introduction
This article continues our evaluation of the data provided by credit reference agency Equifax and the types of UK borrowing analysis that could be undertaken using the Equifax data. Specifically, it looks at how experimental geographic breakdowns of the borrowing stock data could be used to compare borrowing and other unpaid debt patterns throughout the UK.
Back to table of contents2. Background
We have ambitious plans to transform our statistics, informed by our Economic Statistics and Analysis Strategy and with the aim of increasing the robustness and quality of UK economic statistics. Working in partnership with the Bank of England, one element of our transformation work is the development of enhanced financial accounts (EFA) – in particular, more detailed “flow of funds” statistics – to meet evolving user needs.
The main aims of the EFA initiative are to improve the coverage, quality and granularity of financial statistics. This includes producing whom-to-whom statistics for the UK National Accounts, specifically identifying the counterparty information for each financial transaction. A possible avenue for these improvements is using data obtained from commercial sources. The benefits of commercial data over traditional surveys include:
reduced burden on households and businesses
increased volumes of data that provide the potential for greater granularity
There are also challenges in using these data, including:
reduced alignment with national accounts concepts when compared with survey data
gaps in the coverage of commercial data may be harder to identify than in a survey
As discussed in our previous article, credit reference agency (CRA) data partially covers some important areas of the UK National Accounts, most importantly the level of borrowing for the period from the end of Quarter 1 (31 March) 2015 to the end of Quarter 2 (30 June) 2018 inclusive. In this article we will look at how the Equifax data could supplement our view of borrowing in the UK by providing a geographic breakdown of these data. These data include not only borrowing data but also some unpaid debt reported to credit reference agencies such as amounts owing for utility bills and telecommunications.
Such new and more granular data have the potential to improve our understanding of borrowing behaviour that, in recent years, especially for the household sector, has become a topical issue. The household sector experienced negative real wage growth throughout most of 2017, while at the same time hitting record low level of saving and becoming a net borrower in the process for the first time in nearly 30 years. In the Bank of England’s June 2017 Financial Stability Report, they expressed concerns for the rapid growth and the stock of “personal contract purchase” agreements in the car finance market which had contributed to growth in consumer borrowing. They have since continued to monitor car finance. For these reasons it is clear that there is much public and policy interest in the analysis and insights that granular borrowing data, such as in this article, can bring to the debate on the sustainability of finances and the growth of regional economies.
Back to table of contents3. Coverage
Equifax is one of several credit reference agencies (CRAs) within the UK. All UK companies undertaking lending activities have the option to report this information to a CRA within the UK, although this is not mandatory. However, if they wish to receive “shared data” in order to make credit decisions, it is a requirement to provide data to their preferred CRA.
The Steering Committee on Reciprocity (SCOR) set recommendations that suggest lenders should share data with all CRAs. Whilst this is not always the case, most do share with the three main CRAs. Consequently, no individual CRA will have full coverage of total borrowing activities in the UK.
Although our analysis and discussions with Equifax and SCOR have not currently uncovered any geographical bias within the CRA data presented in this article, care should be taken when comparing lending between areas.
The data received from Equifax are anonymised and aggregated so no individual borrowing information can be identified. It is important to note that we do not have access to any personal information and cannot identify individuals within the data. The data are aggregated by Equifax to geographical level and the type of lending. The data are also split by the type of borrower providing consumer data, covering individual and household lending, and commercial lending, covering borrowing by businesses.
For the consumer side, the data are aggregated using Local Authority District (LAD) codes at a unitary authority (UA) level. On the commercial side, the dataset uses the Nomenclature of Territorial Units for Statistics (NUTS) geographical level 2 as the basis of the aggregation. UAs are territories that are more aggregated than postal towns, with NUTS level 2 forming a further higher aggregation. This is illustrated in the information found in the Local Authority District to LAU1 to NUTS3 to NUTS2 to NUTS1 (January 2018) lookup. For this analysis, we have aggregated these further in the main body of the text to NUTS1 regional level but the anonymised lower-level geographical map breakdown can be found in Annex A, with Annex B presenting NUTS1 regional portfolios in chart format.
We have adjusted the raw Equifax data to account for the size of the population areas involved. This allows us to compare areas on a more equal basis. This also provides a more comparable time series by ensuring that any changes in borrowing are not because of the change in population of the area over time. For the consumer data, we have divided the raw data values by the population size of the area, with the exception of mortgages, where we have divided by the number of mortgage accounts. For the commercial lending data we have divided the commercial lending by gross value added (GVA) for the area, using GVA as a proxy for the size of the business activity within the area. This gives a commercial lending to GVA percentage which has then been indexed relative to the total UK percentage set at 100. Although this does remove the effect of the size of the areas within the data, this does not take into account any bias that might exist based on the geographical coverage of the data.
These data are not a census of all the borrowing within the UK. This analysis only represents the data reported to Equifax, and therefore should be viewed with that in mind. We have also been selective over the types of lending included in this article as some lending types contained geographical bias. We encountered bias in the utilities category due to the reporting pattern of water companies, whereby the transaction would be geographically specific. Although we did not uncover any further bias of this type, it is something that users should be aware of when interpreting the data.
This article also compares movements in lending type amounts over time. In these comparisons it is important to note that the Equifax reporting population is not fixed and can change. During the reported periods we have not seen a significant change in any of the known population reporting, but this is something that could affect the data and should also be considered when analysing trends over time.
Commercial data
Commercial lending refers to borrowing by commercial entities. Equifax collects these data separately to household borrowing, and we can therefore split the data to show differences between the borrowing patterns of these two groups. These data, however, are classified to the head office location of the borrower company. In some cases, this will be the same location as the company as a whole, but in other circumstances the head office will not fully represent the geographical locations covered by the borrower. The data are split by Nomenclature of Territorial Units for Statistics (NUTS) level 1, which consists of:
North East England
North West England
Yorkshire and The Humber
East Midlands
West Midlands
East England
London
South West England
South East England
Wales
Scotland
Northern Ireland
We have adjusted the raw Equifax data in an attempt to account for differences in the commercial activity between areas. As described above we divided the commercial lending by gross value added (GVA) for the area, using GVA as a proxy for the size of the business activity within the area. This gives a commercial lending to GVA percentage which has then been indexed relative to the total UK percentage set at 100.
Figure 1: Index comparative chart of commercial borrowing to GVA
Indexed relative to total UK borrowing over total UK GVA, UK, 2016 and 2017
Source: Equifax
Download this chart Figure 1: Index comparative chart of commercial borrowing to GVA
Image .csv .xlsFigure 1 shows commercial borrowing to gross value added (GVA) percentages for regions of England, and the three other UK countries within the Equifax dataset, indexed to the UK percentage. In 2016, only London, the North East, South East and Northern Ireland exhibited lower borrowing to GVA percentages than the UK average, with the West Midlands joining them in 2017. Scotland are at the top end of the data, exhibiting relatively high borrowing to GVA percentages over both periods.
Consumer data
Consumer data refers to borrowing by individuals and households within the UK. Within the Equifax data delivery, all consumer information has been anonymised and aggregated to Local Authority district Unitary authority level (LAU). We have further aggregated this to the Nomenclature of Territorial Units for Statistics (NUTS) level 1. This has allowed us to produce regional breakdowns of the level of borrowing data for households from the end of 2015 to the end of 2017.
Figure 2: Regional split of consumer borrowing from Equifax data
UK, 2015, 2016 and 2017
Source: Equifax
Download this chart Figure 2: Regional split of consumer borrowing from Equifax data
Image .csv .xlsFigure 2 shows the data adjusted for the aged over 18 years population size of the area to allow for more meaningful comparison between differing populations in areas and time periods, by dividing the regions by their relevant population level. It should also be noted that this data includes lending on mortgages.
Back to table of contents4. Types of consumer lending
The Equifax data provide a further breakdown in some specific areas of UK lending. This consumer analysis covers some of the lending types that Equifax hold. The data can be dissected in a number of ways, including separating the secured and unsecured lending. A secured loan is a loan in which the borrower pledges some asset (for example, a car or property) as collateral for the loan, which then becomes a secured debt owed to the creditor who advances the loan. An unsecured loan is a loan that is issued and supported only by the borrower's creditworthiness, rather than by any type of collateral. In terms of the Equifax data, secured lending refers only to mortgages and so below we have separated mortgages from the unsecured lending. In addition, the unsecured lending can be broken down further into individual categories which are shown in Figures 5 to 9.
As with the total consumer lending shown in Figure 2, we have adjusted the majority of the raw data by dividing it by the aged over 18 years population to remove the effect of changing populations during the time period on the data. The exception here is mortgages, where we have divided by the number of mortgage accounts to take into account that mortgages are not strictly person specific, with many cases involving two (or more) adults residing in a property with one mortgage.
Secured lending (mortgages)
Within the data displayed, the secured lending category covers standard mortgages (including buy-to-let mortgages registered to the address of the borrower), flexible mortgages and second mortgages. Standard mortgages contribute to around 99% of this category.
Mortgages are loans for the purchase of property that are secured by a mortgage deed until the final payment is made. Flexible mortgages are secured by a mortgage deed until the final payment is made but the account has flexible terms or elements of multiple products. Second mortgages are further advances against a property that already has a mortgage secured on it.
For this dataset we have not used the aged 18 years and over population as an adjustment for regional size. Instead we have used information supplied by Equifax on the number of active mortgage assets within each region to adjust the mortgage data for regional comparison.
Figure 3: Regional split of outstanding consumer borrowing on mortgages from Equifax data
UK, 2015, 2016 and 2017
Source: Equifax
Download this chart Figure 3: Regional split of outstanding consumer borrowing on mortgages from Equifax data
Image .csv .xlsFigure 3 shows the split of mortgage outstanding by region of England, and other UK countries adjusted by the number of mortgages. This is an estimate of the average amount of outstanding mortgage in each region at the relevant point in time.
Unsecured lending
Unsecured lending refers to any lending where there is no related collateral. The data shown in Figure 4 illustrates the information provided by Equifax for unsecured lending within the consumer market. It can be further split into seven individual lending types, which are detailed in Figures 5 to 9.
Figure 4: Regional split of consumer borrowing on unsecured credit from Equifax data
UK, 2015, 2016 and 2017
Source: Equifax
Download this chart Figure 4: Regional split of consumer borrowing on unsecured credit from Equifax data
Image .csv .xlsFigure 4 shows that the overall unsecured consumer lending market has increased over the time periods. It also illustrates that there is little regional variation in the overall borrowing patterns in this type of lending. By breaking this down into the individual components we can see further information about the borrowing habits of consumers.
Unsecured lending type 1: current accounts
This account type represents standard current accounts provided by banks and building societies. This is the most common account type within the output and the total value of these assets is the summation of the utilisation of the accounts overdraft facilities.
It is important to note that all data supplied to Office for National Statistics (ONS) have been aggregated and anonymised so no individual information can be identified within this dataset.
Figure 5: Regional split of consumer borrowing on current accounts from Equifax data
UK, 2015, 2016 and 2017
Source: Equifax
Download this chart Figure 5: Regional split of consumer borrowing on current accounts from Equifax data
Image .csv .xlsFigure 5 shows the data adjusted for the population size of the area to allow for more meaningful comparison between differing populations in areas and time periods, by dividing the regions by their relevant population level.
Unsecured lending type 2: credit cards, store cards and charge cards
This category includes standard credit cards, store cards that can only be used in selected outlets and charge cards. Standard credit and store card holders are generally allowed to spend up to an agreed limit and repayment values are either a percentage of the balance owed or specified minimum amount. Charge cards generally differ in that the credit agreement specifies that spending is allowed up to the credit limit but full repayment is expected against a monthly statement.
Standard credit cards make up the largest proportion of this lending category.
Figure 6: Regional split of consumer borrowing on credit, store and charge cards from Equifax data
UK, 2015, 2016 and 2017
Source: Equifax
Download this chart Figure 6: Regional split of consumer borrowing on credit, store and charge cards from Equifax data
Image .csv .xlsFigure 6 shows the split of the credit, charge and store card market by region of England, and the three other UK countries. All regions and countries show an increase in this borrowing type over the time period.
Unsecured lending type 3: hire purchase
This account type represents lending in which the merchandise remains the legal property of the lender until all repayments are completed. Repayments are normally fixed, but variable payments could apply.
This loan type includes motor finance providers who will offer various lending products. These may include standard hire purchase agreements, personal contract purchase or balloon rentals as well as other forms of rentals that do not involve full ownership for the consumer.
Figure 7: Regional split of consumer borrowing on hire purchase from Equifax data,
UK, 2015, 2016 and 2017
Source: Equifax
Download this chart Figure 7: Regional split of consumer borrowing on hire purchase from Equifax data,
Image .csv .xlsFigure 7 shows the split of hire purchase agreements by region. Overall, it highlights that hire purchase lending has increased in all regions and countries between the periods.
Unsecured lending type 4: utilities
This category represents payments made for gas, water or electricity. Although this is not a type of borrowing, it is collected by the credit reference agencies as a distinct unpaid debt and therefore we have considered this as part of our analysis of the Equifax data. The water element of this category however, gives the data geographical bias and we are regrettably unable to present any meaningful geographical analysis. This is due to the fact that water companies are region specific and therefore the data would identify the companies directly.
Unsecured lending type 5: other short-term lending
This category covers pay day or short-term loans and home lending.
Pay day or short-term loans are small unsecured short-term loans due to be repaid or substantially repaid within 12 months, with a very high annual percentage rate (APR).
Home lending is the provision of credit, typically for small sum loans, on flexible terms. Repayments are collected in instalments by collectors who call at the customer’s home.
At the geographical level, these data are disclosive on the lender side, which regrettably limits our ability to present geographical analysis in this article.
Unsecured lending type 6: telecommunications
This account type is used by mobile, cable or landline phone providers. As with utilities, this is not a type of borrowing but a form of unpaid bill debt that credit reference agencies collect and has been considered in our analysis. The average asset value here is relatively low compared with most other types of credit.
This category does also include some charges for mobile phones purchased as part of a contract, but these may be reported separately within unsecured loans in the other unsecured credit category.
Figure 8: Regional split of consumer borrowing on telecommunications from Equifax data
UK, 2015, 2016 and 2017
Source: Equifax
Download this chart Figure 8: Regional split of consumer borrowing on telecommunications from Equifax data
Image .csv .xlsFigure 8 shows the split of telecommunications borrowing by region of England, and other UK countries. Interestingly, this lending type has decreased in all countries and regions over the period, possibly because of more widespread use of consumer comparison sites or the increase in use of split-contract (airtime and phone loans being reported separately).
Unsecured lending type 7: other unsecured credit
This residual category is a mixture of various elements of unsecured financing not captured elsewhere. These include:
rentals of TV, brown and white goods or property
insurance or motor finance, which includes credit agreements for the provision of motor insurance
unsecured loans, which represent agreements covering the borrowing of a fixed amount that is not secured; this is primarily comprised of personal loans from a bank or finance house and includes loans for education purposes, but other types of lending can occasionally be found within this account type, such as peer-to-peer and high-cost short-term lending (in addition to this, there has been a recent increase in unsecured loans being provided by telecommunication companies, due to the increasing trend of lenders providing “split-contract” offerings, whereby the consumer will pay for their handset separately to their standard tariff)
budget accounts, which are accounts for the purchase of goods up to an agreed credit limit; the regular repayment remains constant, similar to credit or store cards
mail order, which is primarily comprised of retail lenders providing credit for online and catalogue purchases
credit sale or fixed-term, which represents a credit agreement in which the ownership of the goods passes to the customer on signing the agreement; many of the largest lenders for this account type offer products that are similar in nature to credit cards or store cards
Figure 9: Regional split of consumer borrowing on other unsecured credit from Equifax data
UK, 2015, 2016 and 2017
Source: Equifax
Download this chart Figure 9: Regional split of consumer borrowing on other unsecured credit from Equifax data
Image .csv .xlsFigure 9 shows the split of the other unsecured loan market by region of England, and other UK country.
Back to table of contents5. Portfolio of consumer lending
It is also possible to produce a portfolio of borrowing types for the consumer data for the regions of England and the three other UK countries. Annex B contains the individual regional information while Figure 10 shows the UK portfolio of borrowing. The lending types are explained within Section 4 of this article and are presented as a percentage split of the total borrowing for that region of England, or other UK country. For illustrative purposes, mortgage lending has been removed as this makes up over 80% of the borrowing within the region. We have also excluded short-term credit and utilities from this analysis. Further portfolio charts for the regions of England and the other three UK countries are shown in Figures 20 to 31 in Annex B.
Figure 10: Portfolio of UK borrowing types
Excluding mortgages, other short-term credit and utilities, UK, 2015, 2016 and 2017
Source: Equifax
Download this chart Figure 10: Portfolio of UK borrowing types
Image .csv .xlsWe can see in Figure 10 the sharp rise of the use of hire purchase by consumers between 2015 and 2017. This category includes car finance contracts and corroborates the Bank of England’s scrutiny on the car finance market shown in their June 2017 Financial Stability Report.
Back to table of contents6. Summary and next steps
In this article, we have analysed the Equifax data and highlighted some complimentary analysis available. It has shown the potential for geographical breakdowns of borrowing data and we will continue to work with this data.
As explained previously, these data are not a full representation of the UK but instead are a representation of the data from lenders that report to Equifax. The data have not been weighted to represent the total population. As there is no known geographical bias in the Equifax loan types that we have presented in this article, we have assumed these patterns are representative, but further work is required to confirm this.
Our next steps will be to look at how the data could be used to help supplement other statistics within Office for National Statistics (ONS). We will also be looking for any further analysis available from the dataset. Taking a broader look across the enhanced financial accounts (EFA) into 2019, we will be sharing the outcomes of our research and development, involving both new and improved existing data sources to enhance the financial account. This will include:
developing pre-1987 historic estimates of additional elements of the financial account
working to improve measurement of financial activity in the monetary financial institutions sector
In 2019, we will also publish experimental statistics to provide a cohesive picture of the accounts as part of the annual update to the flow of funds matrices. These matrices have recently been updated in line with the annual update for national accounts. In parallel, we will continue to publish analytical work, including updated visualisations of the data and examples of how the data could be used.
We welcome feedback on our plans and work to date. Please email FlowOfFundsDevelopment@ons.gov.uk with any feedback or questions regarding this article.
Back to table of contents7. Acknowledgements
The author would like to thank Equifax and SCOR for their guidance in the work undertaken, along with the Mapping Services Team and Publishing Support Team for producing the graphics within this article. They would also like to thank Abbe Williams, John Bundey, Phillip Davies, Trevor Fenton, Keith Miller, Tomos Davies, Rikesh Patel, Keith Lai and Sumit Dey-Chowdhury for their involvement and support.
Back to table of contents8. Relevant links
Flow of Funds archived background information
Explanatory Notes:
26 November 2018 – Economic Statistics Transformation Programme: enhanced financial accounts (UK flow of funds) – 2018 matrix update
30 April 2018 – Experimental financial statistics for insurance using Solvency II regulatory data – enhanced financial accounts (UK flow of funds)
23 January 2018 – Economic Review: January 2018 – Economic Statistics Transformation Programme: a flow of funds approach to understanding quantitative easing
17 November 2017 – Economic Statistics Transformation Programme: enhanced financial accounts (UK flow of funds) – 2017 matrix update
23 October 2017 – Economic Statistics Transformation Programme: enhanced financial accounts (UK flow of funds) – progress on commercial data use
12 September 2017 – Economic Statistics Transformation Programme: Enhanced financial accounts (UK flow of funds) – A flow of funds approach to understanding financial crises
31 May 2017 – Economic Statistics Transformation Programme: Enhanced financial accounts (UK flow of funds) plans for commercial data use
27 April 2017 – Economic Statistics Transformation Programme: Enhanced financial accounts (UK flow of funds) employee stock options
24 April 2017 – Financial intermediation services indirectly measured (FISIM) in the UK revisited
30 January 2017 – The UK Enhanced Financial Accounts: changes to defined contribution pension fund estimates in the national accounts; part 2 – the data
16 January 2017 – The UK Enhanced Financial Accounts: changes to defined contribution pension fund estimates in the national accounts; part 1 – the methodology
8 August 2016 – Economic Statistics Transformation Programme: UK flow of funds experimental balance sheet statistics, 1997 to 2015
14 July 2016 – Economic Statistics Transformation Programme: Flow of funds - the international context
14 July 2016 – Economic Statistics Transformation Programme: Developing the enhanced financial accounts (UK Flow of Funds)
10 March 2016 – Identifying Sectoral Interconnectedness in the UK Economy
24 February 2016 – Improvements to the Sector and Financial Accounts
12 January 2016 – Historical Estimates of Financial Accounts and Balance Sheets
6 November 2015 – Comprehensive Review of the UK Financial Accounts including explanatory notes for each financial instrument covered in the matrix
November 2015 – Bank Stat article on the review of the UK Financial Accounts
13 July 2015 – Introduction Progress and Future Work
Back to table of contents9. Annex A – Maps of the geographical breakdown of Equifax data
Figures 11 to 19 provide geographical breakdowns of the Equifax data.
Figure 11: Commercial borrowing to GVA comparative index (UK = 100)
By NUTS 3 area, UK, 2016 and 2017, indexed to total UK commercial borrowing over total UK GVA

Source: Equifax
Download this image Figure 11: Commercial borrowing to GVA comparative index (UK = 100)
.png (333.9 kB) .xls (78.8 kB)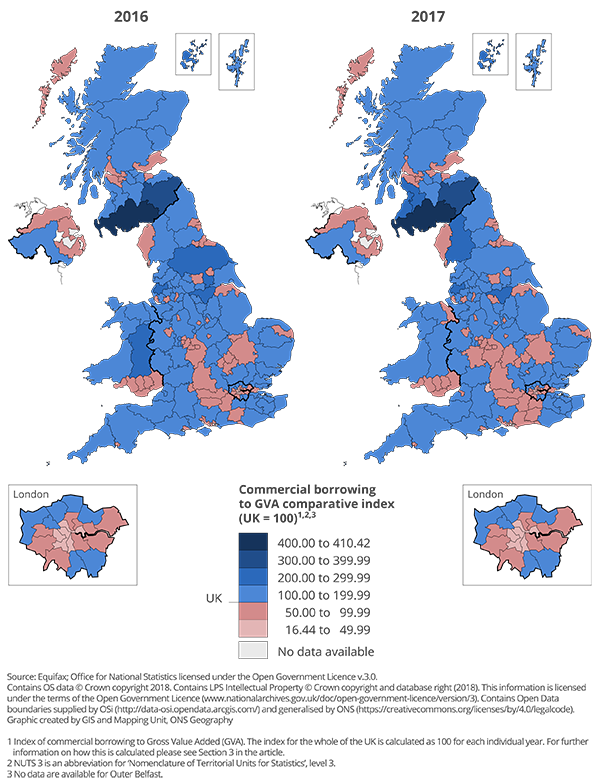
Figure 12: Total consumer borrowing per person aged 18 years or over
By local authority district, UK, 2015 and 2017
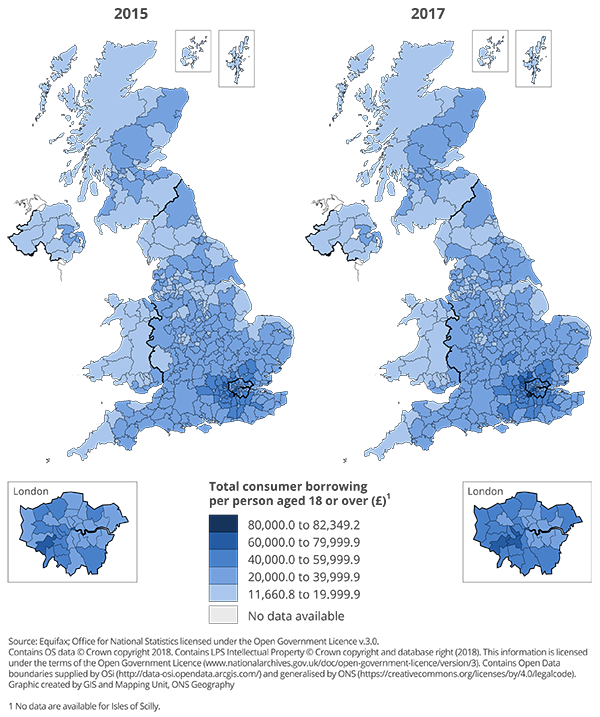
Source: Equifax
Download this image Figure 12: Total consumer borrowing per person aged 18 years or over
.png (346.5 kB) .xls (101.4 kB)
Figure 13: Average consumer mortgage amount outstanding
By local authority district, UK, 2015 and 2017

Source: Equifax
Download this image Figure 13: Average consumer mortgage amount outstanding
.png (345.1 kB) .xls (101.4 kB)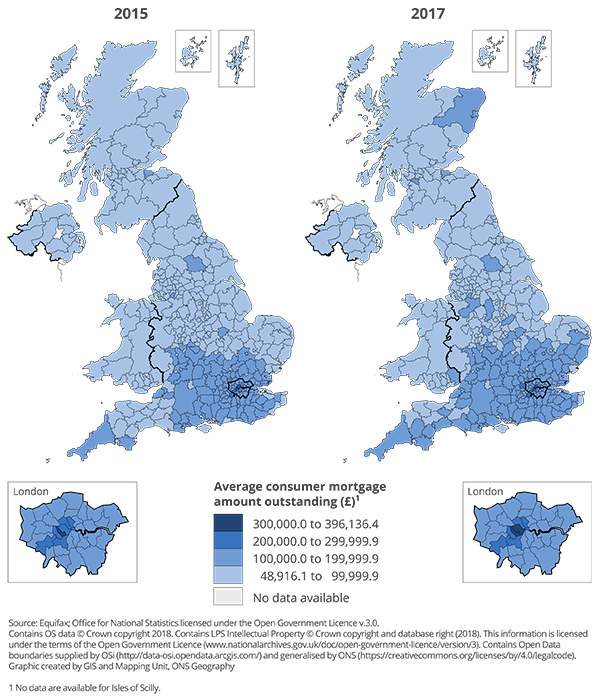
Figure 14: Unsecured consumer borrowing per person aged 18 years or over
By local authority district, UK, 2015 and 2017
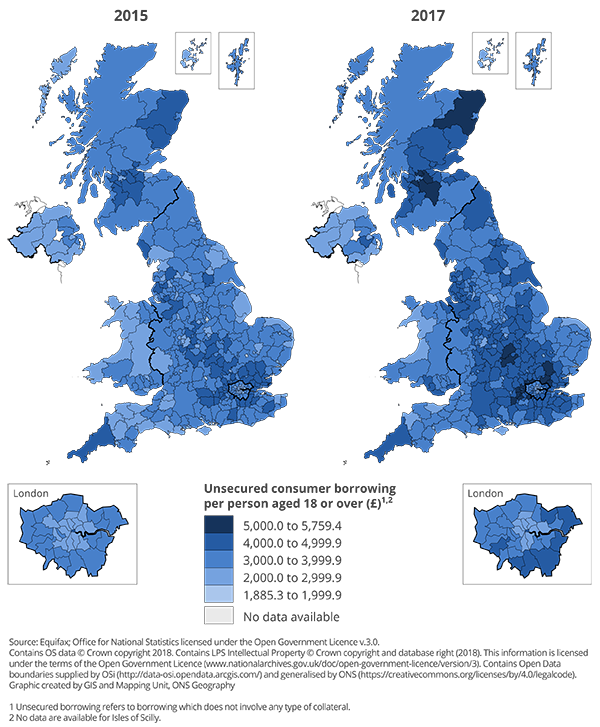
Source: Equifax
Download this image Figure 14: Unsecured consumer borrowing per person aged 18 years or over
.png (342.1 kB) .xls (90.1 kB)
Figure 15: Current account, consumer borrowing per person aged 18 years or over
By local authority district, UK, 2015 and 2017

Source: Equifax
Download this image Figure 15: Current account, consumer borrowing per person aged 18 years or over
.png (335.3 kB) .xls (89.6 kB)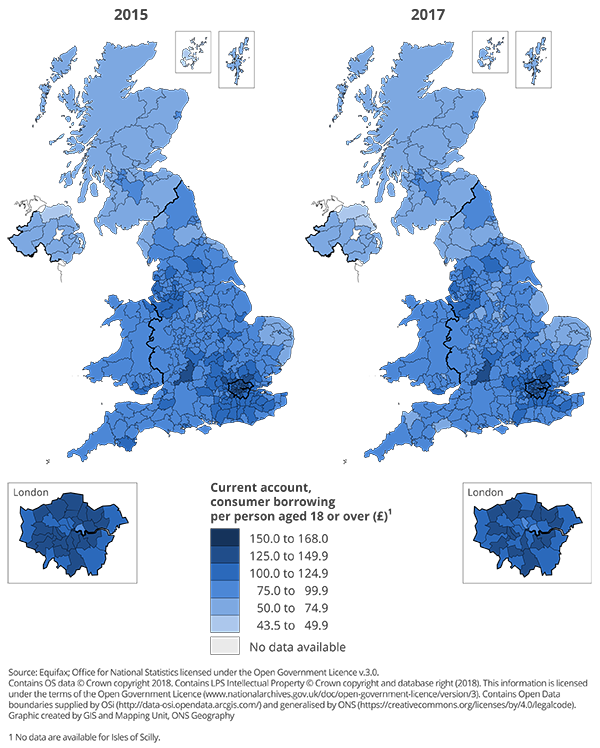
Figure 16: Credit, store and charge card, consumer borrowing per person aged 18 years or over
By local authority district, UK, 2015 and 2017
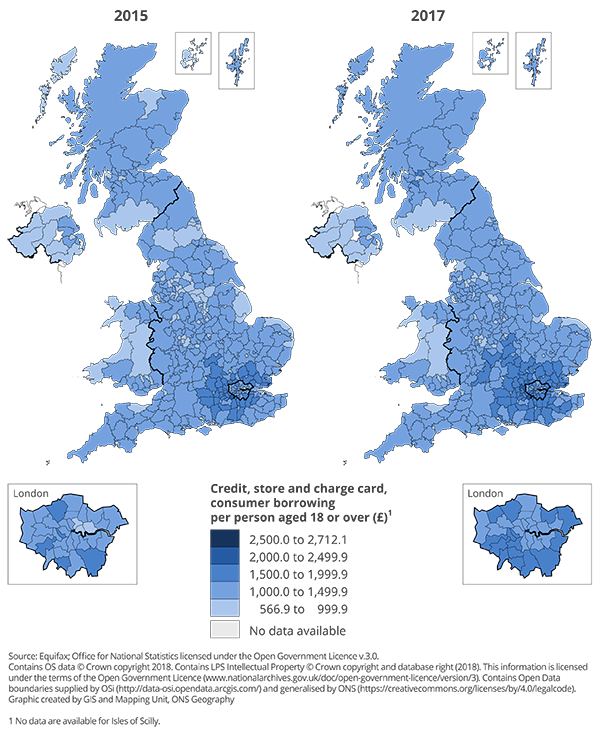
Source: Equifax
Download this image Figure 16: Credit, store and charge card, consumer borrowing per person aged 18 years or over
.png (347.1 kB) .xls (101.4 kB)
Figure 17: Hire purchase, consumer borrowing per person aged 18 years or over
By local authority district, UK, 2015 and 2017

Source: Equifax
Download this image Figure 17: Hire purchase, consumer borrowing per person aged 18 years or over
.png (341.8 kB) .xls (100.9 kB)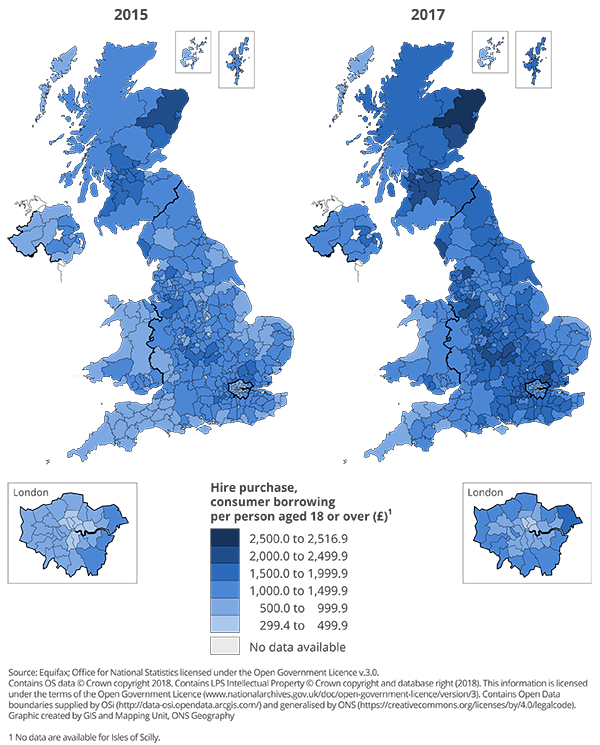
Figure 18: Telecommunications, consumer borrowing per person aged 18 years or over
By local authority district, UK, 2015 and 2017

Source: Equifax
Download this image Figure 18: Telecommunications, consumer borrowing per person aged 18 years or over
.png (344.1 kB) .xls (100.9 kB)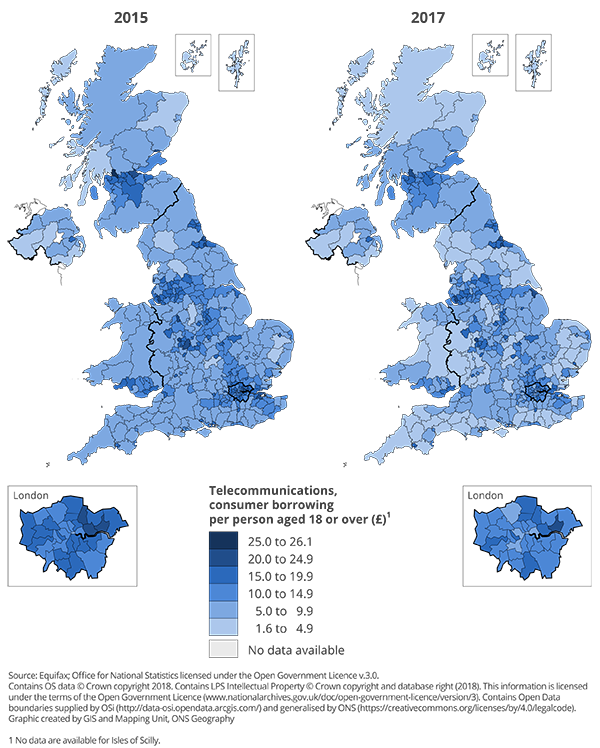
Figure 19: Other unsecured credit, consumer borrowing per person aged 18 years or over
By local authority district, UK, 2015 and 2017

Source: Equifax
Download this image Figure 19: Other unsecured credit, consumer borrowing per person aged 18 years or over
.png (346.5 kB) .xls (90.6 kB)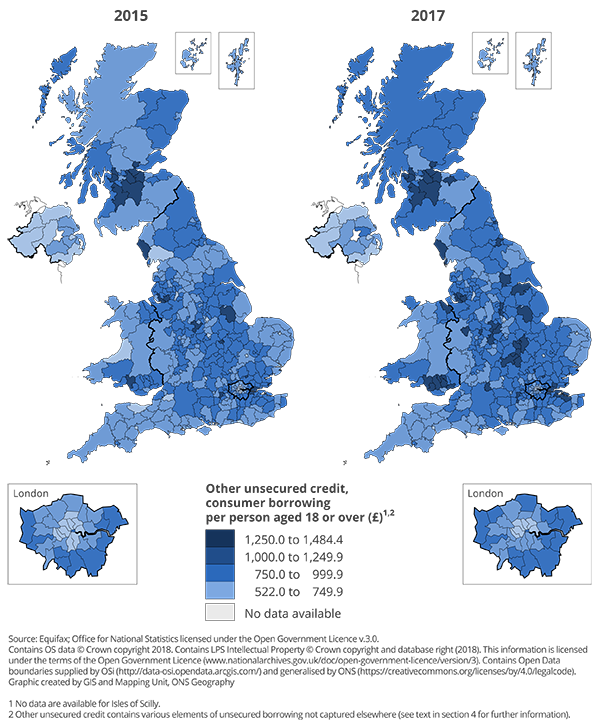
10. Annex B - Portfolio of regions
Figure 20: Portfolio of borrowing types in North East England
Excluding mortgages, short-term credit and utilities, UK, 2015, 2016 and 2017
Source: Equifax
Download this chart Figure 20: Portfolio of borrowing types in North East England
Image .csv .xls
Figure 21: Portfolio of borrowing types in North West England
Excluding mortgages, short-term credit and utilities, UK, 2015, 2016 and 2017
Source: Equifax
Download this chart Figure 21: Portfolio of borrowing types in North West England
Image .csv .xls
Figure 22: Portfolio of borrowing types in Yorkshire and The Humber
Excluding mortgages, short-term credit and utilities
Source: Equifax
Download this chart Figure 22: Portfolio of borrowing types in Yorkshire and The Humber
Image .csv .xls
Figure 23: Portfolio of borrowing types in the East Midlands
Excluding mortgages, short-term credit and utilities
Source: Equifax
Download this chart Figure 23: Portfolio of borrowing types in the East Midlands
Image .csv .xls
Figure 24: Portfolio of borrowing types in the West Midlands
Excluding mortgages, short-term credit and utilities
Source: Equifax
Download this chart Figure 24: Portfolio of borrowing types in the West Midlands
Image .csv .xls
Figure 25: Portfolio of borrowing types in the East England
Excluding mortgages, short-term credit and utilities
Source: Equifax
Download this chart Figure 25: Portfolio of borrowing types in the East England
Image .csv .xls
Figure 26: Portfolio of borrowing types in London
Excluding mortgages, short-term credit and utilities
Source: Equifax
Download this chart Figure 26: Portfolio of borrowing types in London
Image .csv .xls
Figure 27: Portfolio of borrowing types in the South East England
Excluding mortgages, short-term credit and utilities
Source: Equifax
Download this chart Figure 27: Portfolio of borrowing types in the South East England
Image .csv .xls
Figure 28 - Portfolio of borrowing types in the South West England
Excluding mortgages, short-term credit and utilities
Source: Equifax
Download this chart Figure 28 - Portfolio of borrowing types in the South West England
Image .csv .xls
Figure 29: Portfolio of Borrowing Types in Wales
Excluding mortgages, short-term credit and utilities
Source: Equifax
Download this chart Figure 29: Portfolio of Borrowing Types in Wales
Image .csv .xls
Figure 30: Portfolio of borrowing types in Scotland
Excluding mortgages, short-term credit and utilities
Source: Equifax
Download this chart Figure 30: Portfolio of borrowing types in Scotland
Image .csv .xls