
Table of contents
- Acknowledgements
- Main points
- An introduction to unpaid work in official statistics – what is it and how is it counted?
- Why is it important to measure the value of unpaid work?
- Changes in the value and division of unpaid care work in the UK, 2000 to 2015
- Changes in the division of unpaid care between 2000 and 2015: Part 1, childcare
- Changes in the division of unpaid care between 2000 and 2015: Part 2, adult care
- Valuation of care
- References
- Background notes
1. Acknowledgements
Professor Jonathan Gershuny and Dr Jooyeoun Suh – Centre for Time Use Research, University of Oxford
Department of Sociology, University of Oxford
Economic and Social Research Council (funding the 2015 UK Harmonised European Time Use Survey)
Professor Shirin Rai, University of Warwick
Dominic Webber, Office for National Statistics
2. Main points
The amount of time that the average person cares for a child increased by 1.5% between 2000 and 2015.
The average amount of time that parents devote each day to childcare fell by 5.7%, from an average of 1 hour and 33 minutes per parent in 2000 to 1 hour and 27 minutes in 2015. In contrast, the average amount of childcare provided by 60 and overs and siblings increased over this same period.
In 2015, mothers spent, on average, 1 hour and 57 minutes per day providing childcare compared to 2 hours and 4 minutes per day in 2000. Despite this fall, mothers are still providing 74% of total childcare time in 2015.
The amount of time that fathers devoted to childcare fell by an average of 2 minutes per day. Despite the overall fall, fathers whose youngest child is pre-school age spent more time caring for children in 2015 than they did in 2000.
In 2015, parents with a degree or higher provided on average 43 minutes of developmental care per day compared to 32 minutes per day for parents with GCSE or below education.
The estimated value of unpaid childcare in 2015 was £132.4 billion, with 69% of that value accounted for by females.
The estimated value of time providing unpaid adult care is £7.97 billion, with 59% accounted for by females.
On average, both males and females over 50 have increased the amount of time devoted to unpaid caring of adults, by 15% and 21% respectively between 2000 and 2015.
In 2015, compared to those in higher occupations, those in routine or intermediate occupations both provided 28% more adult care on average for members of the same household, but 49% and 36% less (respectively) adult care for members of other households.
Back to table of contents3. An introduction to unpaid work in official statistics – what is it and how is it counted?
The unpaid work1 reported in this report relates to non-market services which households either produce for themselves or for other households.
As agreed internationally within the System of National Accounts (SNA, 2008) the value of this unpaid work is excluded from gross domestic product as it falls outside of what is known as the "Core Production Boundary". The implication of this is that gross domestic product (GDP) measures the value of paid work, with few exceptions2, but GDP does not measure the value of services which households produce themselves as unpaid forms of work.
Instead household unpaid work is separated out into what is known as the "general production boundary" (SNA, 2008). Within the general production boundary it is irrelevant that work is unpaid. Rather, the criteria which defines work as productive, and therefore of interest to measure, is known as the "third party criterion" which stipulates that an activity is deemed as productive if it could be contracted out to a market provider under usual circumstances (Reid, 1934). An extension to the national accounts called a "Satellite account" is used to value unpaid work. As the unpaid work being valued is carried out by households rather than businesses or government, this is called the "Household satellite account".
Notes:
For more information on unpaid work and the household satellite accounts refer to the background notes.
Goods produced for own consumption and the value of owner occupied housing are two exemptions from this rule.
4. Why is it important to measure the value of unpaid work?
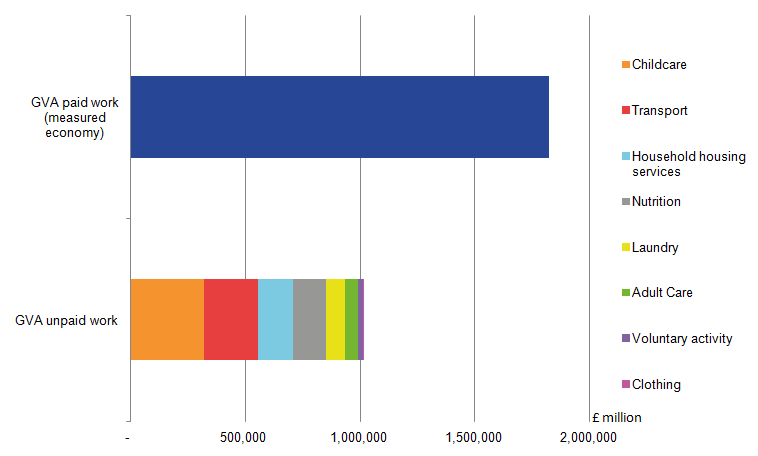
The latest household satellite accounts valued unpaid work at £1 trillion for the year 2014. This compares to gross domestic product (GDP) which was £1.8 trillion in current prices in the same year.
The unpaid productive activity which is valued in the household satellite accounts is important to measure because it directly feeds into household living standards (Stiglitz et al., 2009). Many households are reliant on unpaid household services because they can’t afford to contract them out. On the other hand, some households prefer to carry out their own childcare as they see their own service as superior to a market equivalent. There may be many reasons which determine the reasons for households carrying out service work for themselves, not least the saving of disposable income which can then be spent on other goods and services of their choosing.
Without a quantification or valuation of the extent of unpaid productive activity the value of unpaid work may be under-represented in official statistics (it’s not counted in gross domestic product for example). Conceptually the use of a household satellite account allows work in the economy to be valued regardless of whether it is paid and hence better represents full extent of productive services.
Figure 1 shows the proportionate sizes of both GDP and the unpaid productive work not counted in GDP highlighting the respective proportions of each type of unpaid work included in the household satellite accounts (represented in terms of the share of gross value added1 to the economy).
Figure 1: Total value of UK GDP and unpaid work
UK, 2014
Source: Office for National Statistics Household Satellite Accounts
Notes:
- Current prices.
Download this image Figure 1: Total value of UK GDP and unpaid work
.png (10.7 kB) .xlsx (88.3 kB)
Notes:
- The sum of all the Gross Value Added in a country adjusted for taxes and subsidies represents Gross Domestic Product.
5. Changes in the value and division of unpaid care work in the UK, 2000 to 2015
This report analyses the 2000 and 2015 time use surveys to get a better understanding of the unpaid care work recorded in the household satellite accounts. The 2000 and 2015 time use surveys are the two most recent full UK time use surveys available and hence the release of the 2015 data offers an opportunity to analyse change in unpaid care activity which has not been available in the past 15 years.
According to our latest household satellite accounts (which include both passive and active care) childcare and adult care combined represented 37% of the total value of unpaid work in 2014 accounting for approximately £380 billion in gross value added to the economy. However, until now, little was known about the workforce behind that unpaid work. By using time use data we can identify who is producing unpaid household services and for how long they work thereby enhancing our existing household satellite accounts.
The definitions of care work in this report are narrower than in the household satellite account and as such estimates will only focus on what is termed as "active care" where care activities are active as opposed to simply being "on call" or passively being present which is known as "passive care". Active care can include feeding a child or washing an adult as opposed to passive care which may include time when a responsible person is on call if they are needed but perhaps engaged in their own activity (watching TV or doing the gardening) during that time.
It is important to recognise that both active care and passive care are valuable in their own right. Consider the example of a fire fighter. They are not fighting fires for the entire time that they are working, but their time "on call" is still paid. In the case of care giving, care givers are on call when providing passive care. They sacrifice being elsewhere during this time in order to provide active care should it be necessary. Due to the way that time use statistics are developed, only active care is recorded and therefore analysed in this report.
Feedback from stakeholders1 has reinforced our view that understanding the allocation of care responsibilities across households, families and communities is a high priority. The shared nature of care responsibilities in the UK has been highlighted as a current policy issue where evidence is in high demand. Therefore, this report is structured for that purpose analysing care responsibilities for different profiles of care givers.
In terms of structure the report is split into two sections, the first will analyse the division of unpaid care work within households and the wider community and the second will construct value estimates for unpaid care work in the UK. All estimates in this report refer to those aged 8 and over in the UK population.
Notes:
- Recent feedback from PSA Care Commission Policy Makers event - Valuing care: finding a way forward organised by the Fawcett Society.
6. Changes in the division of unpaid care between 2000 and 2015: Part 1, childcare
Childcare provided by parents, foster parents and adopted parents in 2000 and 2015
The first section looks at the role of the parents in providing unpaid childcare. To control for the effect of child age on the duration of childcare given, parents are split into those whose youngest child (living in the same household) is either at pre-school, primary school or at secondary school1.
The first results in this report are presented in figure 2 which shows childcare in 3 dimensions. Firstly the division of childcare is analysed based on the gender of the parent, followed by changes based on the age of the youngest son or daughter in the household. Finally, it shows how the first two dimensions have changed between 2000 and 2015.
Childcare is shown as a total and split into two sub-categories - primary childcare and developmental childcare. This split is used throughout the childcare section and uses the following definitions :
- primary childcare refers to activities such as: feeding, waking, supervising at the playground; looking after a sick child and other unspecified childcare
- developmental care refers to activities such as: reading to or playing with children; helping children with homework
Figure 2: Average daily minutes of childcare provided, by gender of parent and age of their youngest child in household
UK, 2000 and 2015

Source: UK Harmonised Time Use Survey (HETUS), 2000 and 2015
Notes:
- Excludes childcare for children living in other household.
- Mean averages.
Download this image Figure 2: Average daily minutes of childcare provided, by gender of parent and age of their youngest child in household
.png (22.2 kB) .xls (27.6 kB)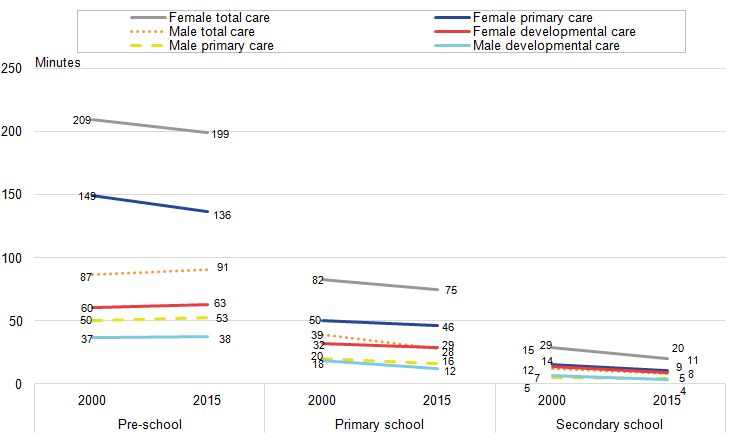
The results in figure 2 show that in 2015 mothers where the age of their youngest child falls into any of the age categories, continue to provide higher levels of childcare than fathers. This trend has been observed both historically and internationally (Samman, et al., 2016, p.17-18). However, since 2000 mothers have begun to spend less time giving unpaid childcare.
For those mothers whose youngest child is at pre-school age, their time giving primary care has fallen from an average of 149.0 minutes per day to 136.3 minutes per day (all averages in this report are mean averages). This represents approximately an 8.5% decrease between 2000 and 2015.
For the same type of mothers, developmental care increased slightly, from an average of 60.3 minutes per day to 63.1 minutes per day, representing a 4.6% increase between 2000 and 2015.
The results in figure 2 demonstrate that fathers whose youngest child is of pre-school age are still increasing their share of childcare time. This follows the trend seen more widely by Seville (2014) of fathers providing increasing amounts of childcare time. However, in this analysis the trend is only noted for fathers whose youngest child is below school age.
Fathers whose youngest child was of preschool age provided, on average, 90.7 minutes of total childcare time (primary and developmental care combined) per day in 2015 compared to 86.7 minutes per day for similar fathers in 2000 (a 4.7% increase).
Even though fathers in 2015 demonstrate an increased share of the childcare, it remains clear that mothers are still bearing the majority. Fathers whose youngest child was at pre-school age provided an average childcare proportionate to 45.5% of that provided by mothers whose youngest child was of pre-school age in 2015 (In 2000 the same proportion stood at 41.4%).
Finally, figure 2 shows that between 2000 and 2015 total childcare provision times have fallen for fathers and mothers whose youngest child is at primary or at secondary school. This trend can also be seen in the time devoted to primary and developmental care.
Across the three groups of parents, overall, the average amount of time that parents devote each day to childcare fell by 5.7%, from an average of 1 hour and 33 minutes per parent in 2000 to 1 hour and 27 minute in 2015. In 2015, mothers spent, on average, 1 hour and 57 minutes per day providing childcare compared to 2 hours and 4 minutes per day in 2000 but despite this fall, mothers are still providing 74% of total childcare time in 2015. The amount of time that fathers devoted to childcare fell by an average of 2 minutes per day. Despite the overall fall, fathers whose youngest child is pre-school age spent more time caring for children in 2015 than they did in 2000. The results for parental childcare time are in contrast to overall the amount of time that the average person cares for a child across the population, which increased by 1.5% between 2000 and 2015.
National Statistics Socio-Economic Status (NSSEC) of parent and childcare provision
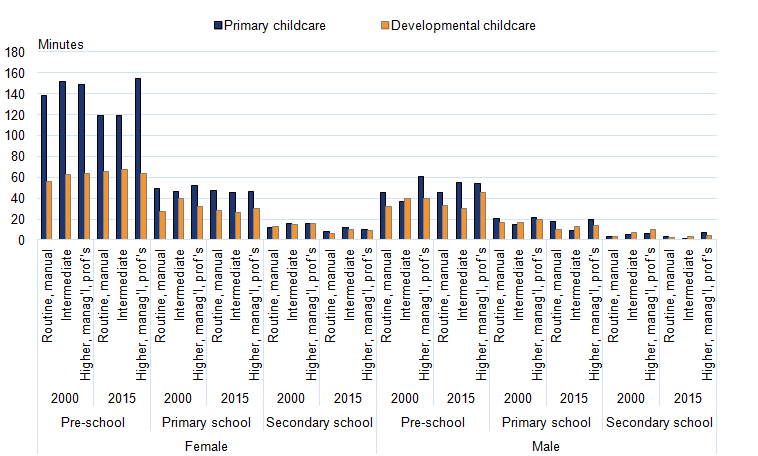
Figure 3: Average daily minutes of childcare provided by gender, and National Statistics Socio-Economic Classification status of parent, and age of their youngest child in household
UK, 2000 and 2015
Source: UK Harmonised Time Use Survey (HETUS), 2000 and 2015
Notes:
- Excludes childcare for children living in other households.
- Mean averages.
Download this image Figure 3: Average daily minutes of childcare provided by gender, and National Statistics Socio-Economic Classification status of parent, and age of their youngest child in household
.png (17.3 kB) .xls (21.5 kB)
When looking at childcare provided by parents from different National Statistics Socio-Economic Status (NSSEC) categories, figure 3 shows that the fall in primary care time given by mothers whose youngest child was at pre-school age in 2015 was likely to be driven, in part, by mothers in either intermediate occupations or routine and manual occupations. Primary care time has fallen from 2000 to 2015 in these occupations by 21.9% and 14.1% respectively. Similar mothers in higher managerial, administrative and professional occupations saw the opposite change, where their primary care time increased over the same period from an average of 148.6 minutes to 154.4 minutes per day, rising by 4.0%.
Between 2000 and 2015 the amount of primary care provided by fathers in intermediate occupations whose youngest child was of pre-school age increased from an average time of 36.7 minutes per day to 54.7 minutes per day, rising 49% over that period. However, fathers of pre-school aged children in higher occupations provided less primary care time between 2000 and 2015 and those in routine or manual occupations provided the same primary care time in 2015 as they did in 2000.
Figure 3 also shows that the largest fall in developmental care time was recorded for fathers in higher occupations whose youngest child was of secondary school age. As a group, they spent an average of 4.5 minutes per day providing developmental care in 2015. This compares to an average 10.2 minutes per day providing developmental care for similar fathers in 2000.
Highest qualification of parent and childcare provision
Figure 4: Average daily minutes of childcare provided by qualification of parent, and age of their youngest child in household
UK, 2000 and 2015

Source: UK Harmonised Time Use Survey (HETUS), 2000 and 2015
Notes:
- Excludes childcare for children living in other households.
- Mean averages
Download this image Figure 4: Average daily minutes of childcare provided by qualification of parent, and age of their youngest child in household
.png (15.1 kB) .xls (28.2 kB)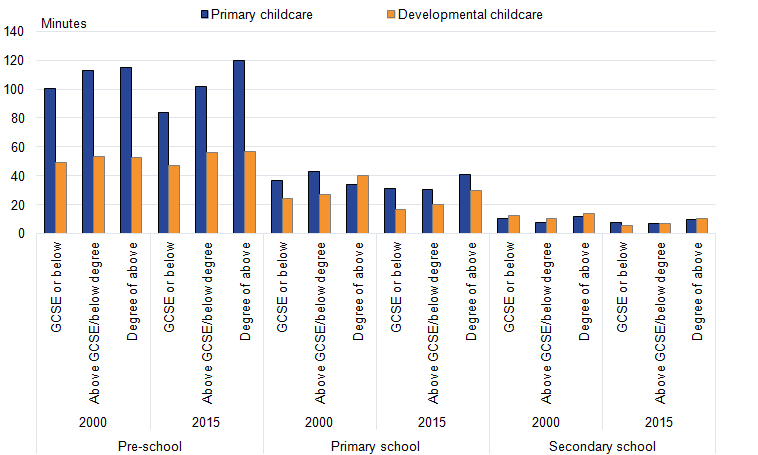
Figure 4 looks at the amount of childcare time a parent provides based on their highest qualification and the age of the youngest child. The results are not split to show the difference between the parents based on gender as trends were broadly similar for both genders.
The results of this analysis suggest that if a parent has a high qualification, it is more likely that they will provide more childcare per day than another parent with a lower qualification. In addition, for parents whose youngest child is either pre-school or primary school age they have increased the amount of primary childcare time they provide between 2000 and 2015. This is in contrast to lower-qualified parents who have decreased the amount of primary childcare time they provide over the same time period.
Household income of parent and childcare provision
Figure 5: Average daily minutes of childcare provided by gender of parent, equivalised household income band, and age of their youngest child in household
UK, 2015

Source: UK Harmonised Time Use Survey (HETUS) 2015
Notes:
- Excludes childcare for children living in other households.
- Mean averages
Download this image Figure 5: Average daily minutes of childcare provided by gender of parent, equivalised household income band, and age of their youngest child in household
.png (13.9 kB) .xls (30.7 kB)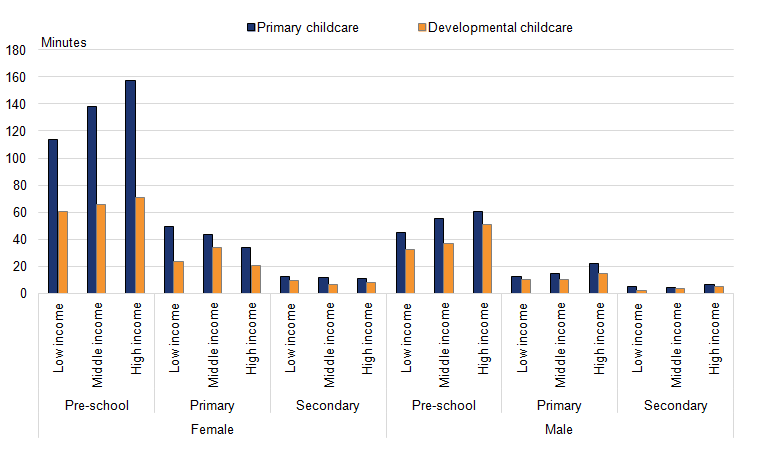
Figure 5 highlights the relationship between parental childcare time by gender, equivalised household income band and the age of the youngest child. Household income is therefore adjusted by the amount of dependent children and adults in the household and split into three equal-sized groups depending on where each household ranks with their equivalised household income.
Interestingly, for both fathers and mothers whose youngest child is at pre-school age, the level of their household income shares a positive relationship to the level of both primary care and developmental care they provide.
In 2015, for parents whose youngest child is at primary school age, the higher the household income the more time fathers spent providing primary care and the less time mothers spent providing primary care. This demonstrates a more even balance of primary childcare for parents whose youngest child is of primary school age where the gender division between high income parents primary care was 40% father and 60% mother, whereas the gender division between low income parents was 20% father to 80% mother.
Childcare given by the 60 and overs or siblings in 2000 and 2015
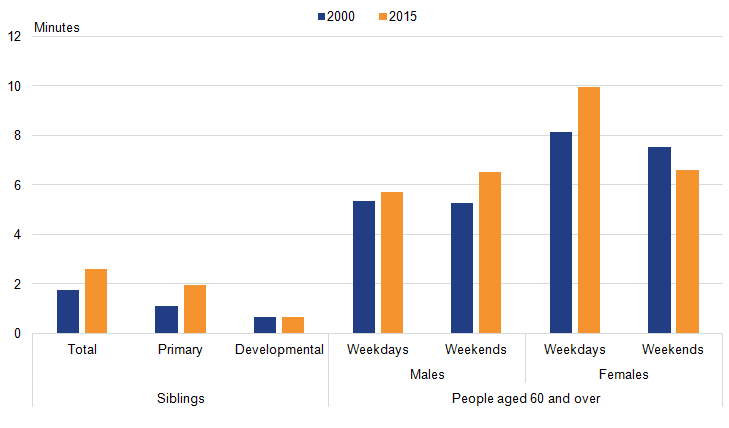
Figure 6: Average daily minutes of childcare provided by siblings and people aged 60 and over
UK , 2000 and 2015
Source: UK Harmonised Time Use Survey (HETUS), 2000 and 2015
Notes:
- Childcare by siblings only counted if it is for children living in same household.
- Childcare by 60 and overs is only included if it is for children living in other households.
- Mean averages
Download this image Figure 6: Average daily minutes of childcare provided by siblings and people aged 60 and over
.png (9.3 kB) .xls (28.7 kB)
The left-hand side of figure 6 shows the amount of childcare time provided by siblings who are 30 or under whose brothers or sisters live in the same household. On the right-hand side of the chart, the childcare time for the 60 and overs is shown, where they are caring for children in other households. Here the childcare time of the 60 and overs for children in other households is used as a proxy to measure the exposure of their generation to childcare commitments. Both siblings and older people are termed as potential care givers as they do not necessarily have any care giving responsibilities as a result of the definition used to define them.
Siblings are defined as under 30-years-old, having a brother or sister living with them and having no son or daughter living in their household. The childcare provision of siblings excludes care of children living outside of their household so the assumption can be made that all but exceptional circumstances, childcare provision was for their sibling.
Figure 6 shows that siblings gave an increased amount of childcare time in 2015 than similar siblings in 2000, the average minutes per day across all siblings meeting the aforementioned criteria rising from 1.8 minutes per day in 2000 to 2.6 minutes per day in 2015.
Overall childcare provision has also increased for the "60 and overs". Female childcare provision to children from other households on weekdays increased by 22.4% from 8.1 minutes to 9.9 minutes per day while male childcare provision on weekends increased by 23.8% from 5.2 to 6.5 minutes per day. Although, females who are 60 or over provided more childcare time overall in 2015 they provided less childcare during weekend days than similar women in 2000, providing 7.5 minutes per day in 2000 and 6.6 minutes per day in 2015, representing a 12.5% fall.
This may represent a shift in behaviour where older males are now helping out more with childcare (likely for grandchildren) particularly on weekends and thus offsetting some of the decrease in weekend childcare time provided by older females.
Childcare given by parents of at least one disabled child in 2000 and 2015
Figure 7: Average daily minutes of childcare provided by parents who have at least one disabled son or daughter living in their household
UK, 2000 and 2015
Source: UK Harmonised Time Use Survey (HETUS), 2000 and 2015
Notes:
- Excludes childcare for children living in other households.
- Mean averages.
Download this chart Figure 7: Average daily minutes of childcare provided by parents who have at least one disabled son or daughter living in their household
Image .csv .xlsFigure 7 shows that parents who have at least one disabled child have also increased their childcare time provision between 2000 and 2015 having risen from 67.4 minutes to 76.2 minutes per day over that time.
When splitting this total childcare into sub-categories of childcare type, it is clear that, the majority of childcare time provision by parents of disabled children is still devoted to primary childcare. However, the increase in childcare time provision in total childcare time between 2000 and 2015 has been driven by increasing amounts of developmental childcare time. Primary childcare time provision by parents who have at least one disabled child has stayed approximately the same at 47.6 minutes per day in 2000 and 47.8 minutes per day in 2015. Developmental care increased from 19.8 minutes per day in 2000 to 28.3 minutes per day, over the same time period.
Back to table of contents7. Changes in the division of unpaid care between 2000 and 2015: Part 2, adult care
Results in the adult care section are based on mean averages across all those over 8-years-old in the UK population. This has been done to avoid people needing to identify themselves as responsible for adult care. Rather, the approach aims to capture all the adult care in the UK population (aged 8 and over) regardless of whether they class themselves as responsible for adult care. As a result, the average time per person should be used to assess differences across years or across groups rather than an indication of how much adult care time the average care giver provides if they are responsible for adult care.
The estimates of adult care contained within this report all relate to "active" adult care activity where the carer is specifically undertaking tasks such as:
- physical care of a disabled, sick or elderly adult; washing, cutting hair, massaging; mental help, information and advice; accompanying an adult to a doctor or on visits to hospitals
The definition in this report also excludes tasks such as:
- meal preparation, cleaning, gardening or DIY for disabled or elderly adults
Age and adult care provision
Figure 8: Average daily minutes of adult care provided by those aged 8 or over by age group
UK, 2000 and 2015

Source: UK Harmonised Time Use Survey (HETUS), 2000 and 2015
Notes:
- Mean averages.
- Cases included in analysis regardless of whether respondents identify as being responsible for adult care.
Download this image Figure 8: Average daily minutes of adult care provided by those aged 8 or over by age group
.png (8.6 kB) .xls (28.7 kB)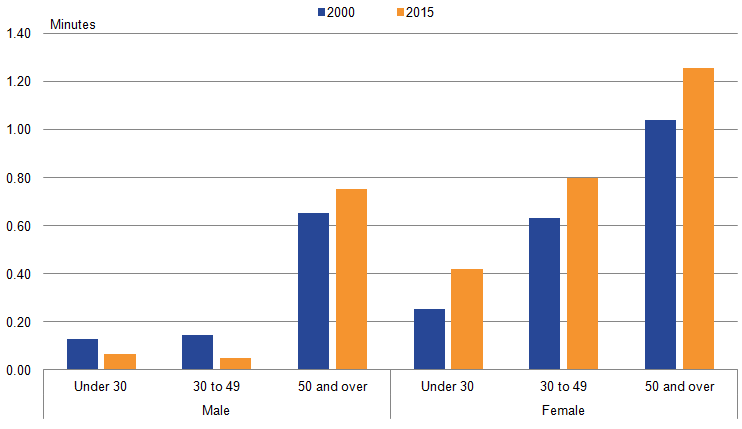
Figure 8 shows the average minutes of adult care provided per person over 8 years of age in the UK by the gender and age group. This data indicates that in both 2000 and 2015 females were on average providing the greatest adult care time. Males who were over 50 also contributed a higher average time of adult care per person than males of a lower age group.
In 2015, females across the age groups saw increases in the average daily amount of adult care provided per person over 8-years-old amounting to a rise of 67% for under-30s, a rise of 27% for 30 to 49-year-olds and 21% for the 50 and overs, when compared to 2000.
In 2015 males who were over 50 provided an average daily adult care per person which was approximately 15% higher than that provided by males of that age in 2000. The trend was in the opposite direction for males under 50 though whose average adult care daily provision time fell by 49% for the under-30s and by 67% for the 30 to 49s, when compared to males of similar ages in 2000.
National Statistics Socio-Economic Status (NSSEC) and adult care provision
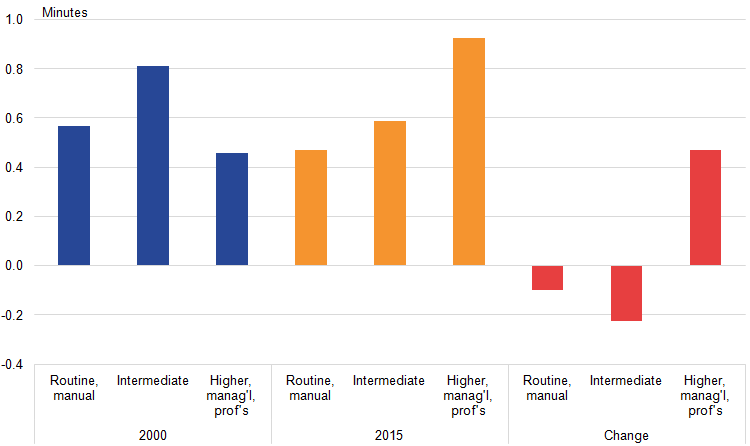
Figure 9: Average daily minutes of adult care provided by those aged 8 or over to members of other households by the National Statistics Socio-economic Classification (NS-SEC) of the carer
UK, 2000 and 2015
Source: UK Harmonised Time Use Survey (HETUS), 2000 and 2015
Notes:
- Mean averages.
- Cases included in analysis regardless of whether respondents identify as being responsible for adult care.
Download this image Figure 9: Average daily minutes of adult care provided by those aged 8 or over to members of other households by the National Statistics Socio-economic Classification (NS-SEC) of the carer
.png (9.4 kB) .xls (29.2 kB)
Figure 9 shows the average daily minutes of adult care provided to members of other households by persons over 8 years of age based on their National Statistics Socio-Economic Status (NSSEC) category. This breakdown suggests that those of higher socio-economic status in 2015 were providing a higher-average daily adult care time per person than the same socio-economic category in 2000. In 2000 those in routine or intermediate occupations were engaging in more adult care on average than they were in 2015.
Figure 10: Average daily minutes of adult care provided by those aged 8 or over to members of the same household by the National Statistics Socio-economic Classification (NS-SEC) of the carer
UK, 2000 and 2015

Source: UK Harmonised Time Use Survey (HETUS), 2000 and 2015
Notes:
- Mean averages.
- Cases included in analysis regardless of whether respondents identify as being responsible for adult care.
Download this image Figure 10: Average daily minutes of adult care provided by those aged 8 or over to members of the same household by the National Statistics Socio-economic Classification (NS-SEC) of the carer
.png (9.2 kB) .xls (29.2 kB)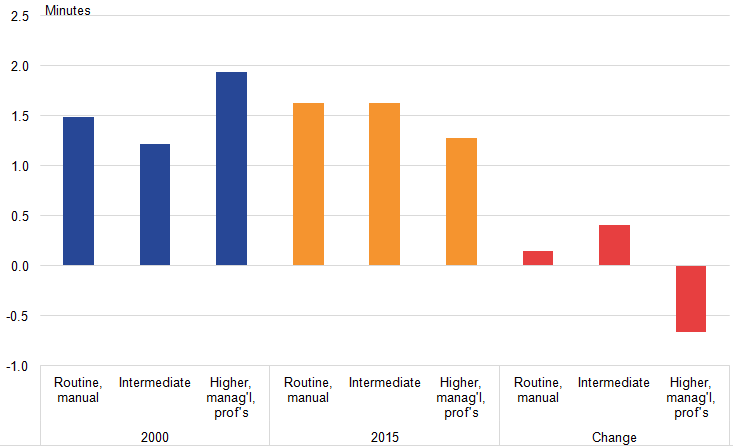
Figure 10 shows the average daily minutes of adult care provided to members of the same household by persons over 8 years of age based on their NSSEC category.
The chart shows that those care givers in both routine and intermediate NSSEC categories have both increased the amount of time per day which they provide adult care to members of their own household.
Those in routine occupations gave an average of 1.5 minutes per day of adult care for members of same household in 2000 and 1.6 minutes per day of adult care for members of same household in 2015, while those in intermediate occupations provided an average of 1.2 minutes per day of adult care for members of the same household in 2000 and 1.6 minutes in 2015.
Figure 10 shows that the amount of time that those in higher occupations provided adult care for members of the same household decreased between 2000 and 2015 from an average of 1.9 minutes per day in 2000 to 1.3 minutes per day in 2015.
This is in contrast to figure 9, which showed that the amount of time those in higher occupations provided adult care for members of other households increased between 2000 and 2015.
Gender and type of adult care provision
Figure 11: Average adult care time given by those aged 8 or over by gender and type of care
UK, 2000 and 2015

Source: UK Harmonised Time Use Survey (HETUS), 2000 and 2015
Notes:
- Mean averages.
- Cases included in analysis regardless of whether respondents identify as being responsible for adult care.
Download this image Figure 11: Average adult care time given by those aged 8 or over by gender and type of care
.png (9.5 kB) .xls (29.2 kB)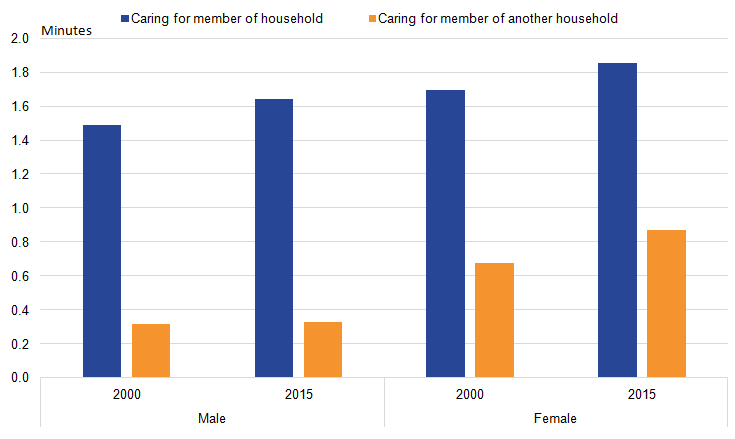
Figure 11 highlights that females provide more adult care time on average for members of other households than males provide. The same is also true, albeit to a smaller degree, for provision of adult care for members of the carer’s household.
Back to table of contents8. Valuation of care
Valuation of unpaid childcare
The following section reports the market equivalent value of specific groups of parents. The value of childcare for individual parents is broken down by the parent’s gender and the age of their youngest child.
Table 1: The value of average childcare time provided by parents by gender of parent and age of their youngest child in household, UK, 2015
| UK, 2015 | |||||
| Male | Female | ||||
| Annual value of care per person (£) | Share of total care value (%) | Annual value of care per person (£) | Share of total care value (%) | ||
| Age of youngest child | Pre-school age | 7,895.94 | 33 | 15,860.17 | 67 |
| Primary school age | 2,475.39 | 28 | 6,297.94 | 72 | |
| Secondary school age | 697.72 | 28 | 1,779.14 | 72 | |
| Source: UK Harmonised European Time Use Survey, 2015 | |||||
Download this table Table 1: The value of average childcare time provided by parents by gender of parent and age of their youngest child in household, UK, 2015
.xls (27.6 kB)Table 1 shows the average value of the unpaid childcare provided by parents based on the age of their youngest child in 2015.
Annually it is estimated that mothers whose youngest child was at pre-school age provided childcare worth £15, 860 - approximately twice the value of fathers with youngest children of pre-school age whose average annual childcare in 2015 was valued at £7,896.
The value of parent’s annual childcare, whose youngest child was at primary school age in 2015 was £2,475 for fathers and £6,298 for mothers. Proportionately this means that fathers’ childcare was worth approximately 39.3% of mothers’ childcare, when valued at market rates. Childcare provided by parents whose youngest child was of secondary school age had the lowest value of the three youngest child age categories, reflecting the fact that less time is devoted to this age group.
Mothers whose youngest child was at secondary school age provided childcare worth £1,779 in 2015 which is around 11.2% when compared to the value of care which mothers whose youngest child was of pre-school age in 2015.
Fathers whose youngest child was of secondary age in 2015 provided childcare worth an annual average of £698 which is approximately 8.8% of the value of childcare provided by fathers whose youngest child was of pre-school age in 2015.
Table 2: Total value of childcare provided by those aged 8 and above for children up to 17 years old, UK, 2015
| UK, 2015 | ||
| Male | Female | |
| Primary care - average daily value per person (£) | 1.2 | 3.6 |
| Developmental care - average daily value per person (£) | 2.7 | 4.9 |
| Relevant population in the UK (millions) | 28.5 | 29.7 |
| Population primary care - Gross daily value (£millions) | 34.4 | 106.8 |
| Population developmental care - Gross daily value (£millions) | 76.6 | 144.8 |
| Population primary care - Gross annual value (£bn) | 12.5 | 39.0 |
| Population developmental care - Gross annual value (£bn) | 28.0 | 52.9 |
| Population total value from childcare (£bn) | 40.5 | 91.8 |
| Ratio | 0.3 | 0.7 |
| Total value of active childcare in UK given by 8+ age in 2015 (£bn) | 132.3 | |
| Source: UK Harmonised European Time Use Survey, 2015 | ||
Download this table Table 2: Total value of childcare provided by those aged 8 and above for children up to 17 years old, UK, 2015
.xls (27.6 kB)Table 2 shows the value of all childcare for children up to 17 years old in the UK split into two columns based on the gender of the care provider. The results indicate that the total value of the unpaid childcare provided for children up to the age of 17 was £132 billion in 2015.
However, this value only takes into account the wages of those carrying out the childcare and no other components such as taxes, subsidies and profit which are be priced into childcare within the paid economy. In addition, this value does not include time where a person acts as a responsible adult in a passive supervisory capacity, simply being present in case the child has an accident or a need for care at any point of that time (passive care).
Within the household satellite accounts (ONS, 2016) released this year, passive care and all other price components are included and hence the valuation of childcare is much higher at around £321 billion (in 2014). The estimate from this report will now provide some understanding of the scale of specific types of childcare, and how much of the value of childcare relates to wages as opposed to other costs covered within a market price.
The time use analysis carried out in this report allows a gender based valuation of childcare to be calculated. Table 2 shows the results of this calculation which indicate that the total childcare performed by females makes up 69% of the total value of childcare for under-17s in the UK worth £92 billion, whereas childcare provided by males made up the remaining 31% and was worth £41 billion.
Valuation of unpaid adult care
By applying suitable market equivalent wage rates the adult care time measured in this report can be valued in a similar way to those estimates relating to childcare. Similarly to childcare, it is important to recognise that the definition of adult care in this report is much narrower than the full definition contained within the household satellite accounts (ONS, 2016). As with childcare, the definition of adult care used in this report excludes what is termed as "passive care", where an adult requires a carer to be present but not actively carrying out adult care tasks.
Based on this definition of adult care, table 3 shows the total value of active adult care by males and females in the UK in 2015.
Table 3: Total value of adult care provided by those aged 8 and above, UK, 2015
| UK, 2015 | ||
| Male | Female | |
| Care of household member per person | 0.3 | 0.3 |
| Care of person from another household member per person | 0.1 | 0.1 |
| Relevant population in the UK (millions) | 28.5 | 29.7 |
| Population primary care - Gross daily value (millions) | 7.5 | 8.8 |
| Population developmental care - Gross daily value(millions) | 1.5 | 4.1 |
| Population primary care - Gross annual earnings (bn) | 2.7 | 3.2 |
| Population developmental care - Gross annual value bn) | 0.6 | 1.5 |
| Population total value of childcare (bn) | 3.3 | 4.7 |
| ratio | 0.4 | 0.6 |
| Total value of active adult care in UK given by 8+ age in 2015 (£bn) | 8.0 | |
| Source: UK Harmonised European Time Use Survey, 2015 | ||
Download this table Table 3: Total value of adult care provided by those aged 8 and above, UK, 2015
.xls (27.6 kB)9. References
Commissions of the European Communities-Eurostat, International Monetary Fund, Organization for Economic Co-operation and Development, United Nations, World Bank. (2008). System of National Accounts. Brussels/Luxembourg, New York, Paris, Washington, D.C.
ONS (2016) Household satellite accounts: 2005 to 2014. Office for National Statistics, Newport.
Samman, E., Presler-Marshall, E., and Jones, N. (2016). Women’s Work: Mothers, Children and the Global Childcare Crisis. London: Overseas Development Institute.
Sevilla, A., and Borra, C. (2014) Time investments in children in the UK: the role of college competition. In: NCRM Research Methods Festival 2014, 8th - 10th July 2014, St. Catherine's College, Oxford.
Back to table of contents